Jwan Kamla
PhD Candidate
Nottingham Transportation Engineering Centre (NTEC)
Faculty of Engineering, University of Nottingham, University Park, Nottingham, NG7 2RD
Tel: +44 7429908222; Email: [email protected], [email protected]
Tony Parry
Associate Professor
Nottingham Transportation Engineering Centre (NTEC)
Faculty of Engineering, University of Nottingham, University Park, Nottingham, NG7 2RD
Tel: +44 115 84 68450; Email: [email protected]
Andrew Dawson
Associate Professor
Nottingham Transportation Engineering Centre (NTEC)
Faculty of Engineering, University of Nottingham, University Park, Nottingham, NG7 2RD
Tel: +44115 95 13902; Email: [email protected]
Submission Date: 11/March/2016
4075 WORDS FOR TITLE, AUTHOR, AND ABSTRACT PAGE TO CONCLUSION 119 WORDS IN FIGURES AND TABLES CAPTIONS
2500 WORDS FOR 5 FIGURES AND 5 TABLES
REFERENCES=913 (AS REFERENCES WAS GREATER THAN 35, SO I EXCLUDED FROM THE WORLD COUNT)
ABSTRACT
Roundabouts have been widely used in the UK on all road classes, as they are generally considered safer than other types of intersections. The objective of this study is to examine geometric and traffic characteristics and their influence on accident numbers.
The study comprises 70 roundabouts (284 approaches). The data used included all recorded vehicle accidents, geometric, and traffic characteristics for whole roundabouts, within the circulatory lanes, and at approaches to the roundabouts. Random-parameters negative binomial count data models were used to estimate model parameters and the models were compared with fixed-parameters negative binomial count data models.
The random-parameters models provide better goodness of fit and more variables were found to be significant, relative to the fixed-parameters model. Total approach traffic, truck percentage, entry width, inscribed circle diameter, number of lanes, and presence of traffic signals were found as significant variables influencing accident occurrences.
INTRODUCTION
Roundabout numbers continue to rise in countries and regions where they are already common, and especially, they are earning popularity in places where there were few
roundabouts in the past. With respect to traffic operations and safety, roundabouts are often favoured over other intersection types. The use of roundabouts can improve safety by
reducing or changing conflict types, reducing accident severity, and leading drivers to reduce speeds (1) (2) (3) (4). Various studies have analysed the safety of roundabouts, with a
significant observed reduction in the number of accidents when intersections were converted to roundabouts (5) (6) (7) (8) (9) (10) (11) (12).
Geometric layout, operational analysis and safety evaluation, are significant recurring requirements for roundabout design. Small modifications in geometry can lead to
considerable changes in the safety and/or operational performance of roundabouts. The Highway Safety Manual (HSM) (13) uses traffic volume as a major input into the base condition safety performance function. Roundabouts, as substitute intersections, are likely to exhibit a similar traffic volume influence on their anticipated safety performance. Many studies have been undertaken to predict accident models depending on geometric and traffic variables using count data (Poisson or negative binomial models) (14) (15) (16) (17) (18) (19) (20). However, these studies assumed that variables (geometric and traffic) are constant across the observations (roundabouts). In some cases constraining the parameters to be constant when they actually vary across observations could lead to inconsistent and biased parameter estimates (21). However, there is potential by allowing some or all parameters to vary across observations, to account for heterogeneity across observations; for this reason, later research on general accident models (not at roundabouts) has used random-parameters; random-parameters models can be viewed as an extension of random-effects models. Rather than only influencing the intercept of the model, random-parameter models allow some or all estimated parameters, including traffic and geometric variables, to vary across observations (22) (23) (24) (25) (26). These authors found that some variables vary across roadway segments. This study examines if this heterogeneity across observations also exists at
roundabouts. The objective of the analysis presented in this paper is to relate the total number of accidents to a range of explanatory variables, and hence to determine a relationship which could be used to predict site-specific accident risks from such variables using the random-parameters negative binomial approach. Thus this study makes an advance over the previous roundabout accident models, which used fixed parameters models.
METHODOLOGY Model Estimation
There are a number of statistical methods available to predict the number of accidents on roadway segments and intersections. As accidents are non-negative, discrete Poisson or negative binomial (NB) distributions are usually the recommended model types. Past research has also indicated that crash data are characterized by over dispersion (the variance is greater than the mean), making NB regression appropriate for modelling crash data (27) (28).
However, previous studies assumed that parameters are fixed across observations (roadway segments or intersections); if the parameter estimated as fixed, the result could be biased and wrong conclusions may be drawn with respect to the independent variables. For this reason random parameters count data models were introduced (29).
Anastasopoulos and Mannering (22) describe the methodological approach behind random parameter models when applied to count data, reproduced in the following
paragraphs.
𝑃(𝑛𝑖) =
𝐸𝑋𝑃(−𝜆𝑖)𝜆𝑖𝑛𝑖
𝑛𝑖! [1]
where 𝜆𝑖 is the Poisson parameter for roundabout i, which is roundabouts i’s expected number
of accidents, E[𝑛𝑖]. Poisson regression specifies a function of explanatory variables (in this study, geometric and traffic characteristics), typically by using a log-linear function:
𝜆𝑖 = 𝐸𝑋𝑃(𝛽𝑋𝑖) [2]
where 𝑋𝑖is a vector of explanatory variables and 𝛽 is a vector of estimated parameters (21). Depending on the data, a Poisson model may not always be appropriate because the Poisson distribution restricts the mean E[𝑛𝑖] and variance VAR[𝑛𝑖] to be equal (E[𝑛𝑖] =
VAR[𝑛𝑖]). If this equality does not hold, the data are said to be under-dispersed (E[𝑛𝑖]>VAR[𝑛𝑖]) or over dispersed (E[𝑛𝑖] < VAR[𝑛𝑖]), and the standard errors of the
estimated parameter vector will be incorrect and incorrect inferences could be drawn (22). To account for this possibility, the negative binomial model is derived by rewriting:
𝜆𝑖 = 𝐸𝑋𝑃(𝛽𝑋𝑖+ 𝜀𝑖) [3]
where EXP(εi) is a gamma-distributed error term with mean 1 and variance 𝛼. The addition of this term allows the variance to differ from the mean as VAR[𝑛𝑖]= E[𝑛𝑖][1 +𝛼E[𝑛𝑖]] = E[𝑛𝑖] +𝛼E[𝑛𝑖]2. The negative binomial probability density function thus has the form (22):
𝑃(𝑛𝑖) = [
1 𝛼
(𝛼1)+𝜆𝑖] 1 𝛼 Γ[(
1 𝛼)+𝑛𝑖 ]
Γ(𝛼1)𝑛𝑖! [
𝜆𝑖
(𝛼1)+𝜆𝑖]
𝑛𝑖 [4]
where Γ(. ) is a gamma function.
To account for heterogeneity (unobserved factors that may vary across observations) with random parameters, Greene (30) has established estimation procedures (using simulated maximum likelihood estimation) for incorporating random parameters in Poisson and NB count-data models (21). An alternative to a random-parameters approach in the NB case would be to allow 𝜆 varying as a function of the mean (22). In this study, the random
parameters modelling technique is used, that allows unobserved heterogeneities for predicting accidents. To allow for such random parameters in count-data models, independent
parameters can be written as:
𝛽𝑖 = 𝛽 + 𝜑𝑖 [5]
where 𝜑𝑖 is a randomly distributed term (for example a normally distributed term with mean
0 and variance 𝛼2) which we also used in this paper. With this equation, the Poisson parameter becomes 𝜆𝑖/𝜑𝑖= EXP (𝛽𝑋𝑖) in the Poisson model and 𝜆𝑖/𝜑𝑖= EXP (𝛽𝑋𝑖 + εi) in the NB model with the corresponding probabilities for Poisson or NB now P(𝑛𝑖/𝜑𝑖) (see Eq. [1]). With this random-parameter version, the log-likelihood can be written as (22):
𝐿𝐿 = ∑ 𝑙𝑛 ∫ 𝕘(𝜑
𝑖
∀𝑖 𝜑𝑖) 𝑃 (
𝑛𝑖
𝜑𝑖) 𝑑𝜑𝑖 [6]
where 𝕘(·) is the probability density function of 𝜑𝑖. Because maximum likelihood estimation of the random-parameters Poisson and NB models’ probability estimations are
computationally cumbersome, a simulated maximum likelihood method is used. The simulation approach uses 200 Halton draws, which has been shown to provide a more efficient distribution of draws for numerical integration than random draws (22). Halton draws are sequences used to generate deterministically constructed, nearly uniformly distributed points in the interval [0, 1], that appear to be random (31).
From the estimations of the Poisson and NB models and their variations, marginal effects can be estimated which describe the relative magnitude between the dependent and independent variables based on parameter estimates. “In the case of accidents, marginal effects give the change in the number of accidents given a unit change in any independent variable, x, and are simply calculated as the partial derivative, 𝜕𝜆𝑖/𝜕𝑥, where 𝜆𝑖 is defined
NB with random-parameters models, respectively) (22). Although marginal effects are generated for each roundabout i, in the results presented later in the paper only averages over the roundabout population are listed.
Model Evaluation
Assessments were made based on statistical approaches as part of the process of selecting the most appropriate and best fitting models. Firstly the model is evaluated according to the significance of the variables included in the model. The estimated regression coefficient for each independent variable should be statistically significant. Three t-test statistics are used for testing the significance of the variables; they are 1.65, 1.96, and 2.58, respectively, for the 90%, 95%, and 99% significance level.
In addition, in order to measure the overall model fit the 𝜌𝑐2 statistic (similar to 𝑅2in regression models) is used (21). The 𝜌𝑐2 statistic is
𝜌𝑐2 = 1 − 𝐿𝐿(𝛽)/𝐿𝐿(∁) [7]
where:
𝐿𝐿(𝛽) is the log-likelihood at convergence
𝐿𝐿(∁) is the log-likelihood with constant only
Thus a perfect model has likelihood equal to one. The closer the 𝜌𝑐2 statistic it is to one the more variance the estimated model is explaining.
The likelihood ratio test was used to compare fixed- and random-parameters models using the likelihoods at convergence. The test statistic is
𝜒2 = −2[𝐿𝐿(𝛽
𝐹) − 𝐿𝐿(𝛽𝑅𝑃)] [8]
where 𝐿𝐿(𝛽𝐹) is the log likelihood at convergence for the fixed-parameters NB model, and
𝐿𝐿(𝛽𝑅𝑃) is the log likelihood of the random-parameters NB model (22). The 𝜒2 statistic is
distributed with the number of degrees of freedom equal to the difference in the number of parameters between fixed- and random-parameters models.
The two models were also compared using the relationship between actual mean values and predicted values of the response variables.
DATA DESCRIPTION
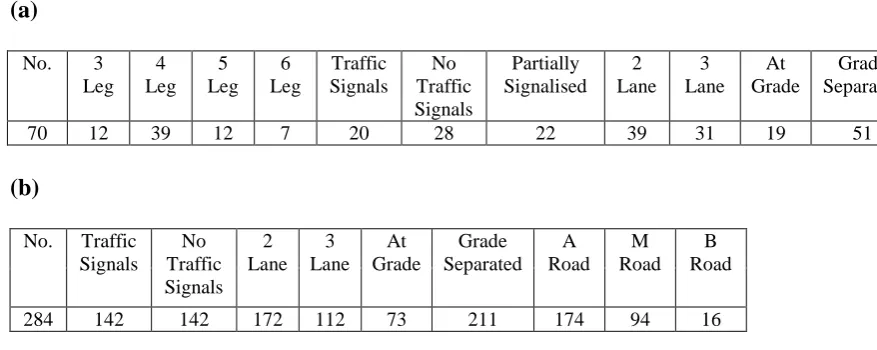
Seventy roundabouts including 284 approaches were selected in the United Kingdom (UK). They comprise nine roundabouts on motorway M1, ten roundabouts on motorway M6, six roundabouts on motorway M5, nine roundabouts on motorway M4 with the others located on different motorways and A class roads. Their characteristics are descibed in Table 1.
Accident data for all roundabouts were collected from the STATS19 database for the eleven years 2002 to 2012. This includes all injury accidents reported by police, for all vehicles. Average annual daily traffic (AADT) and percentage trucks (% AADTT) data were acquired from the UK TRADS database (traffic count data from permanently located
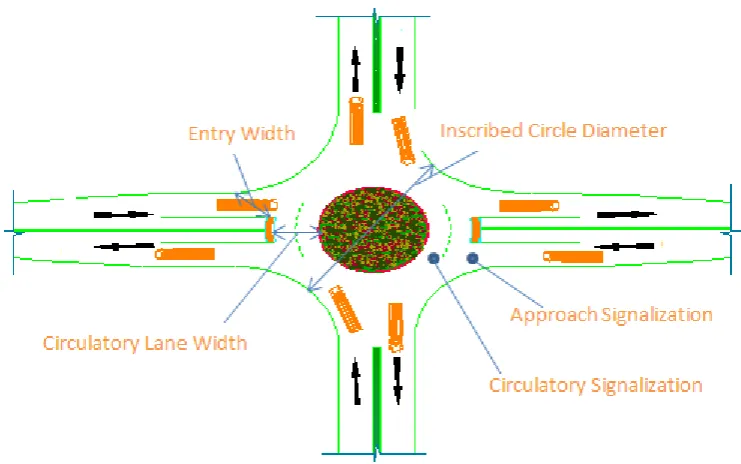
Counting Sites on the motorway and trunk road network in England) for local authority roads and from “UK National Highways Agency”, for the years 2011 and 2012. Roundabout entry width, circulatory roadway width and inscribed circle diameter were estimated for the
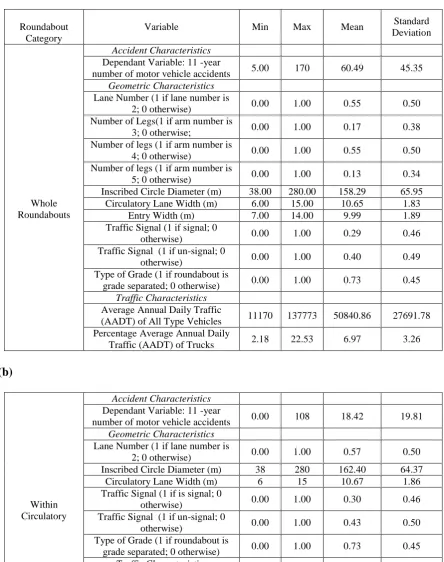
selected roundabouts from aerial photographs on an on-line mapping site. Figure 1 shows the roundabout geometric information. Summary statistics of all variables are presented in Table 2. Note that the data applied to the roundabouts located on motorways and A-roads,
General Accident Trends
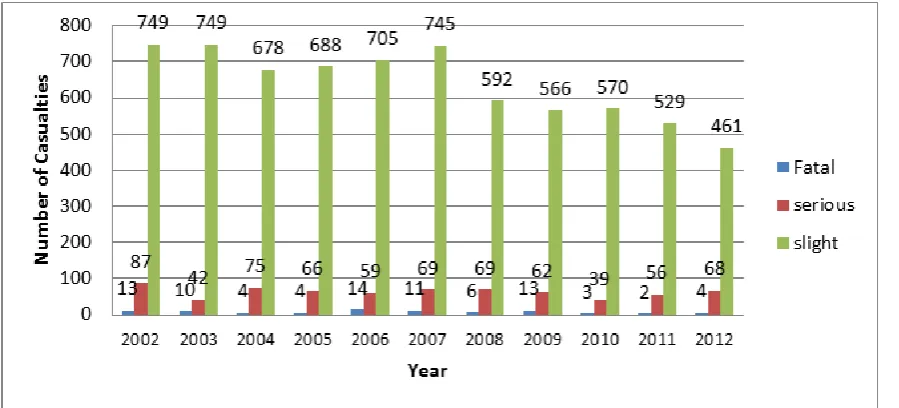
According to the STATS19 data, 5520 collisions were recorded at the roundabouts between 2002 and 2012 (11 years). The total number of vehicles in those accidents was11510 and in those accidents, there were 7808 casualties.
Fatal, serious, and slight accidents throughout the eleven year period decreased. Figure 2 shows that there is a fluctuation in the number of casualties from 2002 till 2007 which shows the highest number of slight casualties, after which the number decreased.
Driver/ Rider Error or Reaction was found as the highest contributory factor recorded (including Following too close, Failed to judge other persons path or speed, Poor turn or manoeuvre, Sudden braking, and Junction overshoot). Most of the approach accidents occurred within 100m distance (2318 accidents), while 284 accidents occurred at a distance more than 100m away from the entry line and 1234 accidents were recorded within the circulatory lanes.
RESULTS
Model Development
The objective of the analysis was to relate the total number of accidents to a range of explanatory variables, and hence to determine a relationship which could be used to predict site-specific accident risks. The method used is the random-parameters NB distribution and is compared with the fixed-parameters NB distribution.
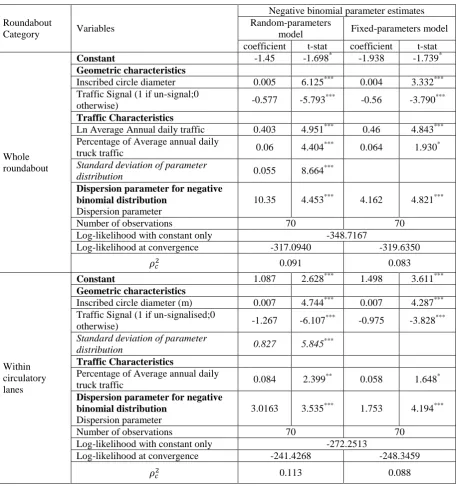
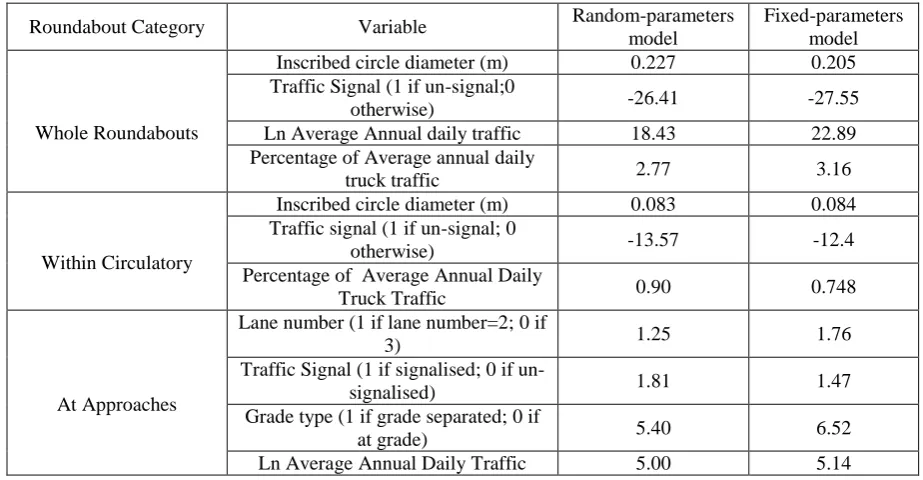
Table 3 presents the model estimation results for random- and fixed-parameters NB models, for the whole roundabouts, within the circulatory lanes and at approaches. Table 4 illustrates that the average marginal effects estimated by the models can be quite different.
For the whole roundabout Table 3 shows that the random-parameters NB model results in an improvement in the log-likelihood at convergence from -319.6350 in the fixed-parameters model to -317.0940 in the random-fixed-parameters case. With respect to overall fit, 𝜌𝑐2 improves from 0.083 in the fixed-parameters case to 0.091 in the random-parameters case. For the whole roundabout the resulting 𝜒2 (Eq.8) was 5.082 with one degree of freedom. This indicates that there is a 98% confidence that the random-parameters model is
statistically better than the fixed-parameters model. The change resulting from the switch from fixed- to random parameters justifies the added complexity of the model. The likelihood ratio test suggests that the model improvement is significant at a p-value of 0.05.
For the data within the circulatory lanes, Table 3 illustrates that the
random-parameters NB model results in a significantly better log-likelihood at convergence and better overall fit with 𝜌𝑐2 improving from 0.088 in fixed-parameters model to 0.113 in
random-parameters model. The resulting 𝜒2 was 13.8382 with one degree of freedom giving a 99.99% confidence that the random-parameters model is statistically better, and the
likelihood ratio test suggests that the model improvement is significant at a p-value of 0.0001. The impact of variables on accident number is higher in the random-parameters model
relative to the fixed-parameters according to the t-statistics.
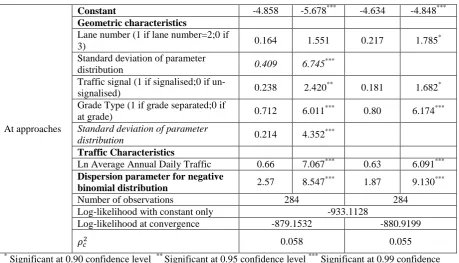
At approaches the random-parameters NB model results in a small improvement in log-likelihood at convergence. The 𝜌𝑐2 improved from 0.055 for the fixed-parameters model to 0.058 in the random-parameters model. The likelihood ratio test using 𝜒2 of 3.5334 with two degrees of freedom gives an 83% confidence that the random-parameters model provides a better fit; but this percentage alone, is not enough to justify adoption of the
random-parameters model. However, because the random-random-parameters model has lower log likelihood (-879.1532 compared to -880.9199) it can be used as a better model, and from the
For each roundabout category all the variables presented in Table 2 were tested in order to find their significance. Percentage of truck traffic at whole roundabout, traffic signal indicator (1 if un-signal; 0 otherwise) at circulatory lanes, lane number indicator (1 if lane number is 2; 0 otherwise) and grade type indicator (1 if grade separated; 0 otherwise) at approaches to roundabouts, were found to produce statistically significant random
parameters. A parameter is considered random when the standard deviation of the parameter distribution is statistically greater than zero (if the estimated standard deviation of the variable is not significantly greater than zero the variable is fixed across the observations). Un-signalised whole roundabouts, the inscribed circle diameter of the roundabout, and signalised approaches were found to have significant effects on the number of accidents as indicated by the t-statistic in Table 3 but their effect was fixed across the observations.
For the whole roundabout, the percentage of average annual daily truck traffic results in a random parameter that is normally distributed, with a mean 0.06 and standard deviation 0.055. Given these parameters 13.8% of the distribution is less than 0 (which means only 13.8 % of the roundabouts had a lower number of accidents), and 86.2 % is greater than 0 (which means that majority of the roundabouts with higher truck percentages had a higher number of accidents). This result indicates that the majority of the roundabouts experience accident increase as the percentage of truck traffic increases. The significance of the percentage of truck traffic in the fixed-parameters model is lower as indicated by t-statistic and this provides support for using the random-parameters negative binomial model. According to Table 4 the random-parameters marginal effects indicate that 1% increase in truck traffic will increase the number of accidents by 2.77% (for the fixed-parameters model there is a 3.16% average increase in the number of accidents). Inscribed circle diameter, and AADT were found to have “statistically” highly significant effects on the number of
accidents. As these variables increase, the number of accidents increases. While un-signalised roundabouts were found to have significant effect on decreasing number of accidents.
Regarding the average marginal effect in Table 4, a one meter increase in inscribed circle diameter associated with an increased number of accidents by an average of 0.22 over the 11 year period (which is close to the fixed-parameters models average of 0.21). Arndt (32) stated that safety of roundabouts increased with smaller roundabout diameter which will help to maintain lower speeds and hence provide safety for roundabouts, so our results support these findings and those of Retting (33) who stated that roundabouts are less safe with a larger inscribed circle diameter. However, it was found that roundabouts that are un-signalised were associated with accidents that reduced by 26.41 over eleven year’s period (in the fixed-parameters models average of 27.55). As AADT is entered in logarithm form, it means that a 1% increase leads to a 0.40% increase in the expected number of accidents, which is in line with previous works (14) (34) (11) (35) (36) (37) (15) (32) (16) (17) (19) (20) (18).
Within the circulatory lanes, un-signalized traffic results in a random-parameter that is normally distributed, with a mean of -1.267 and standard deviation of 0.827, resulting in 93.7% of the distribution being less than 0 and 6.3% greater than 0. This indicates that most of the un-signalized circulatory have a decrease in the number of accidents. The average marginal effect for the traffic signal indicator in the random-parameters model shows that accidents decrease by 13.57, while in the fixed-parameters model the accident number decreases by 12.4. The probable reason for un-signalized circulatory being safer is because they are not located on motorways. Mostly they are fully at-grade junctions and they have lower traffic volumes.
leads vehicles to increase their circulating speed and hence decreases the safety of the roundabout.
AADT was found to be insignificant within the circulatory, while percentage of truck traffic was found to have a highly significant effect on the number of accidents; a 1%
increase in truck traffic increases the expected number of accidents by an average of 0.90% in the random-parameters model and in the fixed-parameters model by an average of 0.748%.
At approaches, it was found that entry width has an insignificant effect on the number of accidents. Maycock and Hall (14) found that entry width had a significant effect on
reducing the frequency of accidents but Retting (33) found that the roundabouts were less safe with higher entry width.
The approach two lane indicator was found to produce random-parameters with standard deviations significantly different from zero. The lane number indicator is normally distributed with a mean 0.164 and a standard deviation 0.409. This distribution indicates that 34% is less and 66% is greater than zero. This means that on more than half of the
approaches with two lanes there is an increased number of accidents, by an average of 1.25 over the 11 year period (see Table 4) (the average marginal effect was 1.76 in the fixed-parameters model). However, there are some two lane approaches where the number of accidents is lower, according to the distribution of the indicator (34%). In the before-after studies by Daniels et al. (34) and Persaud et al. (11), roundabout approaches with two lanes tended to perform worse, and Brüde & Larsson (18) stated that the number of lanes is a significant variable.
All signalised approaches were found to have significant effect on increasing the number of accidents. Table 4 shows that accidents increase by 1.81 (in the fixed parameters model 1.47) with signalised approaches. However this result is in contrast with Martin (38) who states that at-grade roundabouts and grade separated roundabouts show reduced
collisions by 28% and 6% respectively, after they were signalized. And the UK Department of Transport (39) states that accidents decreased when roundabouts are signalized, as signals regulate the speed of traffic. Presumably this apparent contrast is because those junctions that have been modified exhibited accident rates at the higher end of the range before being signalised and, while the act of signalisation reduced the accident rates at those roundabouts, the act wasn’t sufficient to bring the rate dawn to a value exhibited by those roundabouts less in need of signalisation.
Permitting higher traffic speeds 99.99% of the locations have higher number of accidents located at grade separated roundabouts; accidents increased by 5.40 (in the fixed parameters model by 6.52); the probable reason is that those roundabouts that are grade separated are at motorway junctions that handle high traffic volumes as well as having large inscribed circle diameters.
AADT has a fixed effect on occurrences of accidents at the 99% confidence level, which means that the large majority of the roundabout approaches experience accident increase as AADT increases. A 1% increase in AADT leads to a 0.66% increase in the expected number of accidents.
Figures 3 through 5 present predicted compared with actual values, for random- and fixed-parameters models for the different roundabout categories (whole, circulatory lanes, and approaches). It is apparent that the random-parameters models provide better overall fits.
SUMMARY AND CONCLUSIONS
models than the fixed-parameters models. The prediction ability of the random-parameters model is an improvement at greater than the 95% and 99% confidence limit over the fixed-parameters for whole and circulatory lanes, respectively. Moreover, the relationship between actual and predicted values implies that the random-parameters model fits the data better than fixed-parameters models for whole, within circulatory and at approaches to the roundabouts.
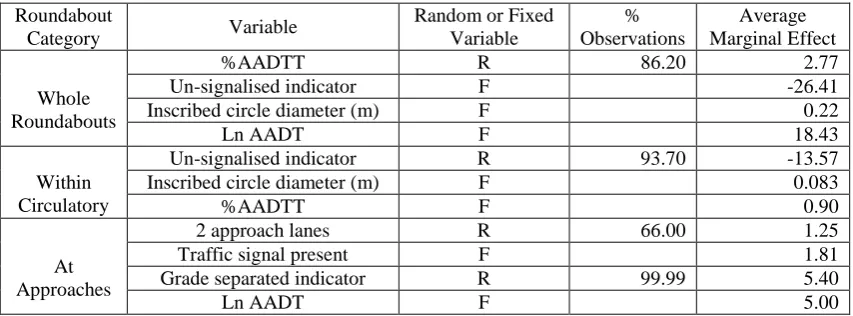
The effect of some parameters on accidents varies significantly across observations and result in random parameters in the random-parameters models; these are percentage of truck traffic for whole roundabout, traffic signals in the circulatory lanes, and grade separated indicator and number of lanes at approaches. Table 5 summarises the significant variables found in the three random-parameters models, identifies the random and fixed variables within those models, and gives the average marginal effect for each of those variables. For the random parameters, the percentage of observations where the actual marginal effect is greater than zero (or less than zero in the case of signalised circulatory) is also given.
The inscribed circle diameter is associated with an increased risk of circulating accidents however, while statistically very significant, the marginal effect was low in increasing number of accidents over the 11 year period (just 0.22 and 0.083 in the whole roundabout and circulatory lane models, respectively). All un-signalised roundabouts as a whole have lower number of accidents. All signalized approaches have higher numbers of accidents, and the majority of the un-signalized circulatory lanes have lower number of accidents. Approaches that are located at grade-separated roundabouts were found to have a higher number of accidents. The majority of the approaches (66%) with two lanes have a higher number of accidents.
The primary aim of this study was not to seek to determine accident cause and effect, but rather, to provide better tools to understand the likelihood of accidents on roundabouts. The random-parameter models achieve this because they provide better models than the fixed-parameters models, identifying more significant variables, better fitting the data as indicated by relationship between actual value and predicted value and because, for the random parameters identified, they provide information about the number of observations that have a marginal effect greater than zero. Many of the observations, at first sight, can appear counter intuitive. For example, the fact that un-signalized roundabouts or circulatory lanes experience fewer accidents may not be because signals cause accidents, but because roundabouts and circulatory lanes without signals are generally those carrying less traffic which, thus, has less opportunity for traffic conflicts. However, the relationship between roundabout geometric parameters and the possibility of accidents also suggests that certain characteristics are influential in the occurrence or prediction of accidents. Therefore, further investigation of the interaction between traffic flow, signalization, and element widths and diameter deserves consideration. Further work is needed about sight lines, pavement
REFERENCES
1. Highways Agency. Geometric Design of Roundabouts, Design Manual of Roads and
Bridges, TD 16/07, London, UK, 2007.
2. Highways Agency.Design of mini-roundabouts. Design Manual for Roads and Bridges, TD 54/07, London, UK, 2007.
3. Rodegerdts,L., Bansen,J., Tiesler,C., Knudsen,J., Myers, E., Johnson,J., Moule, M., Persaud,B., Lyon,C., Hallmark,S., Isebrands,H., Crown,R., Guichet, B., and O’Brien, A., 2010. NCHRP Report 672: Roundabouts: An informational guide, Transportation
Research Board, Washington, DC.
4. Setra – Service d’Etudes Techniques des Routes et Autoroutes. The Design of Interurban
Intersections on Major Roads: At-grade Intersections, Bagneux Cedex, 1998.
5. Jacquemart, G. Synthesis of Highway Practice 264: Modern Roundabout Practice in the United States, National Cooperative Highway Research Program. National Academy
Press, Washington, DC, 1998.
6. Gårder, P. Little Falls, Gorham—A Modern Roundabout. Maine Department of Transportation, Bureau of Planning, Research & Community Services, Transportation
Research Division, Final Report, Technical Report, 1998.
7. Guichet, B. Evolution of roundabouts in France and new uses. Transportation Research Circular, 2005, 7p-7p.
8. Retting, R. A., Persaud, B. N., Garder, P. E. & Lord, D.. Crash and injury reduction following installation of roundabouts in the United States. American Journal of Public Health, 2001, 91, 628.
9. Elvik, R. Assessing the validity of road safety evaluation studies by analysing causal chains. Accident Analysis & Prevention, 35, 2003, 741-748.
10.Rodegerdts, L., Blogg, M.,Wemple, E., Myers, E., Kyte, M., Dixon, M., List, G., Flannery, A., Troutbeck, R., Brilon, W., Wu, N., Persaud, B., Lyon, C., Harkey, D., Carter, D. NCHRP Report 572: Roundabouts in the United States. Transportation
Research Board, Washington, DC, 2007.
11.PERSAUD, B. N., RETTING, R. A., GARDER, P. E. & LORD, D. Observational Before-After Study of the Safety Effect of US Roundabout Conversions Using the Empirical Bayes Method. TRB ID: 01-0562, 2001.
12.Isebrands, H. Crash Analysis of Roundabouts at High-Speed Rural Intersections.
Transportation Research Record: Journal of the Transportation Research Board, 2009,
pp.1-7.
13.American Association of State Highway and Transportation Officials. Highway Safety
Manual. AASHTO, Washington, D.C, 2010.
14.Maycock, G. and Hall, R.D. Accidents at four-arm roundabouts. In, PTRC Summer Annual Conference, Brighton, GB, 1984.
15.Guichet, B. Roundabouts in France: Development, safety, design, and capacity. In: Third
International Symposium on Intersections Without Traffic Signals, 1997.
16.Montella, A. Roundabout in-service safety reviews: safety assessment procedure.
Transportation Research Record: Journal of the Transportation Research Board, 2019,
40-50, 2007.
17.Kim, S. & Choi, J. Safety analysis of roundabout designs based on geometric and speed characteristics. KSCE Journal of Civil Engineering, 2013,17, 1446-1454.
18.Brüde, U. & Larsson, J. What roundabout design provides the highest possible safety?
Nordic Road and Transport Research, 17-21, 2000.
Zealand-some initial results. In: Proceedings 26th Australasian Transport Research Forum
October, Wellington, 2003.
20.Turner, S., Wood, G. & Roozenburg, A. Accident prediction models for roundabouts. In:
Research into Practice: 22nd ARRB Conference, 2006.
21.Washington, S., Karlaftis, M. & Mannering, F. Statistical and Econometric Methods for Transportation Data Analysis, 2003.
22.Anastasopoulos, P. C. & Mannering, F. L. A note on modeling vehicle accident frequencies with random-parameters count models. Accident Analysis & Prevention, 2009, 41, 153-159.
23.El-Basyouny, K. & Sayed, T. Accident prediction models with random corridor parameters. Accident Analysis & Prevention, 2009, 41, 1118-1123.
24.Garnowski, M. & Manner, H. On factors related to car accidents on German Autobahn connectors. Accident Analysis & Prevention, 2011, 43, 1864-1871.
25.Venkataraman, N. S. Random parameter analysis of geometric effects on freeway crash
occurrence, Faculty of Civil and Environmental Engineering University of Iceland, 2014.
26.Ukkusuri, S., Hasan, S. & Aziz, H. Random parameter model used to explain effects of built-environment characteristics on pedestrian crash frequency. Transportation Research
Record: Journal of the Transportation Research Board, 2011,98-106.
27.Milton, J. & Mannering, F. The relationship among highway geometrics, traffic-related elements and motor-vehicle accident frequencies. Transportation, 1998, 25, 395-413. 28.Lord, D., Washington, S. P. & Ivan, J. N. Poisson, Poisson-gamma and zero-inflated
regression models of motor vehicle crashes: balancing statistical fit and theory. Accident Analysis & Prevention, 2005, 37, 35-46.
29.Lord, D. & Mannering, F. The statistical analysis of crash-frequency data: a review and assessment of methodological alternatives. Transportation Research Part A: Policy and Practice, 2010, 44, 291-305.
30.Greene, W. H. LIMDEP, Version 9.0: User's Manual, Econometric Software, New York, 2007.
31.Halton, J. H. On the efficiency of certain quasi-random sequences of points in evaluating multi-dimensional integrals. Numerische Mathematik, 1960, 2, 84-90.
32.Arndt, O. & Troutbeck, R. Relationship between roundabout geometry and accident rates.
Transportation research circular, 1998, 28: 1-16.
33.Retting, R. Enhancing Intersection Safety through Roundabouts: A Proposed ITE Informational Report. In: ITE 2006 Technical Conference and Exhibit Compendium of Technical Papers, 2006.
34.Daniels, S., Brijs, T., Nuyts, E. & Wets, G. Explaining variation in safety performance of roundabouts. Accident Analysis & Prevention, 42, 2010, 393-402.
35.Šenk, P. & Ambros, J. Estimation of Accident Frequency at Newly-built Roundabouts in the Czech Republic. Transactions on Transport Sciences, 2011, 4, 199-206.
36.Lord, D. The prediction of accidents on digital networks, characteristics and issues
related to the application of accident prediction models, Department of Civil Engineering
University of Toronto, 2000.
37.Ela Shadpour. Safety Effects of Roundabouts, MA Wilfrid Laurier University, LCERPA Commentary No. 2014-‐2, 2012.
38.Martin F. An Analysis of Accidents at Roundabouts “Before” and “after” Signal Implementation. London Accident Analysis Unit, 2003.
List of Tables and Figures
TABLE (1a) Whole Roundabout Characteristics, (1b) Roundabout Approach Characteristics
TABLE 2 Summary Statistics of the Accident, Geometric and Traffic Variables (a) for Whole Roundabouts, (b) for Circulatory Lanes, (c) for Approaches
TABLE 3 Accident Model Estimation Results for Random- and Fixed-Parameters NB Models
TABLE 4 Average Marginal Effects for Random- and Fixed-Parameters NB Models TABLE 5 Significant Variables in the Random-Parameters Models
FIGURE 1 Geometric element of roundabouts studied FIGURE 2 Fatal, serious, and slight casualties 2002–12
TABLE 1 Roundabout Characteristic (a) for Whole Roundabout (b) for Approaches
(a)
No. 3 Leg
4 Leg
5 Leg
6 Leg
Traffic Signals
No Traffic Signals
Partially Signalised
2 Lane
3 Lane
At Grade
Grade Separated
70 12 39 12 7 20 28 22 39 31 19 51
(b)
No. Traffic Signals
No Traffic Signals
2 Lane
3 Lane
At Grade
Grade Separated
A Road
M Road
B Road
TABLE 2 Summary Statistics of the Accident, Geometric and Traffic Variables (a) For Whole Roundabouts (b) For Circulatory Lanes (c) For Approaches
(a)
Roundabout Category
Variable Min Max Mean Standard
Deviation
Whole Roundabouts
Accident Characteristics Dependant Variable: 11 -year
number of motor vehicle accidents 5.00 170 60.49 45.35 Geometric Characteristics
Lane Number (1 if lane number is
2; 0 otherwise) 0.00 1.00 0.55 0.50
Number of Legs(1 if arm number is
3; 0 otherwise; 0.00 1.00 0.17 0.38
Number of legs (1 if arm number is
4; 0 otherwise) 0.00 1.00 0.55 0.50
Number of legs (1 if arm number is
5; 0 otherwise) 0.00 1.00 0.13 0.34
Inscribed Circle Diameter (m) 38.00 280.00 158.29 65.95 Circulatory Lane Width (m) 6.00 15.00 10.65 1.83
Entry Width (m) 7.00 14.00 9.99 1.89
Traffic Signal (1 if signal; 0
otherwise) 0.00 1.00 0.29 0.46
Traffic Signal (1 if un-signal; 0
otherwise) 0.00 1.00 0.40 0.49
Type of Grade (1 if roundabout is
grade separated; 0 otherwise) 0.00 1.00 0.73 0.45 Traffic Characteristics
Average Annual Daily Traffic
(AADT) of All Type Vehicles 11170 137773 50840.86 27691.78 Percentage Average Annual Daily
Traffic (AADT) of Trucks 2.18 22.53 6.97 3.26
(b)
Within Circulatory
Accident Characteristics Dependant Variable: 11 -year
number of motor vehicle accidents 0.00 108 18.42 19.81 Geometric Characteristics
Lane Number (1 if lane number is
2; 0 otherwise) 0.00 1.00 0.57 0.50
Inscribed Circle Diameter (m) 38 280 162.40 64.37
Circulatory Lane Width (m) 6 15 10.67 1.86
Traffic Signal (1 if is signal; 0
otherwise) 0.00 1.00 0.30 0.46
Traffic Signal (1 if un-signal; 0
otherwise) 0.00 1.00 0.43 0.50
Type of Grade (1 if roundabout is
grade separated; 0 otherwise) 0.00 1.00 0.73 0.45 Traffic Characteristics
Average Annual Daily Traffic
(AADT) of All Type Vehicles 11170 137773 50840.86 27691.78 Percentage Average Annual Daily
(c)
At Approaches
Accident Characteristics Dependant Variable: 11 -year
number of motor vehicle accidents 0.00 54.00 9.41 9.06 Geometric Characteristics
Lane Number (1 if lane number is
2; 0 otherwise) 0.00 1.00 0.61 0.49
Approach Entry Width (m) 5.26 20.00 9.99 2.40
Traffic Signal (1 if is signal; 0
otherwise), 0.00 1.00 0.50 0.50
Type of Grade (1 if roundabout is
grade separated; 0 otherwise) 0.00 1.00 0.74 0.44 Traffic Characteristics
Average Annual Daily Traffic
(AADT) of All Type Vehicles 1903 51201 12724.04 7382.41 Percentage Average Annual Daily
TABLE 3 Accident Model Estimation Results for Random- and Fixed-Parameters NB Models
Roundabout
Category Variables
Negative binomial parameter estimates Random-parameters
model Fixed-parameters model coefficient t-stat coefficient t-stat
Whole roundabout
Constant -1.45 -1.698* -1.938 -1.739*
Geometric characteristics
Inscribed circle diameter 0.005 6.125*** 0.004 3.332*** Traffic Signal (1 if un-signal;0
otherwise) -0.577 -5.793
*** -0.56 -3.790***
Traffic Characteristics
Ln Average Annual daily traffic 0.403 4.951*** 0.46 4.843*** Percentage of Average annual daily
truck traffic 0.06 4.404
*** 0.064 1.930*
Standard deviation of parameter
distribution 0.055 8.664
***
Dispersion parameter for negative binomial distribution
Dispersion parameter
10.35 4.453*** 4.162 4.821***
Number of observations 70 70
Log-likelihood with constant only -348.7167
Log-likelihood at convergence -317.0940 -319.6350
𝜌𝑐2 0.091 0.083
Within circulatory lanes
Constant 1.087 2.628*** 1.498 3.611***
Geometric characteristics
Inscribed circle diameter (m) 0.007 4.744*** 0.007 4.287*** Traffic Signal (1 if un-signalised;0
otherwise) -1.267 -6.107
***
-0.975 -3.828*** Standard deviation of parameter
distribution 0.827 5.845
***
Traffic Characteristics
Percentage of Average annual daily
truck traffic 0.084 2.399
** 0.058 1.648*
Dispersion parameter for negative binomial distribution
Dispersion parameter
3.0163 3.535*** 1.753 4.194***
Number of observations 70 70
Log-likelihood with constant only -272.2513
Log-likelihood at convergence -241.4268 -248.3459
TABLE 3 Continued
At approaches
Constant -4.858 -5.678*** -4.634 -4.848***
Geometric characteristics
Lane number (1 if lane number=2;0 if
3) 0.164 1.551 0.217 1.785
*
Standard deviation of parameter
distribution 0.409 6.745
***
Traffic signal (1 if signalised;0 if
un-signalised) 0.238 2.420
** 0.181 1.682*
Grade Type (1 if grade separated;0 if
at grade) 0.712 6.011
*** 0.80 6.174***
Standard deviation of parameter
distribution 0.214 4.352
***
Traffic Characteristics
Ln Average Annual Daily Traffic 0.66 7.067*** 0.63 6.091*** Dispersion parameter for negative
binomial distribution 2.57 8.547
*** 1.87 9.130***
Number of observations 284 284
Log-likelihood with constant only -933.1128
Log-likelihood at convergence -879.1532 -880.9199
𝜌𝑐2 0.058 0.055
*
TABLE 4 Average Marginal Effects for Random- and Fixed-Parameters NB Models
Roundabout Category Variable Random-parameters
model
Fixed-parameters model
Whole Roundabouts
Inscribed circle diameter (m) 0.227 0.205
Traffic Signal (1 if un-signal;0
otherwise) -26.41 -27.55
Ln Average Annual daily traffic 18.43 22.89
Percentage of Average annual daily
truck traffic 2.77 3.16
Within Circulatory
Inscribed circle diameter (m) 0.083 0.084
Traffic signal (1 if un-signal; 0
otherwise) -13.57 -12.4
Percentage of Average Annual Daily
Truck Traffic 0.90 0.748
At Approaches
Lane number (1 if lane number=2; 0 if
3) 1.25 1.76
Traffic Signal (1 if signalised; 0 if
un-signalised) 1.81 1.47
Grade type (1 if grade separated; 0 if
at grade) 5.40 6.52
TABLE 5 Significant Variables in the Random-Parameters Models
Roundabout
Category Variable
Random or Fixed Variable
% Observations
Average Marginal Effect
Whole Roundabouts
%AADTT R 86.20 2.77
Un-signalised indicator F -26.41
Inscribed circle diameter (m) F 0.22
Ln AADT F 18.43
Within Circulatory
Un-signalised indicator R 93.70 -13.57
Inscribed circle diameter (m) F 0.083
%AADTT F 0.90
At Approaches
2 approach lanes R 66.00 1.25
Traffic signal present F 1.81
Grade separated indicator R 99.99 5.40