Exploring dialect phonetic variation using PARAFAC
Jelena Proki´c
University of Groningen The Netherlands [email protected]
Tim Van de Cruys
University of Groningen The Netherlands [email protected]
Abstract
In this paper we apply the multi-way de-composition methodPARAFACin order to detect the most prominent sound changes in dialect variation. We investigate various phonetic patterns, both in stressed and un-stressed syllables. We proceed from regu-lar sound correspondences which are auto-matically extracted from the aligned tran-scriptions and analyzed using PARAFAC. This enables us to analyze simultaneously the co-occurrence patterns of all sound correspondences found in the data set and determine the most important factors of the variation. The first ten dimensions are examined in more detail by recovering the geographical distribution of the extracted correspondences. We also compare dia-lect divisions based on the extracted cor-respondences to the divisions based on the whole data set and to the traditional schol-arship as well. The results show thatPAR -AFAC can be successfully used to detect the linguistic basis of the automatically obtained dialect divisions.
1 Introduction
Dialectometry is a multidisciplinary field that uses quantitative methods in the analysis of dialect data. From the very beginning, most of the re-search in dialectometry has been focused on the identification of dialect groups and development of methods that would tell us how similar (or dif-ferent) one variety is when compared to the neigh-boring varieties. Dialect data is usually analyzed on the aggregate level by summing up the differ-ences between various language varieties into a single number. The main drawback of aggregate analyses is that it does not expose the underlying linguistic structure, i.e. the specific linguistic ele-ments that contributed to the differences between
the dialects. In recent years there have been sev-eral attempts to automatically extract linguistic basis from the aggregate analysis, i.e. to determine which linguistic features are responsible for which dialect divisions. Although interesting for dialect-ology itself, this kind of research is very important in the investigation of sound variation and change, both on the synchronic and diachronic level.
The paper is structured as follows. In the next section, we discuss a number of earlier approaches to the problem of identifying underlying linguistic structure in dialect divisions. In section 3, we give a description of the dialect data used in this re-search. Section 4 then describes the methodology of our method, explaining our data representation using tensors, our three-way factorization method, and the design of our data set. In section 5, the res-ults of our method are discussed, examining the values that come out of our factorization method in a number of ways. Section 6, then, draws con-clusions and gives some pointers for future work. 2 Previous work
In order to detect the linguistic basis of dialect variation Nerbonne (2006) applied factor analysis to the results of the dialectometric analysis of southern American dialects. The analysis is based on 1132 different vowels found in the data. 204 vowel positions are investigated, where a vowel position is, e.g., the first vowel in the word ’Wash-ington’ or the second vowel in the word ’thirty’. Factor analysis has shown that 3 factors are most important, explaining 35% of the total amount of variation. However, this approach is based only on vowel positions in specific words.
where the presence of a certain sound is domin-ant with respect to some sound alternation. Al-though successful in describing some important sound alternations in the dialect variation, it ex-amines only the 10 most frequent sound alterna-tions without testing patterns of variation between different sound correspondences.
Shackleton (2007) applies principal compon-ent analysis (PCA) to a group of self constructed articulation-based features. All segments found in the data are translated into vectors of numerical features and analyzed using PCA. Based on the component scores for features, different groups of varieties (in which a certain group of features is present) are identified. We note that the main drawback of this approach is the subjectivity of the feature selection and segment quantification.
Wieling and Nerbonne (2009) used a bipart-ite spectral graph partitioning method to simul-taneously cluster dialect varieties and sound cor-respondences. Although promising, this method compares the pronunciation of every site only to the reference site, rather than comparing it to all other sites. Another drawback of this method is that it does not use any information on the frequen-cies of sound correspondences, but instead em-ploys binary features to represent whether a cer-tain correspondence is present at a cercer-tain site or not.
In this paper we present an approach that tries to overcome some of the problems described in the previous approaches. It proceeds from auto-matically aligned phonetic transcriptions, where pronunciations of every site are compared to the corresponding pronunciations for all other sites. Extracted sound correspondences are analyzed us-ing the multi-way decomposition method PARA -FAC. The method allows us to make generaliza-tions over multi-way co-occurrence data, and to look simultaneously at the co-occurrence patterns of all sound correspondences found in the data set.
3 Data description
The data set used in this paper consists of phon-etic transcriptions of 152 words collected at 197 sites evenly distributed all over Bulgaria. It is part of the project Buldialect – Measuring Linguistic unity and diversity in Europe. Phonetic transcrip-tions include various diacritics and suprasegment-als, making the total number of unique phones in
the data set 95: 43 vowels and 52 consonants.1
The sign for primary stress is moved to a cor-responding vowel, so that there is a distinction between stressed and unstressed vowels. Vowels are also marked for their length. Sonorants /r/ and /l/ have a mark for syllabicity and for stress in case they are syllabic. Here we list all phones present in the data set:
"A,e,i,"e,@,"E,7,"6,A,I,o,"o,u,"A:,U,"u:,"7,"@, "a,"i,"I,"e:,E,"O,"2,"i:,"u,e:,1,"1,"o:,"E:,"7:,u:,A:, y,"a:,a,o:,7:,"U,"y,"I:,j,g,n, nj,é, r, w,x, rj, h,
C, f, s, v, c¸,F, p,>Ù, m, k,>ťC, pj, c, l, lj, t, tj,S, d, dj,
"r ", vj,
>
dz,Z,ý,>ţ, r
", cj, z, sj, b, gj, mj, l", zj,"l", kj, bj, >
ćý,>dz, fj,î
Each of the 152 words in the data set shows phonetic variation, with some words displaying more than one change. There are in total 39 dif-ferent dialectal features that are represented in the data set, with each of the features being present in a similar number of words. For example, the re-flexes of Old Bulgarian vowels that show dialect variation are represented with the same or nearly the same number of words. A more detailed de-scription of all features can be found in Proki´c et al. (2009). For all villages only one speaker was recorded. In the data set, for some villages there were multiple pronunciations of the same word. In this reasearch we have randomly picked only one per every village.
4 Methodology 4.1 Tensors
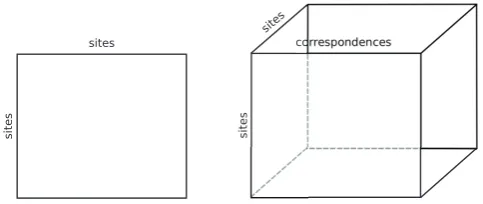
Co-occurrence data (such as the sound corres-pondences used in this research) are usually rep-resented in the form of amatrix. This form is per-fectly suited to represent two-way co-occurrence data, but for co-occurrence data beyond two modes, we need a more general representation. The generalization of a matrix is called atensor. A tensor is able to encode co-occurrence data of any n modes. Figure 1 shows a graphical com-parison of a matrix and a tensor with three modes – although a tensor can easily be generalized to more than three modes.
Tensor operations come with their own algeb-raic machinery. We refer the interested reader to Kolda and Bader (2009) for a thorough and in-sightful introduction to the subject.
1The data is publicly available and can be
[image:3.595.177.419.90.192.2]
Figure 1: Matrix representation vs. tensor representation.
4.2 PARAFAC
In order to create a succinct and generalized model, the co-occurrence data are often ana-lyzed with dimensionality reduction techniques. One of the best known dimensionality reduction techniques is principal component analysis (PCA, Pearson (1901)). PCA transforms the data into a new coordinate system, yielding the best possible fit in a least squares sense given a limited num-ber of dimensions. Singular value decomposition (SVD) is the generalization of the eigenvalue de-composition used inPCA(Wall et al., 2003).
To be able to make generalizations among the three-way co-occurrence data, we apply a statist-ical dimensionality reduction technique called par-allel factor analysis (PARAFAC, Harshman (1970); Carroll and Chang (1970)), a technique that has been sucessfully applied in areas such as psycho-logy and bio-chemistry. PARAFACis a multilinear analogue ofSVD. The key idea is to minimize the sum of squares between the original tensor and the factorized model of the tensor. For the three mode case of a tensor T ∈ RD1×D2×D3 this gives the
objective function in 1, wherekis the number of dimensions in the factorized model and◦denotes the outer product.
min
xi∈RD1,yi∈RD2,zi∈RD3kT− k
X
i=1
xi◦yi◦zi k2F
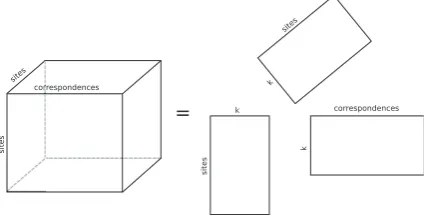
(1) The algorithm results in three matrices, indic-ating the loadings of each mode on the factorized dimensions. The model is represented graphically in Figures 2 and 3. Figure 2 visualizes the fact that the PARAFAC decomposition consists of the summation over the outer products of n (in this case three) vectors. Figure 3 represents the three resulting matrices that come out of the factoriza-tion, indicating the loadings of each mode on the
factorized dimensions. We will be using the latter representation in our research.
Computationally, the PARAFAC model is fitted by applying an alternating least-squares algorithm. In each iteration, two of the modes are fixed and the third one is fitted in a least squares sense. This process is repeated until convergence.2
4.3 Sound correspondences
In order to detect the most important sound vari-ation within Bulgarian dialects, we proceed from extracting all sound correspondences from the automatically aligned word transcriptions. All transcriptions were pairwise aligned using the Levenshtein algorithm (Levenshtein, 1965) as im-plemented in the program L04.3 The
Leven-shtein algorithm is a dynamic programming al-gorithm used to measure the differences between two strings. The distance between two strings is the smallest number of insertions, deletions, and substitutions needed to transform one string to the other. In this work all three operations were as-signed the same value, namely 1. The algorithm is also directly used to align two sequences. An ex-ample showing two aligned pronunciations of the
wordvъlna/v7lna/ ‘wool’ is given in Figure 4.4
v "7 - n A
v "A l n @
Figure 4: Example of two pairwise aligned word transcriptions.
From the aligned transcriptions for all words and all villages in the data set we first extracted
2The algorithm has been implemented inMATLAB, using
the Tensor Toolbox for sparse tensor calculations (Bader and Kolda, 2009).
3http://www.let.rug.nl/kleiweg/L04 4For some pairs of transcriptions there are two or more
Figure 2: Graphical representation ofPARAFACas the sum of outer products.
Figure 3: Graphical representation of thePARAFACas three loadings matrices.
all corresponding non-identical sounds. For ex-ample, from the aligned transcriptions in Figure 4 we would extract the following sound pairs: ["7 ]-["A], [-]-[l], [A]-[@]. The hyphen (‘-’) stands for a missing (i.e. inserted or deleted) sound, and in fur-ther analyses it is treated the same as any sound in the data set. For each pair of corresponding sounds from the data set we counted how often it appeared in the aligned transcriptions for each pair of villages separately. In total we extracted 907 sound correspondences and stored the information on each of them in a separate matrix. Every matrix records the distances between each two villages in the data set, measured as the number of times a certain phonetic alternation is recorded while comparing pronunciations from these sites.
Since we are interested in analyzing all sound correspondences simultaneously, we merged the information from all 907 two-mode matrices into a three-mode tensorn×n×v, wherenrepresents the sites in the data set, andvrepresents the sound alternations. By arranging our data in a cube in-stead of a matrix, we are able to look into several sets of variables simultaneously. We are especially interested in the loadings for the third mode, that contains the values for the sound correspondences.
5 Results
In order to detect the most prominent sound cor-respondences we analyzed the three-mode tensor described in the previous section using aPARAFAC factorization withk = 10dimensions. In Table 5
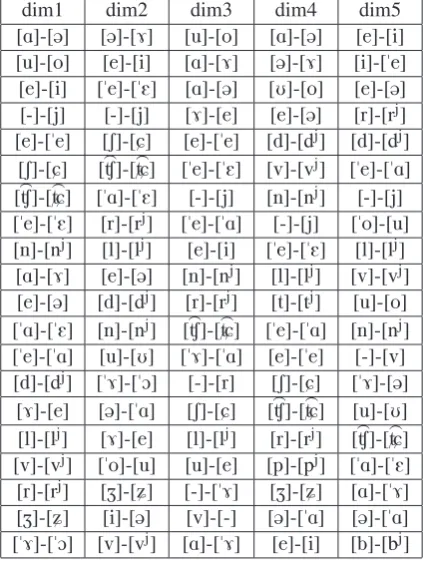
we present only the first five dimensions extracted by the algorithm. The final model fits 44% of the original data. The contribution of the first extrac-ted dimension (dim1) to the final fit of the model is the largest – 23.81 per cent – while the next four dimensions contribute to the final fit with similar percentages: dim2 with 10.63 per cent, dim3 with 9.50 per cent, dim4 with 9.26 per cent, and dim5 with 9.09 per cent. Dimensions six to ten contrib-ute in the range from 8.66 per cent to 6.98 per cent. For every dimension we extracted the twenty sound correspondences with the highest scores. In the first dimension we find 11 pairs involving vow-els and 9 involving consonant variation. The three sound correspondences with the highest scores are the [A]-[@], [o]-[u], and [e]-[i] alternations. This finding corresponds well with the traditional scholarly views on Bulgarian phonetics (Wood and Pettersson, 1988; Barnes, 2006) where we find that in unstressed syllables mid vowels [e] and [o] raise to neutralize with the high vowels [i] and [u]. The low vowel [a] raises to merge with [@].
[image:4.595.193.408.180.288.2]Table 1: First five dimensions for the sound cor-respondences.
dim1 dim2 dim3 dim4 dim5
[A]-[@] [@]-[7] [u]-[o] [A]-[@] [e]-[i] [u]-[o] [e]-[i] [A]-[7] [@]-[7] [i]-["e] [e]-[i] ["e]-["E] [A]-[@] [U]-[o] [e]-[@] [-]-[j] [-]-[j] [7]-[e] [e]-[@] [r]-[rj]
[e]-["e] [S]-[C] [e]-["e] [d]-[dj] [d]-[dj]
[S]-[C] [>Ù]-[>ťC] ["e]-["E] [v]-[vj] ["e]-["A]
[>Ù]-[>ťC] ["A]-["E] [-]-[j] [n]-[nj] [-]-[j]
["e]-["E] [r]-[rj] ["e]-["A] [-]-[j] ["o]-[u]
[n]-[nj] [l]-[lj] [e]-[i] ["e]-["E] [l]-[lj]
[A]-[7] [e]-[@] [n]-[nj] [l]-[lj] [v]-[vj]
[e]-[@] [d]-[dj] [r]-[rj] [t]-[tj] [u]-[o]
["A]-["E] [n]-[nj] [>Ù]-[>ťC] ["e]-["A] [n]-[nj]
["e]-["A] [u]-[U] ["7]-["A] [e]-["e] [-]-[v] [d]-[dj] ["7]-["O] [-]-[r] [S]-[C] ["7]-[@]
[7]-[e] [@]-["A] [S]-[C] [>Ù]-[>ťC] [u]-[U] [l]-[lj] [7]-[e] [l]-[lj] [r]-[rj] [>Ù]-[>ťC]
[v]-[vj] ["o]-[u] [u]-[e] [p]-[pj] ["A]-["E]
[r]-[rj] [Z]-[ý] [-]-["7] [Z]-[ý] [A]-["7]
[Z]-[ý] [i]-[@] [v]-[-] [@]-["A] [@]-["A] ["7]-["O] [v]-[vj] [A]-["7] [e]-[i] [b]-[bj]
are represented using a gradual color, which en-ables us to see not only the geographic distribution of a certain sound but also how regular it is in a given sound alternation. The highest scoring sites are coloured black and the lowest scoring sites are coloured white.
In Figure 5 we see the geographical distribu-tion of the first three extracted correspondences. The first two alternations [A]-[@] and [o]-[u] have almost the same geographical distribution and di-vide the country into west and east. While in the west there is a clear presence of vowels [A] and [o], in the east those vowels would be pronounced as [@] and [u]. The division into east and west corres-ponds well with the so-called jat line, which is, according to traditional dialectologists (Stojkov, 2002) the main dialect border in Bulgaria. On the maps in Figure 5 we represent it with the black line that roughly divides Bulgaria into east and west. The third correspondence follows a slightly dif-ferent pattern: mid vowel [e] is present not only west of the jatline, but also in the southern part of the country, in the region of Rodopi mountains. In the central and northeastern areas this sound is
pronounced as high vowel [i]. For all three sound correspondences we see a clear two-way division of the country, with almost all sites being charac-terized by one of the two pronunciations, which, as we shall see later, is not always the case due to multiple reflections of some sounds at certain positions.
We also note that the distribution of the sound correspondences that involve soft consonants and their counterparts have the same east-west dis-tribution (see Figure 6). In the first dimension we find the following consonants and their pal-atal counterparts [n], [d], [l], [v] and [r], but be-cause of space limitations we show maps only for three correspondences. The east-west division also emerges with respect to the distribution of the [A]-[7] and ["e]-["A] sounds.
Unlike the correspondences mentioned before, the [S]-[C], [>Ù]-[>ťC], and [Z]-[ý] pairs are defining the south part of the country as a separate zone. As shown on the maps in Figure 7, the southern part of the country (the region of Rodopi moun-tains) is characterized by a soft pronunciation of
[S], [>Ù] and [Z]. In traditonal literature on
Bul-garain dialectology (Stojkov, 2002), we also find that soft pronunciation of [S], [>Ù] and [Z] is one of the most important phonetic features of the variet-ies in the Rodopi zone. Based on the correspond-ences extracted in the first dimension, this area is also defined by the presence of the vowel ["E] in stressed syllables (["e]-["E] and ["A]-["E] corres-pondences).
In some extracted correspondences, only one of the sounds has a geographically coherent distri-bution, like in the case of the [7]-[e] pair where [e] is found in the west and south, while the [7] sound is only sporadically present in the central region. This kind of asymmetrical distribution is also found with respect to the pair [A]-[7].
Most of the sound correspondences in the first dimension either divide the country along thejat
line or separate the Rodopi area from the rest of the varieties. The only two exceptions are the [-]-[j] and ["7]-["O] pairs. They both define the southwest area as a separate zone, while the northwest shares its pronunciation of the sound in question with the eastern part of the country.
correspond-Figure 5: [A]-[@] (left), [o]-[u] (middle), [e]-[i] (right) sound correspondences.
Figure 6: [d]-[dj] (left), [v]-[vj] (middle), [r]-[rj] (right) sound correspondences.
ences. The results of the 2-way, 3-way and 4-way clustering are given in Figure 8.
In two-way clustering the algorithm detects an east-west split approximately along the jat line, slightly moved to the east. This fully corres-ponds to the traditional dialectology but also to the results obtained using Levenshtein algorithm on the whole data set where only east, west and south varieties could be asserted with great con-fidence (Proki´c and Nerbonne, 2008). In Figure 9 we present the dialect divisions that we get if the distances between the sites are calculated using whole word transcriptions instead of only the 20 most prominent sound correspondences. We no-tice a high correspondence between the two ana-lyses at the two- and three-level division. On the level of four and more groups, the two analyses start detecting different groups. In the analysis based on 20 sound correspondences, southern
dia-lects are divided into smaller and smaller groups, while in the analysis based on the whole data set, the area in the west – near the Serbian border – emerges as the fourth group. This is no surprise, as the first 20 extracted correspondences do not con-tain any sounds typical only for this western area.
[image:6.595.97.491.93.249.2] [image:6.595.101.490.295.455.2]Figure 7: [S]-[C] (left), [>Ù]-[>ťC] (middle), [Z]-[ý] (right) sound correspondences.
Figure 8: Dialect varieties detected by k-means clustering algorithm based on the first 20 sound corres-pondences in the first dimension.
Figure 9: Dialect varieties detected by k-means clustering algorithm based on all word transcriptions.
both of the classifications to the classification of the sites done by Stojkov (2002). For the classi-fication based on the first dimension extracted by PARAFAC, ARI is 0.73 for two-way and 0.64 for the three-way division. ARI score for the clas-sification based on whole word transcriptions is 0.69 for two-way and 0.62 for three-way. As in-dicated by ARI the two classifications correspond with a high degree to each other, but to the tra-ditional classification as well. We note that two-way classification based on the extracted sound correspondences corresponds higher to the tradi-tional classification than classification that takes all sounds into account.
We conclude that the sound correspondences detected by PARAFAC form the linguistic basis of the two-way and three-way divisions of Bul-garian dialect area. Using the PARAFAC method we are able to detect that the most important sound
changes on which two-way division is based are [o]-[u], [A]-[@] and palatal pronunciation of con-sonants. In the three-way division of sites done by k-means, the area in the south of the country appears as the third most important dialect zone. In the twenty investigated sound correspondences we find that the soft pronunciation of [S],[>Ù] and [Z] sounds is typical only for the varieties in this area. Apart from divisions that divide the country into west and east, including the southern variet-ies, we also detect sound correspondences whose distribution groups together western and southern areas.
[image:7.595.88.492.283.354.2] [image:7.595.91.493.393.460.2]from these dimensions show that eastern, western and southern varieties are the only three that are identified. No other dialect areas were detected based on the sound correspondences from these nine dimensions.
6 Conclusion
In this paper we have appliedPARAFACin the task of detecting the linguistic basis of dialect phonetic variation. The distances between varieties were expressed as a numerical vector that records in-formation on all sound correspondences found in the data set. UsingPARAFACwe were able to ex-tract the most important sound correspondences. Based on the 20 most important sound correspond-ences we performed clustering of all sites in the data set and were able to detect three groups of sites. As found in traditional literature on Bul-garian dialects, these three dialects are the main dialect groups in Bulgaria. Using the aggregate approach on the same data set, the same three dia-lects were the only groups in the data that could be asserted with high confidence. We conclude that this approach is successful in extracting underly-ing lunderly-inguistic structure in dialect variation, while at the same time overcoming some of the problems found in the earlier approaches to this problem.
In future work sounds in the data set could be defined in a more sophisticated way, using some kind of feature representation. Also, the role of stress should be examined in more depth, since there are different patterns of change in stressed in unstressed syllables. We would also like to ex-tend the method and examine more than just two sound correspondences at a time.
References
Brett W. Bader and Tamara G. Kolda. 2009. Matlab tensor toolbox version 2.3. http://csmr.ca. sandia.gov/∼tgkolda/TensorToolbox/, July.
Jonathan Barnes. 2006. Strength and Weakness at the Interface: Positional Neutralization in Phonetics and Phonology. Walter de Gruyter GmbH, Berlin. J. Douglas Carroll and Jih-Jie Chang. 1970. Analysis
of individual differences in multidimensional scal-ing via an n-way generalization of ”eckart-young” decomposition. Psychometrika, 35:283–319. Richard A. Harshman. 1970. Foundations of the
par-afac procedure: models and conditions for an ”ex-planatory” multi-mode factor analysis. In UCLA
Working Papers in Phonetics, volume 16, pages 1– 84, Los Angeles. University of California.
Lawrence Hubert and Phipps Arabie. 1985. Compar-ing partitions. Journal of Classification, 2:193–218. Tamara G. Kolda and Brett W. Bader. 2009. Tensor de-compositions and applications. SIAM Review, 51(3), September.
Vladimir Levenshtein. 1965. Binary codes capable of correcting deletions, insertions and reversals. Dok-lady Akademii Nauk SSSR, 163:845–848.
John Nerbonne. 2006. Identifying linguistic structure in aggregate comparison. Literary and Linguistic Computing, 21(4):463–476.
Karl Pearson. 1901. On lines and planes of closest fit to systems of points in space. Philosophical Magazine, 2(6):559–572.
Jelena Proki´c and John Nerbonne. 2008. Recogniz-ing groups among dialects.International Journal of Humanities and Arts Computing, Special Issue on
Language Variation ed. by John Nerbonne, Char-lotte Gooskens, Sebastian K¨urschner, and Ren´ee van Bezooijen:153–172.
Jelena Proki´c, John Nerbonne, Vladimir Zhobov, Petya Osenova, Krili Simov, Thomas Zastrow, and Erhard Hinrichs. 2009. The Computational Analysis of Bulgarian Dialect Pronunciation.Serdica Journal of Computing, 3:269–298.
Jelena Proki´c. 2007. Identifying linguistic structure in a quantitative analysis of dialect pronunciation. InProceedings of the ACL 2007 Student Research Workshop, pages 61–66.
William M. Rand. 1971. Objective criteria for the eval-uation of clustering methods. Journal of American Statistical Association, 66(336):846–850, Decem-ber.
Robert G. Shackleton. 2007. Phonetic variation in the traditional English dialects. Journal of English Lin-guistics, 35(1):30–102.
Stojko Stojkov. 2002. Bulgarska dialektologiya. Sofia, 4th ed.
Michael E. Wall, Andreas Rechtsteiner, and Luis M. Rocha, 2003. Singular Value Decomposition and Principal Component Analysis, chapter 5, pages 91– 109. Kluwer, Norwell, MA, Mar.
![Figure 5: [A]-[@] (left), [o]-[u] (middle), [e]-[i] (right) sound correspondences.](https://thumb-us.123doks.com/thumbv2/123dok_us/1543568.698977/6.595.101.490.295.455/figure-left-o-u-middle-right-sound-correspondences.webp)
![Figure 7: [S]-[C] (left), [>Ù]-[>ťC] (middle), [Z]-[ý] (right) sound correspondences.](https://thumb-us.123doks.com/thumbv2/123dok_us/1543568.698977/7.595.91.493.393.460/figure-left-u-tc-middle-right-sound-correspondences.webp)