Eileen Fumagalli, Gaia Narciso
PII: S0176-2680(11)00100-5
DOI: doi:10.1016/j.ejpoleco.2011.10.002
Reference: POLECO 1266
To appear in: European Journal of Political Economy
Received date: 11 April 2011 Revised date: 19 October 2011 Accepted date: 23 October 2011
Please cite this article as: Fumagalli, Eileen, Narciso, Gaia, Political institutions, voter turnout, and policy outcomes, European Journal of Political Economy (2011), doi:
10.1016/j.ejpoleco.2011.10.002
ACCEPTED MANUSCRIPT
1
Political institutions, voter turnout, and policy outcomes
Eileen Fumagallia, Gaia Narcisob,c,d,*a IEFE, Bocconi University, via Roentgen, 20136, Milan, Italy.
bTrinity College Dublin, Department of Economics, Arts Building, Dublin 2, Ireland.
c Institute for International Integration Studies (IIIS), Dublin, Ireland. d CReAM, London, U.K.
Abstract: This paper tests whether constitutions directly affect economic outcomes. By introducing citizens’ political participation as the driving force connecting institutions to policy outcomes, we empirically show that voter turnout is the channel through which forms of government affect economic policies. We provide evidence of the existence of two relationships. First, presidential regimes appear to be associated with lower voter participation in national elections. Second, higher voter participation induces an increase in government expenditure, total revenues, welfare state spending, and budget deficit. We conclude that forms of government affect policy outcomes only through voter turnout.
Hig h lig h t s
Relat io n sh ip b et w een f o r m s o f g o ver n m en t an d elect o r al p ar t icip at io n . Lo w er p ar t icip at io n in p r esid en t ial r eg im es.
Hig h er t ur n o u t r at es ar e asso ciat ed t o lar g er g o ver n m en t sp en d in g , h ig h er g o ver n m en t , r even u es, m o r e g en er o us w elf ar e st at e an d lar g er b u d g et d ef icit s. Fo r m s o f g o ver n m en t in f lu en ce p o licies t h r o u g h vo t er p ar t icip at io n at g en er al elect io n s
JEL: D72, E60, H00.
Keywords: Electoral rule, form of government, voter participation, policy outcomes.
*Corresponding author. Trinity College Dublin, Department of Economics, Arts Building, Dublin 2, Ireland.
Tel.: +353(0)18961067; fax: +353(0)16772503.
ACCEPTED MANUSCRIPT
3
1.
Introduction
The effect of political institutions on policy outcomes has attracted much attention in the literature over recent years. Theoretical research has shown how forms of government and electoral rules shape fiscal policies. Persson and Tabellini (2000), Lizzeri and Persico (2001), Milesi-Ferretti, Perotti and Rostagno (2002), and Persson, Roland and Tabellini (2007) have compared majority and proportional voting rules and have found that majority rules, through a focus of attention on voters in marginal electoral districts, result in less government spending and more targeted programs. Gagliarducci, Nannicini and Naticchioni (2011) used Italian micro data and showed that politicians elected under a majority rule are more likely to propose targeted and narrow programs than representatives elected through proportional representation. Persson, Roland and Tabellini (1997) classified the form of government according to whether a vote of confidence was included and found that parliamentary regimes were characterized by larger government expenditure, as the vote of confidence in executive power leads to legislative cohesion in parliamentary regimes, which is expressed in the broader and more generous spending on public goods than in presidential systems. Persson and Tabellini (2003, 2004) empirically examined the economic consequences of constitutions for a large set of democracies and found that political institutions have a significant effect on policy outcomes, with a majority electoral rule being associated with less government spending and smaller welfare programs relative to a proportional rule, while presidential regimes resulted in less public good spending than parliamentary regimes.
In our study we provide evidence that forms of government influence voter turnout at general elections and that voter participation in turn affects economic outcomes. The novelty of our study is the introduction of citizens’ political participation, rather than politicians’ incentives, as the driving force connecting institutions to policy outcomes. We empirically show that voter turnout is the channel through which forms of government affect economic policies.
ACCEPTED MANUSCRIPT
4
knowledge, our study is the first empirical analysis of the effects of political regimes on turnout, other than Powell (1982) and Lijphart (2001). Powell found lower turnout rates in countries with a presidential regime and a majoritarian system and suggested this might be due to a weaker party system and less mobilizing voting laws. In his analysis of 36 democracies, Lijphart found that electoral participation in presidential regimes was 12 percentage points smaller than average voter turnout in parliamentary democracies.
Using a larger data set comprising both free and semi-free countries, our study provides robust evidence that forms of government affect turnout rates. Presidential regimes are found to be associated with lower participation relative to parliamentary systems. Parliamentary systems are characterized by a stronger attachment of voters (Stepan and Skach, 1993) and consequently higher expressive benefits from voting.1 This can explain why voter turnout is higher in parliamentary than in presidential systems. We provide evidence that the positive effect of parliamentary regimes on voter participation is robust when we relax the conditional mean independence assumption and we instrument government regimes.
Regarding the second relationship between voter turnout and policy outcomes, many studies have analyzed related topics. Aidt, Dutta, and Loukoianova (2006) found that government spending increased in Europe when the franchise was extended to individuals from the lower part of the income distribution, whilst Aidt, Daunton and Dutta (2010) provided evidence of a U-shaped relationship between enfranchisement and spending in England and Wales. Husted and Kenny (1997) showed that the abolition of poll taxes and literacy tests in the US increased the scope of the welfare state. Aidt and Eterovic (2011) found that the removal of literacy requirements was associated with larger government expenditure in 20th century South America. A similar argument can be applied to voter participation in the presence of universal franchise: among others, Blais (2000) and Wolfinger and Rosenstone (1980) showed that the median income of participating voters was higher than the median income of the voting-age population. Lijphart (1997) proposed that such a bias in voter participation can underlie bias in policy choices. In line with this reasoning, Mueller and Stratmann (2003) analyzed the effects of turnout rate on policy outcomes and found voter participation to increase the size of government and reduce income inequality.
Our study shows that higher voter turnout increases government expenditure, total revenues, welfare state spending, and the budget deficit. These results are in line with
ACCEPTED MANUSCRIPT
5
Lijphart (1997), as higher voter turnout entails a larger participation of the lower end of the income distribution, hence a larger representation of people who are more likely to benefit from more redistributive policies.
Unlike previous empirical studies, we focus on the relationship between forms of government and electoral participation and on how this relationship affects total government expenditure, revenues, welfare state spending, and budget. We show that electoral participation is lower in presidential regimes. The instrumental variable analysis shows that higher turnout rates are associated with larger government spending, higher government revenues, more generous welfare state and larger budget deficits. We conclude that the manner in which different forms of government influence policies is mediated by voter participation at general elections.
The rest of the paper is organized as follows: Section 2 describes the data set. Section 3 empirically shows the existence of the link between constitutional variables and voter turnout and provides a set of exogenous instruments for electoral participation. Section 4 shows the impact of voter turnout on policy outcomes. Section 5 presents a robustness check on the analysis performed. Section 6 concludes.
2.
Data
We use two main data sources. The first is the cross-country data set used by Persson and Tabellini (2003, 2004). The data set contains information relating to 85 countries classified as democracies in the 1990s. Observation units are average values over the period 1990-1998. The quality of a democracy is defined on the basis of the Gastil Index of Political and Civil Rights produced by Freedom House. The Gastil Index takes values from 1 to 7, where lower values correspond to better democracies. Both free and semi-free democracies are included in the data set, which corresponds to a Gastil Index less than or equal to 5.
ACCEPTED MANUSCRIPT
6
1 represents single-member districts, as in the UK system, and 0 corresponds to systems characterized by one single national district, as in the Israeli system.
As to the definition of the form of government employed, a country is coded as presidential if the government is not subject to a vote of confidence by the Parliament (Presidential=1). If a vote of confidence is present, the country is defined as parliamentary. The US and Argentina, for example, are labeled as presidential regimes. France, however, is classified as a parliamentary regime, given that its executive power is subject to the vote of confidence from the Parliament.
Approximately 58% of the parliamentary regimes in our sample have a proportional/mixed rule, while around 67% of presidential regimes have a proportional/mixed rule. This heterogeneity between forms of government and electoral rules allows us to disentangle the distinctive effects of the two institutions on voter participation.
The second data source is the Institute of Democracy and Electoral Assistance (IDEA). The IDEA database contains information on political participation for national presidential and parliamentary elections since 1945. Voter participation is defined as the ratio of votes at national elections to the voting age population. In presidential regimes, voter turnout is measured as the average between National Presidential and Parliamentary elections. We adopt the ratio between the number of votes at national elections and the voting age population instead of using the ratio with the number of registered voters, primarily because registration in itself acts as a form of political participation.
Voter participation varies greatly across the 85 countries considered during the 1990-1998 period, with an overall average participation rate of 67%. Senegal, Guatemala, Colombia, Zambia, Pakistan and Switzerland have recorded the lowest voting turnout, ranging from 24.19% to 37.67%; while Italy, Uruguay and Malta register the highest voter turnout rates, between 90.18% and 96.43%.2
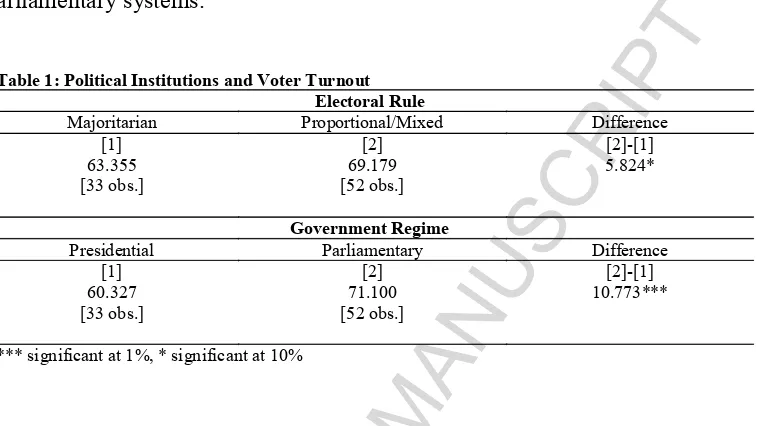
Many empirical studies have analyzed the impact of the electoral rule on voter participation: turnout is usually found to be lower in countries with a plurality rule. Table 1 presents the results of a simple exercise. We split the data on voter participation by electoral rule and form of government. In line with the literature presented in the introduction, participation at general elections is about 6% higher in proportional regimes relative to majoritarian ones. But do forms of government have an impact on voter turnout as well? The lower panel of Table 1 compares voter participation in presidential and parliamentary
ACCEPTED MANUSCRIPT
7
[image:7.595.80.460.141.354.2]systems. Participation in elections is higher in parliamentary systems than in presidential systems and the difference is statistically different from zero. The average turnout in presidential systems amounts to 60.3%, significantly lower than the rate of 71.1% recorded in parliamentary systems.
Table 1: Political Institutions and Voter Turnout Electoral Rule
Majoritarian Proportional/Mixed Difference
[1] [2] [2]-[1]
63.355 69.179 5.824*
[33 obs.] [52 obs.]
Government Regime
Presidential Parliamentary Difference
[1] [2] [2]-[1]
60.327 71.100 10.773***
[33 obs.] [52 obs.]
*** significant at 1%, * significant at 10%
These stylized facts are the starting point of our analysis: from Table 1 it appears that there exists a correlation between voter turnout and political institutions. In the next section we explore further the relationship between constitutions and electoral participation.
3.
Do constitutions shape voter turnout?
3.1 Constitutions and voter turnout: OLS analysis
The section addresses two main issues: first, we analyze the relationship between constitutions and voter turnout; second, we identify the exogenous instruments for electoral participation required to assess its impact on economic policies. The dependent variable is voter participation at national elections, as defined in Section 2.
We focus on two sets of determinants: constitutional variables, as expressed by the form of government and the electoral rule (Presidential, Majoritarian) and socioeconomic variables. Our specification is as follows:
0 1 2
i i i i
Turnout Majoritarian Presidential X' βi (1)
where Majoritariani is the dummy variable measuring the electoral rule, Presidentiali is the
ACCEPTED MANUSCRIPT
8
We are mainly interested in the effects of constitutions on electoral participation, i.e. in the sign and the statistical significance of the coefficients 1 and 2.
Constitutions and electoral laws might regulate voting, in some cases by introducing sanctions for those who abstain. We introduce two variables in order to measure electoral voting laws: compulsory voting laws and a measure of the ease of electoral registration. Among others, Powell (1982), Jackman (1987) and Blais (2000) show that voting laws are indeed effective in inducing higher voter participation. We include a dummy variable, compulsory voting, which takes the value 1 in the presence of compulsory voting laws and 0 otherwise. We also measure the extent to which the state assumes responsibility for voter registration. We create a dummy variable, voter registration, which takes the value 1 if voter registration solely relies on the initiative of voters and 0 otherwise. Finally, we consider a further measure of constitutions: the distance between voters and candidates in national elections. To this end, we include the percentage of legislators elected in national districts rather than in subnational constituencies. This variable was constructed by Seddon et al. (2003) and it identifies who appoints the candidates. A candidate selected by national leaders is considered to be from a national constituency. Our prior is that the higher the share of candidates elected at national districts, the greater the distance between voters and candidates, and consequentially the lower electoral participation.
Education is a key variable in explaining voter turnout at a micro level. Wolfinger and Rosenstone (1980), Blais (2000) and Sondheimer and Green (2010) empirically show that the propensity to vote increases substantially with education. Therefore, we insert the country’s education level as measured by the total enrollment in primary and secondary education as a percentage of the relevant age group in the population.
We include the natural logarithm of total population in order to proxy the weight of one single vote whereby the larger the population the lower the weight. In addition, we control for real GDP per capita, the Gini index of income distribution, whether the country is an OECD member, the quality of democracy (Gastil Index) and the presence of a federal structure.3 Alesina and La Ferrara (2000) provide evidence that participation in social activities is lower in more racially or ethnically fragmented communities. To this end, we control for the degree of ethno-linguistic fractionalization, measured by the Avelf index, which takes values between 0 (homogeneous) and 1 (strongly fractionalized). Hall and Jones (1999), Acemoglu, Johnson and Robinson (2001) and Acemoglu (2005) show that colonial
ACCEPTED MANUSCRIPT
9
history is relevant for the institutional setup of a country. Therefore, we control for geographical variables (Latin America, Asia, Africa) and colonial variables (English colonies, Spanish-Portuguese colonies and other colonies).
ACCEPTED MANUSCRIPT
[image:10.595.68.528.83.594.2]10
Table 2: Determinants of voter turnout.
[1] [2] [3] [4] [5] [6]
Voter Turnout
Majoritarian 0.825 -4.099 1.561 -2.285
[4.003] [5.148] [3.833] [4.779]
Presidential -10.875** -14.754** -11.741** -16.125*** -12.388** -17.425***
[4.871] [5.716] [4.559] [5.300] [4.657] [5.447]
Compulsory 4.731 5.987
voting [3.407] [4.392]
% Legislators elected -15.683* -22.202** -15.684** -22.038*** -15.772** -24.574***
in National districts [8.117] [8.487] [6.986] [7.151] [6.860] [6.506]
Education 0.387** 0.275 0.416** 0.273 0.397** 0.231
[0.173] [0.198] [0.167] [0.197] [0.171] [0.183]
Gini index -0.106 -0.416 0.110 -0.052 0.115 -0.175
[0.231] [0.300] [0.232] [0.295] [0.234] [0.298]
Log[Population] 0.863 1.773 1.077 1.744 1.149 2.206
[1.290] [1.617] [1.230] [1.593] [1.154] [1.465]
Log[Real GDP per capita] -2.009 1.721 -3.078 0.058 -3.386 0.206
[4.124] [5.094] [3.857] [4.498] [3.768] [4.503]
Ethno-linguistic -4.884 -24.351** 0.727 -18.195 1.816 -21.657**
fractionalization [9.831] [10.972] [9.140] [11.139] [9.084] [10.723]
Gastil Index -1.253 -0.515 -1.087 -0.026 -1.430 -0.105
[3.087] [3.237] [3.210] [3.363] [3.104] [3.114]
Federal -6.264 -8.492 -5.398 -6.635 -4.625 -6.048
[4.831] [5.264] [5.202] [5.483] [5.282] [5.091]
Voter registration -11.403** -14.684*** -10.153* -12.498**
[5.029] [4.807] [5.071] [5.156]
District Magnitude -2.570 -10.528*
[4.613] [5.529]
OECD member -6.821 -4.033 -3.468 -2.370 -3.507 -0.599
[7.453] [9.407] [7.041] [9.164] [7.161] [8.569]
Continents and Colonies Excluded Included Excluded Included Excluded Included
Observations 63 63 63 63 63 63
Adjusted R-squared 0.28 0.28 0.34 0.36 0.34 0.40
Robust standard errors in brackets. * significant at 10%; ** significant at 5%; *** significant at 1%.
ACCEPTED MANUSCRIPT
11
10.9% lower than electoral participation in parliamentary regimes. We do not find a statistically significant impact of the electoral rule on participation rate.4
Compulsory voting laws do not have a statistically significant effect on voter turnout. Weak enforcement of electoral laws might explain this result. In line with our prior, the share of legislators elected at national districts, proxying the distance between candidates and voters, has a negative and statistically significant impact on voter participation: a higher share of legislators elected at national districts rather than at subnational districts results in a lower turnout rate.
The education level is positively related to voter turnout, while the coefficient on the quality of democracy (Gastil Index) is not statistically significant but it has the expected negative sign. Real per capita GDP does not affect voter turnout in a statistically significant way. When analyzed at a micro level, participation and income are usually found to be positively correlated. However, in cross-country studies such relationship becomes less clear, as noted by Mueller and Stratmann (2003).
The conclusion we draw from this baseline analysis is that, after controlling for socioeconomic variables, forms of government affect voter participation. On the other hand, the electoral rule as defined by the dummy variable Majoritarian has no role in explaining turnout, in contrast with our prior. This result is likely to be driven by the definition of the variable Majoritarian that we adopt. We investigate this issue further in columns 5 and 6 of Table 2.
In column 2 we add geographical variables (Latin America, Asia, and Africa) and colonial variables (English colonies, Spanish-Portuguese colonies and other colonies) to the basic specification. Presidential regimes and the distance between voters and candidates continue to be associated with lower electoral participation, while majoritarian rules have no impact on turnout. In addition, countries which are more ethnolinguistically homogenous, i.e. those having a lower Avelf index, are associated with higher voter turnout. This result is concordant with Blais (2000), as voting acts as a way of “expressing one’s sense of belonging to the larger community” (page 52).
Next, we insert the registration variable as an alternative measure of voting laws. The registration dummy assesses the extent to which the state assumes the responsibility for voter
4This result is not surprising, given the definition of the variable Majoritarian, created by Persson and Tabellini
ACCEPTED MANUSCRIPT
12
registration. It takes the value 1 if voter registration solely relies on the initiative of voters, and 0 otherwise. This variable measures the incentive of voters to register, i.e. whether registration is compulsory or not, and the level of difficulty of registering, i.e. whether voters have to explicitly register or whether voter registers are directly compiled by the government. We would expect that such a voting rule should have a negative impact on voter turnout. The results reported in column 3 show that this is indeed the case. Voter registration has a negative and statistically significant impact on voter turnout. All the other results hold, also when we control for colonies and continents (column 4).
Finally, we investigate the role of electoral rules in influencing voter turnout by adopting the continuous measure of district magnitude, Magnitude, instead of the binary variable Majoritarian. Columns 5 and 6 present the estimation results. The electoral rule appears to be relatively effective in influencing participation once we control for continents and colonies (column 6): the higher the number of seats in the district, the higher the rate of voter participation. This result is in line with the empirical evidence presented in the introduction: proportional systems are correlated with greater voter participation. Again, the impact of presidential regimes on electoral turnout is negative and statistically significant at the 1% level, while the estimated coefficient of voter registration is negative and statistically significant at the 5% level.
3.2 Constitutions and voter turnout: instrumental variable analysis
ACCEPTED MANUSCRIPT
13
rather than the type of institutions. We deal with this critique by introducing a new instrument to the existing set of Persson and Tabellini’s instruments.5 We create a dummy variable, monarchy, taking the value 1 if the country has a monarchical history and 0 otherwise. We argue that the likelihood of adopting a parliamentary regime is higher if a country is or has been a monarchy. Indeed, out of 33 presidential regimes in our sample, only 4 countries are or have ever been a monarchy.
Is the variable monarchy a valid instrument or does it capture other variables such as geography or colonial past? Table 3 presents the correlation coefficients between the variable monarchy and geographical, institutional and colonial variables. Some geographical variables pertain, given that Latin America and Africa appear to be highly correlated with monarchy. However, the correlation between monarchy and presidential is the highest (-0.46).
Table 3: Correlations
Monarchy Pres Latin America Africa British Colony Spanish Colony Colony [Other] Federal
Monarchy 1.0000
Presidential -0.4585 1.0000
Latin America -0.2968 0.4498 1.0000
Africa -0.3256 0.2014 -0.2420 1.0000
British Colony -0.2687 -0.0833 -0.0708 0.3987 1.0000
Spanish Colony -0.2721 0.5615 0.5594 -0.1738 -0.3268 1.0000
Colony [Other] -0.0556 -0.2518 -0.3323 -0.0618 -0.1958 -0.0966 1.0000
Federal 0.1803 0.1354 0.0294 -0.1684 -0.0884 0.0696 -0.2521 1.0000
Majoritarian -0.1367 -0.0999 -0.0885 0.2859 0.5838 -0.1509 -0.2012 0.0099
Given that the endogenous explanatory variable, Presidential, is binary, we make use of the dummy endogenous variable model by Heckman (1978). Column 1 of Table 4 reports the results of the first stage regression of the two-stages Heckman estimation, where presidential system is treated as the endogenous variable. In line with our prior, monarchy has a statistically significant impact on the form of government. Countries with a monarchical history are less likely to adopt a presidential form of government. Latitude and the fraction of the population speaking English appear to be positively correlated with parliamentary
ACCEPTED MANUSCRIPT
14
regimes, while the fraction of population speaking any other European language has a positive and statistically significant impact on the likelihood of having a presidential regime. Column 2 presents the second stage of the Heckman estimation. The estimated coefficient of presidential regimes is negative and statistically significant at the 1% level. Similarly, voter registration and the distance between voters and candidates reduce electoral participation, whereby both estimated coefficients are statistically significant at the 1% level. Columns 3 and 4 of Table 4 present the specification with majoritarian electoral rules as the endogenous variable. However, we find no statistically significant impact of majoritarian systems on voter participation and the estimates do not differ from the previous specification.
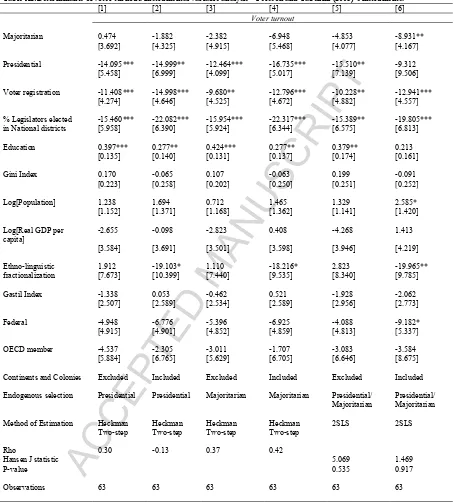
Columns 5-7 of Table 4 present the estimation results of the instrumental variable analysis. Column 5 reports the first stage for the form of government variable. In line with the Heckman estimation, current and former monarchies are less likely to be associated with a presidential form of government. Younger democracies are also correlated with presidential regimes, while Hall and Jones’s instruments are in line with Persson and Tabellini (2004)’s estimates. We deal with Acemoglu (2005)’s critique by showing the F-test for the joint significance of constitutional variables (year in which the constitution was set up and age of democracy). The excluded instruments are good predictors of the variables of interest, as indicated by the Shea partial R-squared. The Hansen J test does not cast doubt on their validity. Column 6 presents the first stage for the electoral rule. Countries with a higher fraction of the population speaking English are more likely to have a majoritarian rule, following the influence of British colonization. Column 7 presents the second stage of the IV analysis: parliamentary regimes are more likely to be associated with higher voter participation, while proportional/mixed rules are correlated with higher electoral participation. Voter registration and distance between candidates and voters have a negative and statistically significant impact on voter turnout. Presidential regimes still negatively affect voter turnout and the estimated coefficient is larger than the OLS estimate. The majoritarian electoral rule now has a negative and statistically significant impact, in line with the findings by Blais (2000). All the other covariates retain their significance as in previous columns.6
6We have undertaken a series of robustness checks by varying the set of control variables. The overall
ACCEPTED MANUSCRIPT
[image:15.595.70.530.80.713.2]15
Table 4: Determinants of voter turnout. Instrumental variable analysis.
[1] [2] [3] [4] [5] [6] [7]
First Stage
PRES Second stage Turnout
First Stage
MAJ Second stage Turnout
First stage
PRES First stage MAJ Second stage Turnout
CON2150 0.229 -0.756 -0.063 -0.583***
[1.577] [0.745] [0.151] [0.196]
CON5180 -3.553 1.321* -0.075 0.249
[2.534] [0.720] [0.098] [0.150]
CON81 -1.417 1.032 0.001 0.128
[2.405] [0.732] [0.129] [0.183]
Monarchy -2.911** 0.131 -0.373** 0.067
[1.394] [0.587] [0.138] [0.144]
Latitude -16.884*** -2.555 -0.578 1.217
[6.340] [1.885] [0.538] [0.745]
Age of Democracy 3.042 0.607 0.614** 0.290
[2.666] [1.426] [0.234] [0.229]
ENGFRAC -5.660** 4.738*** -0.478** 0.461**
[2.238] [1.445] [0.201] [0.205]
EURFRAC 4.116*** -1.537*** 0.001 0.080
[1.441] [0.578] [0.149] [0.177]
Majoritarian -3.726 -4.454 -9.236**
[4.238] [5.435] [4.126]
Presidential -18.822*** -16.289*** -15.665**
[5.747] [5.043] [7.491]
Voter Registration -14.325*** -13.749*** -0.112 -0.075 -13.521***
[4.445] [4.717] [0.122] [0.126] [4.551]
% Legislators, -22.056*** -21.683*** -0.424*** -0.087 -22.122***
National districts [6.335] [6.403] [0.128] [0.193] [6.502]
Education 0.240* 0.278** 0.001 -0.016*** 0.202
[0.142] [0.139] [0.004] [0.005] [0.162]
Gini Index -0.020 -0.056 -0.005 -0.006 -0.100
[0.254] [0.252] [0.005] [0.007] [0.253]
Log[Pop] 1.871 1.567 0.030 0.144*** 2.666*
[1.358] [1.387] [0.032] [0.047] [1.365]
Log[Real GDP pc] 0.592 0.170 -0.092 0.048 0.771
[3.673] [3.626] [0.078] [0.100] [4.157]
Avelf Index -16.733* -18.122* -0.512** -0.467 -21.062**
[9.676] [9.603] [0.240] [0.294] [9.545]
Gastil index -0.630 0.341 0.153*** -0.124* -1.271
[2.632] [2.638] [0.052] [0.071] [2.676]
Federal dummy -6.740 -6.814 0.094 -0.108 -8.236*
[4.887] [4.874] [0.126] [0.177] [4.899]
OECD -2.804 -2.187 0.120 0.101 -1.347
[6.787] [6.744] [0.150] [0.205] [8.408]
Continents and
Colonies Included Included Included
Rho 0.43101 0.20712
F-test on constitution
variables [p-value] [0.0378] 2.83 [0.0132] 3.64
F-test on all excluded Instruments [p-value]
3.14
[0.0079] [0.0000] 7.12
Hansen J statistic
[p-value] [0.69716] 3.849
Shea Partial R2 0.4509 0.5137
Estimation method Heckman Two-step Heckman Two-step 2SLS
Observations 63 63 63 63 63 63 63
ACCEPTED MANUSCRIPT
16
These results shed light on what we consider the first relationship, i.e. the link between constitutions and voter turnout. The effect of forms of government on voter turnout is robust even when we relax the conditional mean independence assumption and we instrument constitutions. In presidential systems people tend to vote less, whilst the impact of the electoral formula, measured by the binary variable Majoritarian, is less strong on voter turnout.
Why is electoral participation greater in parliamentary than in presidential systems? In the light of the expressive voting literature (Brennan and Hamlin, 2000; Hillman 2010; Hamlin and Jennings, 2011), voter turnout is expected to be higher in political regimes offering more scope for expressive utility through identification of voters with political parties.7 Stepan and Skach (1993) suggest that the longer party-government careers that characterize parliamentary systems influence voters through greater experience with political representatives, which leads to a stronger attachment of voters in parliamentary systems and consequently higher expressive benefits from voting. This in turn can explain why voter turnout is higher in parliamentary than in presidential systems. Having proved the first link, we now turn to the second one in order to understand the effect of voter turnout on economic policies.
4.
Voter turnout and policy outcomes
A first attempt to study the relationship between voter turnout and economic policies was by Mueller and Stratmann (2003). Their conclusions support our argument that electoral participation affects government size. Unlike Mueller and Stratmann, we are not solely interested in showing the impact of voter turnout on different measures of policy outcomes. Our study is grounded in the relationship between participation and constitutions in affecting fiscal policies. We investigate whether turnout can account, inter alia, for government expenditure, welfare state, and government budget surplus.
Persson and Tabellini (2004) empirically show the effects of political institutions on economic policy. Majoritarian elections and presidential systems are found to negatively and
ACCEPTED MANUSCRIPT
17
significantly influence total government spending. We build upon their analysis to show that voter turnout is the channel through which presidential regimes affect policy outcomes.
We treat voter turnout as endogenous. It is indeed very likely that in countries with more generous economic policies citizens are more willing to participate at elections in order to keep their status quo. Most of the determinants of voter turnout are endogenous to policy outcomes and they cannot be used as valid instruments. On the basis of the analysis conducted in Section 3, we concentrate on a set of three instruments: voter registration, distance between candidates and voters and form of government.
Voter registration increases the costs of voting and, as shown in the previous section, reduces voter turnout. Additionally, the level of each policy outcome is not statistically different between countries with voter registration and countries without voter registration. We therefore use voter registration as an exogenous instrument for electoral participation.
The share of legislators elected at national district level rather than subnational electoral district has an impact on electoral participation, as the more distant candidates and voters are from one another, the lower the level of participation at elections.
Finally, the presidential dummy is included as an exogenous instrument.8 The electoral rule is not included as an exogenous instrument for voter turnout for two reasons: first, the impact of the electoral rule on voter participation does not appear as strong as the impact of government regimes. Second, the electoral rule still has a direct effect on policy outcome variables. Table 5 reports the estimation results.
The first stage consists of regressing participation rates on the exogenous instruments, i.e. the voter registration dummy, the presidential regime dummy and the share of legislators elected at national districts, together with all the other policy outcomes’ determinants. In the second stage, we regress fiscal policies on the fitted participation variable and on the set of control variables. We control for the following variables: electoral rule, natural logarithm of real per capita income, natural logarithm of population, trade openness, age of democracy, quality of democracy, colonial history, dummy variables for federal countries, OECD countries and continents, and two demographic variables measuring the age proportion of the population.
ACCEPTED MANUSCRIPT
[image:18.595.50.551.77.592.2]18
Table 5. Policy outcomes and voter turnout. Instrumental variable analysis.
[1] [2] [3] [4] [5] [6] [7] [8]
First stage
Turnout Second stage: Central Government
Spending
First stage
Turnout Second stage: Central Government
Revenue
First stage
Turnout Second stage: Budget Surplus
First stage
Turnout Second stage: Welfare spending
Voter Turnout 0.546*** 0.446* -0.139** 0.243**
[0.196] [0.235] [0.061] [0.101]
Majoritarian -7.000* -1.350 -6.747* -0.093 -6.169 2.136** -5.355 -1.102
[3.885] [2.477] [3.979] [2.269] [4.113] [0.851] [5.031] [1.167]
Age of -3.720 -1.307 -2.746 -1.069 -4.719 -1.700 -3.833 2.095
Democracy [9.431] [5.391] [9.348] [5.416] [9.838] [1.534] [10.890] [3.708]
Gastil index -3.774 -0.203 -3.549 -0.814 -3.019 -0.733 -2.816 -0.351
[2.989] [2.207] [2.920] [2.518] [3.185] [0.732] [3.666] [1.057]
Log[Real GDP pc] -0.539 0.064 -0.429 2.674 -0.703 1.676** 0.373 -0.167
[3.732] [2.047] [3.935] [2.111] [3.766] [0.717] [4.037] [1.213]
Trade -0.075 0.118*** -0.082 0.122*** -0.090 0.010 -0.080 0.059**
[0.082] [0.042] [0.081] [0.041] [0.081] [0.012] [0.088] [0.023]
% Population 0.802 0.583 1.238 0.374 1.405 0.110 1.075 0.942**
above 65y [1.030] [0.630] [1.208] [0.741] [1.190] [0.166] [1.251] [0.380]
% Population 0.793* -0.613* 0.857* -0.641* 0.488 -0.143 0.509 -0.188
14-65y [0.442] [0.334] [0.454] [0.353] [0.469] [0.105] [0.387] [0.135]
Federal dummy -4.858 -2.450 -4.679 -2.997 -5.531 -0.829 -2.690 0.028
[5.313] [3.106] [5.357] [2.693] [5.447] [0.951] [5.435] [1.405]
OECD -6.120 1.998 -7.662 -0.242 -6.054 -2.965** -8.002 0.047
[7.604] [5.232] [7.825] [5.472] [7.573] [1.330] [7.743] [2.492]
Log[Pop] -0.597 -0.973 -1.056 -0.904
[2.474] [2.489] [2.505] [2.914]
Presidential -10.957** -11.764** -10.296** -11.635*
[4.798] [4.944] [5.062] [6.145]
% Legislators, -15.200** -14.415** -14.885** -13.410**
National districts [6.450] [6.497] [7.195] [6.327]
Voter -4.456 -1.942 -1.102 -6.680
Registration [4.749] [5.912] [5.755] [6.336]
Continents and
Colonies Included Included Included Included
F-test on all excluded instruments
3.49
[0.022] [0.036] 3.06 [0.062] 2.61 [0.065] 2.58
Shea Partial R2 0.1249 0.1265 0.1255 0.1242
Hansen J statistic 0.018 0.339 3.313 0.385
[P-value] [0.991] [0.844] [0.191] [0.825]
Observations 74 74 71 71 68 68 65 65
Robust standard errors in parentheses. * significant at 10%; ** significant at 5%; *** significant at 1%.
ACCEPTED MANUSCRIPT
19
expenditure at the 1% significance level. A higher participation rate is associated with an increase in the size of government. Our results seem to contradict the findings by Persson and Tabellini (2004): once voter turnout is included in the specification, the electoral rule no longer has a statistically significant impact on government expenditure.
In columns 3 and 4 we consider another measure of government size. The dependent variable is central government revenues as a percentage of GDP. Column 3 reports the first stage of the IV analysis. The excluded instruments are jointly statistically significant at the 5% level and we cannot reject the hypothesis of the validity of the excluded instruments. The estimated coefficients of the presidential regime and the percentage of legislators elected in national district are both statistically significant at the 5% level. Column 4 shows the estimates for the second stage: turnout affects revenues, and its impact is both positive and statistically significant at the 10% level.
Next, we consider government surplus as the dependent variable. Applying a specification similar to those implemented before, we regress budget surplus as a percentage of GDP on constitutional variables, participation rates and the set of usual controls. The electoral rule seems to play a major role in explaining budget surplus. Majoritarian systems are associated with higher budget surplus, while voter turnout has a negative impact on it.
Finally, we investigate the role of voter turnout in explaining central government spending on social services and welfare as a percentage of GDP. The estimated coefficient is positive, as expected, and it is statistically significant at the 5% level. This result is remarkable as it supports the idea that a higher turnout rate is indicative of a larger participation of the lower end of the income distribution, hence more representative of people who are more likely to benefit from more redistributive policies, as stated by Lijphart (1997).
Interestingly, the introduction of voter participation reduces both quantitatively and qualitatively the impact of the electoral rule in influencing the size of government and welfare state, with respect to the results by Persson and Tabellini (2004).
ACCEPTED MANUSCRIPT
20
5.
Robustness check
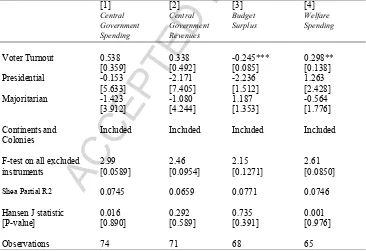
Is the presidential dummy variable a valid instrument? In order to prove that presidential regimes do not have a direct impact on policy outcomes, Table 6 shows that the estimated coefficient of presidential regimes is not statistically significant once we control for voter turnout instrumented by the remaining two instruments, i.e. voter registration and the percentage of legislators elected at national districts. The Hansen J statistic does not cast doubt on the validity of the instruments, although the F-value of the test on all the excluded instruments is low when budget surplus is the dependent variable. It is important to note that estimated coefficients of forms of government are never statistically significant. In line with the previous findings, voter turnout has a statistically significant impact on budget surplus and welfare spending (columns 3 and 4).
Table 6: Policy outcomes and voter turnout. Instrumental variable analysis - Presidential regime as independent variable
[1] [2] [3] [4]
Central Central Budget Welfare Government Government Surplus Spending Spending Revenues
Voter Turnout 0.538 0.338 -0.245*** 0.298**
[0.359] [0.492] [0.085] [0.138]
Presidential -0.153 -2.171 -2.236 1.263
[5.633] [7.405] [1.512] [2.428]
Majoritarian -1.423 -1.080 1.187 -0.564
[3.912] [4.244] [1.353] [1.776]
Continents and
Colonies Included Included Included Included
F-test on all excluded
instruments 2.99 [0.0589] 2.46 [0.0954] 2.15 [0.1271] 2.61 [0.0850]
Shea Partial R2 0.0745 0.0659 0.0771 0.0746
[image:20.595.70.436.363.614.2]Hansen J statistic 0.016 0.292 0.735 0.001
[P-value] [0.890] [0.589] [0.391] [0.976]
Observations 74 71 68 65
All regressions include log[population], Gastil Index, OECD, Federal, prop65, prop1564, trade, log[Real GDP per capita], age of democracy. Excluded instruments: voter registration, % Legislators elected at national districts. Robust standard errors in parentheses.
* significant at 10%; ** significant at 5%; *** significant at 1%.
6.
Conclusions
ACCEPTED MANUSCRIPT
21
relationships using a large sample of democracies. First, we investigate the link between political institutions, in terms of forms of government and electoral rules, and voter turnout. Presidential regimes are found to result in less electoral participation, once we control for other socioeconomic covariates. We also provide some evidence that proportional systems are correlated with greater voter participation, although this latter finding depends on the way in which the electoral rule is measured. Further, we relax the conditional mean independence assumption and we instrument political institutions. The instrumental variable analysis supports the previous results: voter participation is greater in parliamentary regimes than in presidential regimes. The findings can be interpreted in the light of the expressive motivation theory of electoral participation. Presidential regimes are characterized by a lower sense of attachment of citizens to political entities than parliamentary regimes, which lessens expressive payoffs and turnout in presidential systems.
ACCEPTED MANUSCRIPT
22
Acknowledgments
ACCEPTED MANUSCRIPT
23
Data Appendix
Voter turnout: Voter turnout rate is defined as the ratio between the number of votes and the voting age population, which includes all citizens above the legal voting age. Voter turnout is calculated at National Presidential and Parliamentary elections. Source: Institute of Democracy and Electoral Assistance (IDEA), <www.idea.int>.
Compulsory voting laws: dummy variable, equal to 1 if voting has been made compulsory by law, regardless of the level of enforcement, 0 otherwise. Source: International Institute of Democracy and Electoral Assistance (IDEA), <www.idea.int>.
Voter registration: dummy variable, equal to 1 if voter registration relies on the initiative of voters, and 0 otherwise. Source: Authors, on the basis of International Institute of Democracy and Electoral Assistance (IDEA) data, <www.idea.int>.
ACCEPTED MANUSCRIPT
[image:24.595.78.454.91.665.2]24
Table A1: Voter turnout by country.
Country Voter Turnout Country Voter Turnout
Argentina 81.02 Malawi 68.16
Australia 82.45 Malaysia 63.33
Austria 75.88 Malta 96.43
Bahamas 68.19 Mauritius 79.77
Bangladesh 63.05 Nicaragua 75.8
Barbados 66.72 Norway 75.69
Belarus 60.28 Pakistan 37.48
Belgium 84.15 Papua N. Guinea 84.9
Belize 67.25 Mexico 59.03
Bolivia 57.28 Namibia 63
Botswana 44.63 Nepal 83.32
Brazil 79.07 Netherlands 72.66
Bulgaria 73.01 New Zealand 80.42
Canada 60.47 Paraguay 49.4
Chile 78.84 Peru 61.82
Colombia 33.83 Philippines 66.93
Costa Rica 81 Poland 53.84
Cyprus 79.72 Portugal 75.97
Czech republic 82.78 Romania 77.5
Denmark 81.76 Russia 62.72
Dominican Republic 48.9 Senegal 24.19
Ecuador 65.94 Singapore 54.18
El Salvador 54.95 Slovak Republic 82.9
Estonia 56.02 South Africa 85.53
Fiji 59.86 South Korea 79.22
Finland 74.82 Spain 79
France 64.47 Sri Lanka 71.32
Gambia 61.55 St. Vincent & G 75.16
Germany 73.6 Sweden 81.36
Ghana 60.15 Switzerland 37.67
Greece 84.75 Taiwan 70.9
Guatemala 31.34 Thailand 62.5
Honduras 65.8 Trinidad & Tobago 68.85
Hungary 68.13 Turkey 79.05
Iceland 87.82 USA 45.23
India 61.81 Uganda 56.67
Ireland 63.05 UK 72.38
Israel 83.7 Ukraine 69.89
Italy 90.18 Uruguay 96.11
Jamaica 46.72 Venezuela 47.04
Japan 61.46 Zambia 34.13
Latvia 60.31 Zimbabwe 39.43
ACCEPTED MANUSCRIPT
[image:25.595.69.523.78.580.2]25
Table A2:Determinants of voter turnout. Instrumental variable analysis – Persson and Tabellini (2003)’s instruments.
[1] [2] [3] [4] [5] [6]
Voter turnout
Majoritarian 0.474 -1.882 -2.382 -6.948 -4.853 -8.931**
[3.692] [4.325] [4.915] [5.468] [4.077] [4.167]
Presidential -14.095*** -14.999** -12.464*** -16.735*** -15.510** -9.312
[5.458] [6.999] [4.099] [5.017] [7.139] [9.506]
Voter registration -11.408*** -14.998*** -9.680** -12.796*** -10.228** -12.941***
[4.274] [4.646] [4.525] [4.672] [4.882] [4.557]
% Legislators elected -15.460*** -22.082*** -15.954*** -22.317*** -15.389** -19.805***
in National districts [5.958] [6.390] [5.924] [6.344] [6.575] [6.813]
Education 0.397*** 0.277** 0.424*** 0.277** 0.379** 0.213
[0.135] [0.140] [0.131] [0.137] [0.174] [0.161]
Gini Index 0.170 -0.065 0.107 -0.063 0.199 -0.091
[0.223] [0.258] [0.202] [0.250] [0.251] [0.252]
Log[Population] 1.238 1.694 0.712 1.465 1.329 2.585*
[1.152] [1.371] [1.168] [1.362] [1.141] [1.420]
Log[Real GDP per
capita] -2.655 -0.098 -2.823 0.408 -4.268 1.413
[3.584] [3.691] [3.501] [3.598] [3.946] [4.219]
Ethno-linguistic 1.912 -19.103* 1.110 -18.216* 2.823 -19.965**
fractionalization [7.673] [10.399] [7.440] [9.535] [8.340] [9.785]
Gastil Index -1.338 0.053 -0.462 0.521 -1.928 -2.062
[2.507] [2.589] [2.534] [2.589] [2.956] [2.773]
Federal -4.948 -6.776 -5.396 -6.925 -4.088 -9.182*
[4.915] [4.901] [4.852] [4.859] [4.813] [5.337]
OECD member -4.537 -2.305 -3.011 -1.707 -3.083 -3.584
[5.884] [6.765] [5.629] [6.705] [6.646] [8.675]
Continents and Colonies Excluded Included Excluded Included Excluded Included
Endogenous selection Presidential Presidential Majoritarian Majoritarian Presidential/
Majoritarian Presidential/ Majoritarian
Method of Estimation Heckman
Two-step Heckman Two-step Heckman Two-step Heckman Two-step 2SLS 2SLS
Rho 0.30 -0.13 0.37 0.42
Hansen J statistic 5.069 1.469
P-value 0.535 0.917
Observations 63 63 63 63 63 63
ACCEPTED MANUSCRIPT
26
References
Acemoglu, D., 2005. Constitutions, politics, and economics: A review essay on Persson and Tabellini’s The Economic Effects of Constitutions. Journal of Economic Literature 43, 1025-1048.
Acemoglu, D., Johnson, S., Robinson, J.A., 2001. The colonial origins of comparative development: An empirical investigation. American Economic Review 91, 1369-1401.
Aidt, T.S., Daunton, M., Dutta, J., 2010. The retrenchment hypothesis and the extension of the franchise in England and Wales. Economic Journal 120, 990-1020.
Aidt, T.S., Dutta, J., Loukoianova, E., 2006. Democracy comes to Europe: Franchise extension and fiscal outcomes 1830-1938. European Economic Review 50, 249-283.
Aidt, T.S., Eterovic, D.S., 2011. Political competition, electoral participation and public finance in 20th century Latin America. European Journal of Political Economy 27, 181-200. Alesina, A., La Ferrara, E., 2000. Participation in heterogeneous communities. The Quarterly Journal of Economics 115, 847-904.
Blais, A., 2000. To Vote or Not to Vote?: The Merits and Limits of Rational Choice Theory. University of Pittsburgh Press, Pittsburgh PA.
Brennan, G., Hamlin, A., 2000. Democratic Devices and Desires. Cambridge University Press, Cambridge U.K.
Dhillon, A., Peralta, S., 2002. Economic theories of voter turnout. Economic Journal 112, F332-F352.
Downs, A., 1957. An Economic Theory of Democracy. Harper and Row, New York NY. Gagliarducci, S., Nannicini, T., Naticchioni, P., 2011. Electoral rules and politicians’ behavior: A micro test. American Economic Journal: Economic Policy 3, 144-174.
Hall, R.E., Jones, C.I., 1999. Why do some countries produce so much more output per worker than others? The Quarterly Journal of Economics 114, 83-116.
Hamlin, A., Jennings, C., 2011. Expressive political behaviour: Foundations, scope and implications. British Journal of Political Science 41, 645-670.
Heckman, J.J., 1978. Dummy endogenous variables in a simultaneous equation system. Econometrica 46, 931-959.
ACCEPTED MANUSCRIPT
27
Husted, T.A., Kenny, L.W., 1997. The effect of the expansion of the voting franchise on the size of government. Journal of Political Economy 105, 54-82.
Jackman, R.W., 1987. Political institutions and voter turnout in the industrial democracies. American Political Science Review 81, 405-424.
Lijphart, A., 1997. Unequal participation: democracy’s unresolved dilemma. American Political Science Review 91, 1-14.
Lijphart, A., 2001. Democracy in the 21st century: can we be optimistic?. European Review 9, 169-184.
Lizzeri, A., Persico, N., 2001. The provision of public goods under alternative electoral incentives. American Economic Review 91, 225-239.
Milesi-Ferretti, G.M., Perotti, R., Rostagno, M., 2002 . Electoral systems and public spending. The Quarterly Journal of Economics 117, 609-657.
Mueller, D.C., Stratmann, T., 2003. The economic effects of democratic participation. Journal of Public Economics 87, 2129-2155.
Persson, T., Roland, G., Tabellini, G., 1997. Separation of powers and political accountability. The Quarterly Journal of Economics 112, 1163-1202.
Persson, T., Roland, G., Tabellini, G., 2007. Electoral rules and government spending in parliamentary democracies. Quarterly Journal of Political Science 2, 155-188.
Persson, T., Tabellini, G., 2000. Political Economics: Explaining Economic Policy. MIT Press, Cambridge MA.
Persson, T., Tabellini, G., 2003. The Economic Effects of Constitutions. MIT Press, Cambridge MA.
Persson, T., Tabellini, G., 2004. Constitutional Rules and Fiscal Policy Outcomes. American Economic Review 94, 25-45.
Powell, B.G., 1982. Contemporary Democracies: Participation, Stability and Violence. Harvard University Press, Cambridge MA.
Seddon Wallack J., Gaviria, A., Panizza, U., Stein, E., 2003. Particularism around the world. World Bank Economic Review 17, 133-143.
Sondheimer, R.M., Green, D.P., 2010. Using experiments to estimate the effects of education on voter turnout. American Journal of Political Science 54, 174-189.
Stepan, A., Skach, C., 1993. Constitutional frameworks and democratic consolidation: Parliamentarianism versus presidentialism. World Politics 46, 1-22.
![Table 2: Determinants of voter turnout. [1]](https://thumb-us.123doks.com/thumbv2/123dok_us/1485891.688501/10.595.68.528.83.594/table-determinants-voter-turnout.webp)
![Table 4: Determinants of voter turnout. Instrumental variable analysis. [1] [2] [3] [4]](https://thumb-us.123doks.com/thumbv2/123dok_us/1485891.688501/15.595.70.530.80.713/table-determinants-voter-turnout-instrumental-variable-analysis.webp)