Accelerated Aging of the M74A1 Simulator By Dr. Eric R. Bixon
U.S. Army TACOM\ARDEC Picatinny Arsenal, NJ 07806-5000
ABSTRACT
This paper addresses the storage requirement, shelf life and the reliability of the M74A1 Simulator. Experimental conditions have been determined and the data analysis has been completed for the accelerated testing of the system. A method for evaluation of shelf life of the M74A1 as a function of the storage time, temperature and relative humidity is presented.
BACKGROUND
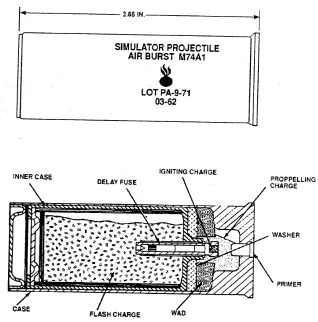
The M74A1 is a projectile air burst simulator. It has a one-piece aluminum case and resembles a shotgun shell. The case contains a percussion primer mounted in the base, a black powder propelling charge, a delay fuze, and an inner case containing a flash charge. The simulators are fired from a pyrotechnic pistol. The firing pin of the pistol strikes the primer that ignites the propelling charge. The propelling charge expels the self-contained flash charge from the case while igniting the igniting charge. The igniting charge contains a delay fuze that burns in two to three seconds. At 45 degrees
elevation, the height of burst is about 100 feet.
It is shown in Figure 1. In this paper experimental data are presented in which the aging process has been accelerated. The experimental data have been acquired at temperatures ranging from 200 to 260 °F and .4% to 85% relative humidity.
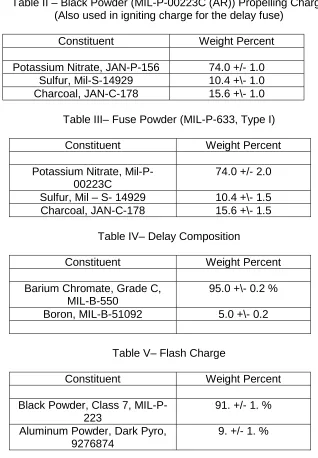
M74A1 Subassembly Chemical Compositions
The chemical compositions of each of the subassemblies used in the M74A1 are shown in Tables I through V. There are many ingredients sensitive to heat and moisture including black powder and Boron. The primer mixture, itself, may be vulnerable to degradation. In general, the compositions contain fuels and oxidizers. In an experimental procedure such as the one used in this investigation, the exact
subassembly that caused the item to fail cannot be determined. Individual subassembly accelerated aging functional tests would have to be done to determine the failure
Figure 1. M74A1 Simulator Cutaway View .
Table I – Primer Mixture for M39A1 Percussion Primer
Constituent Weight Percent
Potassium Chlorate Technical Grade A, Class 2, MIL-P-150
37.05 +/- 2. % Lead Thiocyanate (Sulphocyanate), JAN-L-65 38.13 +/- 2.0 % Trinitrotoluene (TNT), Type I, Mil-T-248 5.69 +/- 0.5 %
Barium Nitrate, MIL-B-162 8.68 +/- 1. %
[image:2.612.111.526.496.610.2]Table II – Black Powder (MIL-P-00223C (AR)) Propelling Charge (Also used in igniting charge for the delay fuse)
Constituent Weight Percent
[image:3.612.146.464.76.534.2]Potassium Nitrate, JAN-P-156 74.0 +/- 1.0 Sulfur, Mil-S-14929 10.4 +\- 1.0 Charcoal, JAN-C-178 15.6 +\- 1.0
Table III– Fuse Powder (MIL-P-633, Type I)
Constituent Weight Percent
Potassium Nitrate, Mil-P-00223C
74.0 +/- 2.0 Sulfur, Mil – S- 14929 10.4 +\- 1.5 Charcoal, JAN-C-178 15.6 +\- 1.5
Table IV– Delay Composition
Constituent Weight Percent
Barium Chromate, Grade C, MIL-B-550
95.0 +\- 0.2 % Boron, MIL-B-51092 5.0 +\- 0.2
Table V– Flash Charge
Constituent Weight Percent
Black Powder, Class 7, MIL-P-223
91. +/- 1. % Aluminum Powder, Dark Pyro,
9276874
9. +/- 1. %
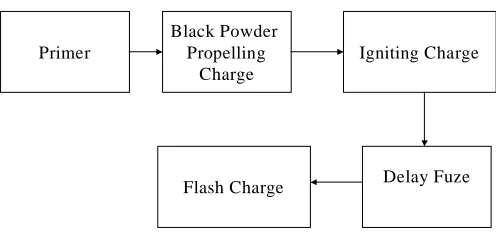
M74A1 Reliability Block Diagram
Primer
Black Powder Propelling
Charge
Igniting Charge
Delay Fuze
[image:4.612.140.388.100.216.2]M74A1 Reliability Block Diagram Flash Charge
Figure 2. M74A1 Reliability Block Diagram Degradation Mechanisms
The degradation mechanisms can only be deduced from the probable reactions based on known chemical properties of the ingredients and components. For example, the room temperature decomposition of Barium Chromate can release a small amount of oxygen into the system. The room temperature decomposition of Barium Chromate starts at as low as 60 ºC. However, even at 1015 ºC the weight loss is less than 1.0 weight percent (AMCP 706-187). Another source of oxygen is the air.
Any fuels that come in contact with oxygen will undergo some oxidation. Surface oxidation will in general make the fuels less reactive. In the case of a delay (which is already a slow burning mixture) oxidation of the boron can cause failure.
EXPERIMENTAL Raw Data
TableVI. Experimental Reliability Data for the M74A1 Temperature
(°F)
Relative humidity
exposure time (days)
Dud Rate
200 85% 9 0/10
200 85% 20 10/10
200 85% 30 7/10
200 85% 40 9/10
200 85% 50 10/10
200 85% 60 6/10
200 85% 70 14/15
200 85% 81 15/15
220 85% 5 0/4
220 85% 10 0/4
220 85% 15 0/4.
220 85% 21 1/4
240 50% 6 1/4.
240 50% 10 2/4.
240 50% 15 4/4.
240 50% 20 3/4.
220 50% 6 0/4
220 50% 9 0/4
220 50% 15 0/4
220 50% 20 1/4.
260 .4% 12 4/4
260 .4% 16 4/4.
260 .4% 21 4/4.
*Data at 220 ºF (50% RH and 85% RH) were combined and are reported as 220 ºF and 67.5% RH. Data at 260 ºF and 21 days was not used in the maximum likelihood
estimation of the distribution parameters. Data Analysis Methodology
The data analysis methodology uses applied life data analysis (Nelson, 1990, 1982) to estimate the service life of the M74A1 based on the experimental data. Data must be available at a number of temperature and relative humidity conditions for accurate life prediction. In this study the data were available at four temperature/humidity conditions.
Modeling of Data
The lognormal cumulative distribution function for the population fraction failing by age y is
F(y,T,%RH) = Φ { [ln(y) - µ(T,%RH)]/σ}, y>0 (1)
the log standard deviation. Note that the failure distributions determined in this study are a function of temperature and relative humidity as are the log means.
Since the data are time censored (samples are pulled out at certain times), maximum likelihood methods are used to estimate the parameters in the lognormal probability distributions from the data. These solutions are approximate for time-censored data and exact for failure-time-censored data. A summary of the log means and standard deviations obtained in this experiment is shown below in Table VII
Table VII. Maximum Likelihood Results for the Log means, log standard deviations and medians at each test temperature and relative humidity for the M119
Temperature (T) and % RH
Log Mean
µ(T,%RH)
Log Standard Deviation (σ)
Median Life (τ.50) in
days
200 °F – 85.0% RH 3.933 .4791 51.041
220 °F – 67.5% RH 3.056 .0351 21.252
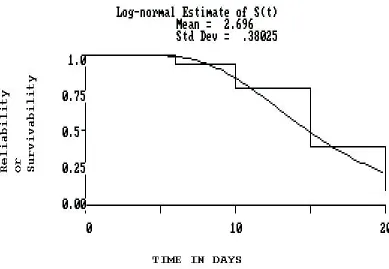
240 °F – 50.0% RH 2.697 .3802 14.832
260 °F – 85% RH 2.628 .1438 13.856
The survival function, reliability function and the cumulative distribution function at a particular temperature and humidity are related by the equation below:
R(y) = S(y) = (1 – F(y)) (2)
Figure 3. Survivability (reliability) of the M74A1 at 50 % Relative Humidity and 240 degrees F. Failure data was modeled using a lognormal distribution. Parameters have been estimated using maximum likelihood techniques.
Eyring Equation for correlation of the log means with temperature and humidity
A form of the Eyring equation is used to correlate the log means of each failure distribution with temperature and humidity. The equation is shown below:
µ(T,%RH) = A’ + EA/T + B∗(%RH) (3)
In equation (3) µ(T,%RH) is the log mean at temperature, T, and T is the
absolute temperature in Rankine and %RH is the relative humidity at temperature T. A’, EA and B are constants. The median service life at 70 °F is calculated by exponentiation
of equation (3):
(τ.50) = exp {µ(T,%RH)} (4)
Substitution of equation (3) into equation (4) results in the expression for (τ.50), the
median service life:
In equation (5) the symbol A has been used to represent exp (A’). The values of A, EA, and B in equation (5) are obtained by non-linear regression using a Marquardt
algorithm. The values of these parameters are shown in Table VIII.
Table VIII Estimated parameters for the M74A1 for Equation (5)
A 3.281e-012 days
EA 20855 Rankine
B -.015018 /%RH
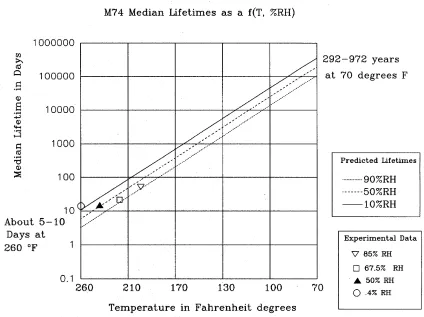
Substitution of the parameters in Table VIII into Equation (6) results in the estimate of the median service life at 70 °F and 10 % RH. This estimate is 354,701 days or about 971.8 years. A plot of Equation (5) for 10, 50 and 90 % RH is shown in Figure 4.
In Figure 4 the median lifetime is on the ordinate (y axis) and temperature on the abscissa (x axis). The three lines represent the predicted lifetimes at three values of the relative humidity. The longest lifetime (top line) corresponds to the 10 % RH condition. As can be seen, even a 100 ºF increase in temperature (170 °F and 10% RH) results in a dramatic shortening of the lifetime to about 683 days. Although the humidity effect exists, the degradation is primarily temperature driven. The experimental data points are also shown. Note that the experimental data fit nicely on the predicted lines.
SUMMARY
Figure 4. Plot of the Median Lifetimes of the M74A1 as a function of temperature and humidity.
FUTURE WORK
In order to estimate the experimental error variance in this type of methodology it is desirable to repeat the experiment. This would supply a statistical measure of the variance associated with the predicted lifetimes. Detailed theoretical failure mechanisms for each component can be further developed using chemical reactions and physical modeling (burn rate models, heat transfer and other techniques) to model potential degradation mechanisms. Experiments could be designed to validate these failure mechanisms. Data for each of the components in Figure 2 could be obtained by
accelerated aging of the individual components. The results can be used to develop new designs for the M74A1 that are not so temperature sensitive and which have enhanced reliability and storage life.
REFERENCES
1. Nelson, Wayne, (1982), Applied Life Data Analysis, John Wiley & Sons, New York
2. Nelson, Wayne, (1990), Accelerated Testing, John Wiley & Sons, New York 3. AMCP 706-187, (1963),Military Pyrotechnics Series, Part Three-Properties of
ACKNOWLEDGEMENTS