Munich Personal RePEc Archive
Do partial disability pensions close the
earnings gap?
Cueto, Begona and Miguel Á., Malo
University of Oviedo, University of Salamanca
May 2014
Online at
https://mpra.ub.uni-muenchen.de/55920/
1
Do partial disability pensions close the earnings gap?
Begoña Cueto (Universidad de Oviedo, Spain)* Miguel Á. Malo (Universidad de Salamanca, Spain)
Abstract:
In this article, we estimate the total earnings losses of male workers with a partial disability, i.e., they are able to work in a different occupation after disability onset. We use a Spanish administrative dataset (Muestra Continua de Vidas Laborales) from a specific partial disability pension scheme (Incapacidad Permanente Total). Using propensity score estimators combined with difference-in-differences, the estimation of the causal effect of
the disability onset shows earnings losses to be approximately €400 per month for the first
two years. For male workers over 54, total earnings losses are greater even though they receive greater benefits.
Keywords: disability pensions; earnings losses; older workers.
JEL Classification: H55, H24, J14
Version: May 19th, 2014 * Corresponding author:
Begoña Cueto
Department of Applied Economics Faculty of Economics
University of Oviedo Campus El Cristo 33006 Oviedo, Spain Tel.: (+34) 985104996 Fax: (+34) 985103780 e-mail: [email protected]
2
1
Introduction
There is vast international literature regarding the participation in the labour market of
people with disabilities. The literature is mainly focused on the adverse effects of income
transfers on the participation of older workers in the labour force. The seminal article in this
literature is Parsons (1980). His study finds that disability pensions may account for the
decrease in labour force participation of older men registered in the US. Later, Bound and
Burkhauser (1999) review a number of studies and conclude that disincentive effects to
work exist and that it is highly likely that Parsons’s estimates are overestimated.
However, much less information is available about the effect of disability pensions on
subsequent earnings (Charles, 2003; Mok et al., 2008). With respect to the US case,
Stapleton et al. (2009) show that workers’ economic well-being declines after disability
onset, as the disability pension system does not maintain the disabled household’s pre-onset
income. The reasons for this are twofold. One, disabled persons have lower labour market
participation rates, and two, benefits partially replace lost earnings. A similar conclusion
emerges from a German case. In a broader analysis of the effects of health shocks on
income, Riphahn (1999) finds that benefits do not fully insulate against the negative
consequences of the potential loss in earnings.
The scarce literature on earnings losses does not tackle the specific case of partial
disability. By partial disability, we mean that the severity of the disability does not prevent
the worker from working, but it usually requires a drastic change in occupation, industry, or
both. This article evaluates the causal impact of partial disability on total earnings by
3
pension. We use data from a Spanish contributory pension scheme for partially disabled
workers1. According to the Spanish Social Security, the totalpermanent disability for usual
occupation (henceforth, TPD) is a disability that limits the worker from performing all of
the main tasks in their profession, although they may still be able to pursue a different
occupation. We focus on this disability benefit because it is fully compatible with
performing another job in a different occupation after the onset of the disability. There are
other disability pensions, but they almost completely restrict the ability to work.
Accordingly, these other disability pensions are designed for much more severe
disabilities2. In Spain, over 500,000 people were entitled to a partial disability pension
(TPD) in 2013, while over 400,000 people were beneficiaries of other types of disability
pensions as their disabilities severely restricted compatibility with work.
The TPD explicitly attempts to compensate the negative welfare impact of the disability
onset by providing a pension even though these individuals can perform a job (albeit
different from their previous job due to a negative health shock). Our analysis adds to the
international literature evaluating whether this partial disability pension closes the earnings
gap. To our knowledge, this is a novel study in the international literature, as previous
evidence analysing the TPD scheme has strictly focused on the impact of TPD on labour
market participation. Benitez-Silva et al. (2010) note that during recession periods, all
disability benefits (including TPD) have been used as an excuse for early retirement of
low-skilled older workers. Marie and Vall Castello (2012) studied the effects of an increase in
the partial disability pension of workers over 54 years of age and obtained a decrease in the
1
A brief summary of the Spanish legislation on permanent disability is provided in the Appendix.
2
4
likelihood of employment of 8%, which is mainly the result of income effects3. Regardless,
the impact of the partial disability scheme on total earnings remains unknown.
Our empirical methodology follows the recent literature on the earnings losses of displaced
workers. For example, Couch and Placzeck (2010) use propensity score matching
techniques to estimate, as usual, the average treatment effect on the treated (ATT), but in
addition, they also apply differences-in-differences (DID) so that unobserved heterogeneity
may be controlled. Accordingly, the combination of both types of estimations allows for the
control of observed and unobserved heterogeneity.
2
Database: total earnings and career trajectory
Our dataset is the Muestra Continua de Vidas Laborales (MCVL), i.e., Continuous Sample
of Working Lives, an administrative database provided by the Spanish Social Security that
is freely available for independent researchers4. It includes information about contributory
pensions and social security records for people who either hold a job or receive benefits in a
given year as well as their entire career trajectory.
As summarised in Figure A.1, we focus on male workers entitled to a TPD in either 2005 or
20065. We have obtained information about their previous employment spells and their
contributory bases, which are a good proxy for monthly wages6. Our sample consists of
3
Autor and Duggan (2007) explain how substitution and income effects can discourage the return to work. The substitution effect means that the return to work leads to a benefit reduction, while the income effect means that some beneficiaries may prefer leisure to work, even though work is not taxed by the program. The authors found that income effects may account for a significant part of the reduction in labour force participation after the award of disability benefits in the US.
4
Interested researchers can apply for this dataset at the following address: http://www.seg-social.es/Internet_1/Estadistica/Est/Muestra_Continua_de_Vidas_Laborales/index.htm
5
We focus on workers registered with the general social security system. Self-employed workers, agricultural workers and seamen have their own specific disability pension schemes.
6
5
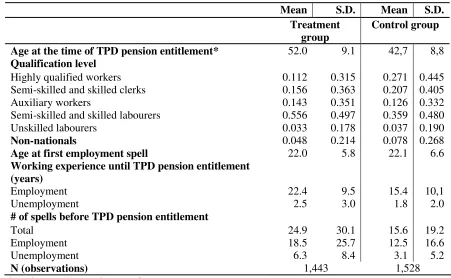
1,443 males, who were mostly low- and medium-skilled workers with a mean age of 52
(see Table A.1). They entered the workforce at age 22, worked for 22.4 years on average
and were unemployed for 2.5 years during their former working lives.
Finally, we followed them in 2007, 2008 and 2009. Therefore, we know whether they
returned to work or not, and if they did, we have their contributory bases. As we also have
information on the TPD amount, we calculate the total income of those both earning a wage
and receiving simultaneously a partial disability pension. Henceforth, we will refer to
earnings as the total income (wages and/or TPD pensions).
Figure 1 shows the average monthly earnings of TPD workers from 36 months prior to
pension entitlement to 24 months after entitlement. Three years before entitlement, the
average monthly wage is €1,500. There is a decline in monthly wages as early as 18 to 20
months before pension entitlement, and they decline sharply, by approximately 3 to 6
months before receiving their pension. When the worker obtains the TPD pension, their
earnings are approximately 25% of their wages 2 years prior. These results are quite similar
to those shown in Bound et al. (2003) for the US case7.
The reasons for the earnings decline before the pension entitlement are likely related to
health status, adaptation to disability, long administrative procedures8 and the effectiveness
of medical treatment.
<<Figure 1>>
7
They analyse labour earnings of SSDI and SSA applicants before and after the application and show that labour earnings decline 12 to 24 months prior to application and fall severely 6 months before application.
8
6
Figure 1 shows that, on average, once workers are entitled to the TPD, their earnings
remain stable at a lower level than their pre-decline wages, i.e., approximately €1,000.
Although the majority of participants in the program are older workers, age remains a
significant variable for our analysis because it affects the amount of the benefit. As we
explain in the Appendix, the size of the pension depends both on the years of work
experience and on the age of the beneficiary (notice that there is a threshold of 55 years of
age). Obviously, labour trajectory is different for older workers than for younger workers.
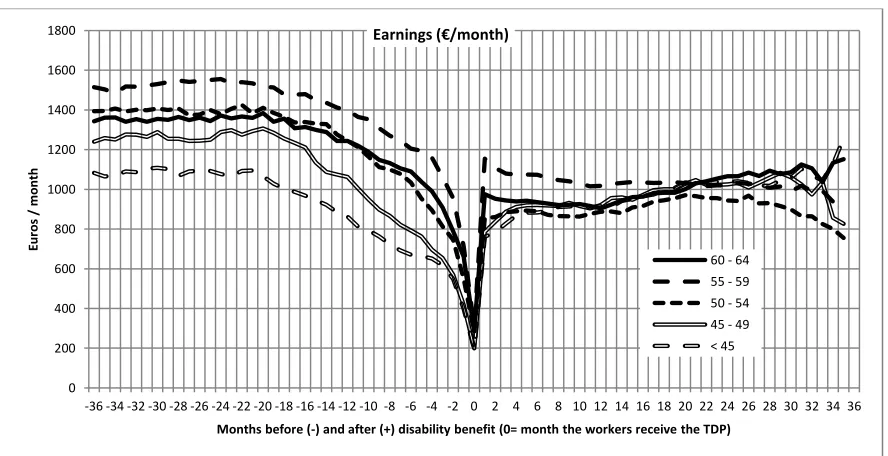
Figure 2 shows the average monthly earnings of TPD workers by age group. Before
entitlement, workers under 50 years of age have the lowest earnings, while those between
55 and 60 have the highest earnings. With respect to earnings after TPD, there are small
differences among groups. Presumably, this is the result of two opposite effects. On the one
hand, there are differences in wages before the disability onset leading to differences in the
pension amounts. Therefore, older workers obtain higher pensions because of the positive
correlation of age, labour market experience and wages. On the other hand, the likelihood
of re-employment after the onset of the disability is higher for younger workers, increasing
total earnings, although they receive a relatively lower pension because of their shorter
labour market experience.
<<Figure 2>>
3
Empirical methodology
We aim to estimate the earnings losses due to TPD. Accordingly, we have defined a
7
group does not include persons receiving at any time early retirement pensions or any type
of disability pension. As in the treatment group, male workers of the control group are
included in the general regime of the Spanish Social Security. Therefore, we are not
considering self-employed workers, agricultural workers, domestic workers, seamen,
miners or civil servants.
Even though the database contains very detailed information on working lives, there is no
direct information on health status, and hence, unobserved heterogeneity may bias our
estimations. We have capitalised on the longitudinal nature of the data to combine
propensity score matching (PSM) and difference-in-differences estimation techniques. This
identification strategy allows us to control for observable and unobservable factors.
According to Smith and Todd (2005), “a difference-in-differences (DID) matching strategy
allows for temporally invariant differences in outcomes between participants and
nonparticipants”, and therefore, this type of estimator is more robust. On the other hand,
PSM relies on a conditional independence assumption (CIA), which means that once the
propensity score has been estimated, participation in the program is independent of
outcome in the non-participation status. This requires that all variables affecting
participation and outcome in the non-participation status be matching (Smith, 2000).
Considering the outcome of the treated (YD) and non-treated people (YD), a set of
observable variables (X) and the treatment status (d), Rosenbaum and Rubin (1983, 1984)
prove that if (YC,YD)d X and 0 <P(X)< 1, given P(X)Pr(d 1 X), then
) ( )
,
(YC YD dP X . The outcome is similar for treated and non-treated individuals
8
The conditional independence assumption (CIA) YD,YC X means that once the
propensity score has been estimated, participation in the program is independent of
outcome in the non-participation status (YC). If the CIA holds conditional on X, it will also
hold conditional on the propensity score,YD,YC p(X).
Under these assumptions, the matching estimator takes the following form (Blundell and
Costa Dias, 2002):
̂ ∑ ( ∑
)
where is the weight placed on comparison observation j for individual i and
accounts for the reweighting that reconstructs the outcome distribution for the treated
sample.
The CIA is very difficult to assess, particularly in this case, as the data about health status
are non-existent. Heckman et al. (1998) propose a combination of matching and
difference-in-differences that allows us to control for selection from observed and unobserved
variables. Using longitudinal data, we can estimate the effect of the treatment in the
following way (Blundell and Costa Dias, 2002):
̂ ∑ ( ∑
9
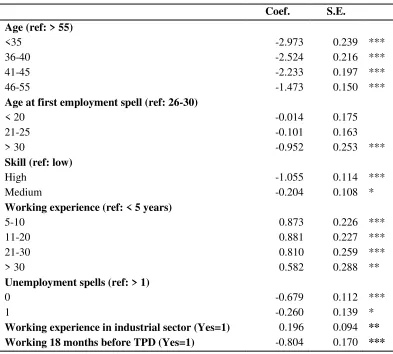
The balancing property must be satisfied for PSM to be applicable, i.e., all of the variables
in the estimation must be balanced between treated and control individuals9. The
explanatory variables included in the propensity score estimation are age, age at the
beginning of the first employment spell, skill level, years of working experience until the
TPD, number of unemployment spells before the TPD, work experience in the industrial
sector, employment 18 months prior to TPD, and region of residence. Table A.2 in the
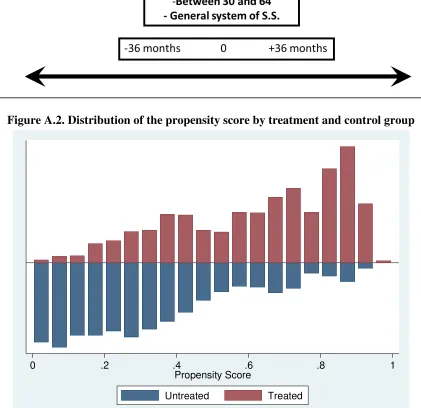
Appendix shows the results for the probit estimation of the propensity score. All of the
estimates that satisfy the balancing property are obtained through nearest neighbour
matching10. In addition, as we have exclusively used observations in the common support,
only observations in the control group with the same range of propensity score in the
treatment group are included in the estimations11.
As previously explained, the CIA is very difficult to assess because direct information on
health status is not included in our dataset. Nevertheless, as we have longitudinal data, we
can overcome this shortcoming by combining matching (i.e., estimations of average effect
of the treatment on the treated) and difference-in-differences with the 24th month before
entitlement and then controlling by unobserved heterogeneity, for example, health status.
Our assumption is that earnings trends would be the same in both groups in the absence of
treatment. This treatment (the permanent disability) induces a deviation from the common
trend that is captured by the difference-in-differences approach (Couch and Placzek, 2010).
9
We used the Stata commands developed by Becker and Ichino (2002) to calculate propensity score models and check the balancing properties.
10
In any case, we also used other matching algorithms to estimate the effect of the treatment and the results remain. These estimations are available upon request.
11The common support assumption requires that, for each “treated” worker, there is another “non-treated”
10
4
Empirical results and discussion
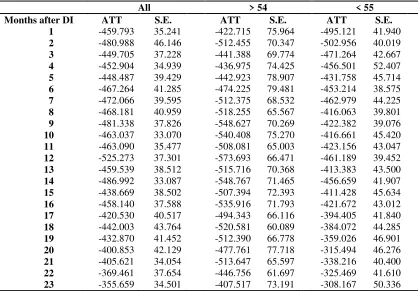
Table 1 shows the results of applying difference-in-differences on the average effect of the
treatment on the treated. The estimated impact is negative, showing a permanent decrease
in earnings with respect to two years before being entitled to the TPD (t0), a period in which
the disability has yet not had any effect on earnings, as explained in the descriptive
analysis.
The size of the earnings losses is considerable and remains relatively stable over time.
Earnings losses are approximately €450 per month for the first year after the TPD
entitlement; there is then a small decrease at the beginning of the second year, and by the
end of the second year after entitlement, losses are below €400.
<<Table 1>>
As explained in the Appendix, for workers over 54 years of age, the disability pension
increases from 55% to 75% of the regulatory basis, which is closely tied to previous wages.
Therefore, we also estimated the total earnings losses of male workers under and over the
age threshold (see Table 1). For the first 6 months after the TPD entitlement, earnings
losses are quite similar for both age groups, with a decrease in earnings of approximately
€450 monthly. In the second year after the TPD entitlement, earnings losses for workers
over 54 increase by up to €500 per month, while the losses for workers below 55 remain
stable or even decrease slightly. As a consequence, there is a widening earnings gap for
11
who are under 55. At the end of second year after the TPD entitlement, there is a slight
increase in earnings losses for workers over 54 and a significant decrease in earnings losses
for those under 55; the earnings losses are €407 and €308, respectively. Therefore, the
earnings gap between both groups widens over time, mainly because earnings losses of
workers under 55 decrease by as much as €300 per month.
Accordingly, there is a significant permanent earnings loss, on average, after the TPD
entitlement. Presumably, these earnings losses are linked to three facts: the increasing trend
in wages of the control group, the flat shape over time of the TPD pension (defined as a
percentage of past wages) and the re-employment behaviour after receiving a TPD pension.
The first, the increasing trend in wages for the control group, suggests the relevance of the
break in one’s working career that is usually linked to a new disability (i.e., a negative
health shock). Those not suffering such a negative health shock do not incur any loss of
specific human capital, and on average, they follow an improving trend as they increase
their work experience. This is not the case for people entitled to a TDP pension, however.
Even when obtaining a job after entitlement, it is presumed that previous work experience
will not be useful as the individual typically must change occupations.
The second fact, the flat shape over time of the TPD pension, indicates that earnings from
the TPD pension remain stable. The amount of the pension is strictly linked with past
wages (see Appendix for details) and does not increase over time (unless the individual
attains the age of 55 and is still without employment).
The third fact, employment behaviour after receiving a TPD pension, is related to the
re-employment probability of those entitled to a TPD pension. At a descriptive level, Malo et
al. (2011) finds that, as of 2006, the rate of TPD workers who are employed is
12
workers with a disability is 11.6% in 2007 (using a slightly different calculation
methodology). Therefore, the beneficiaries of a TDP pension exhibit a relatively low
employment rate. Is this caused by the amount of the TDP pension? Marie and Vall
Castelló (2012) use the increase in the amount of the TDP pension at 55 years of age as a
natural experiment to estimate the causal impact of this increase on the probability of
employment. Their results show that this change decreases employment probability of
beneficiaries by 8%. Similarly, Malo et al. (2011) have shown that in Spain, the likelihood
of returning to work for those receiving a TPD pension decreases as age increases.
The estimated earnings losses are large enough to assume that they will have a negative
impact on the welfare of TPD beneficiaries. What are the policy options to close the
earnings gap?
The first fact suggests that it is important to implement an intervention at the same time, or
just after, one becomes eligible to receive the TPD pension, as this would facilitate
re-employment. Rehabilitation programmes and specific counselling regarding labour market
integration for these workers would also be highly beneficial. Although these interventions
do exist in Spain, the current earnings gap indicates that they are not sufficient as they have
not alleviated the problem.
The second and third facts call for an increase in the amount of the TPD pension to close
the earnings gap, especially for workers over 54 years of age. However, the income effects
of such an increase, as found by other authors, emphasise the negative incentives to return
to work. Therefore, policy interventions, such as specific rehabilitation programmes and
specialised labour market intermediation, seem to be a preferable option. Furthermore,
these policies should be especially intense and adapted for older workers above 54 because
13
“the payoff for doing so is fairly minor. In most cases, the effort will yield only a few years
of earnings and is not likely to make a major change in retirement income” (Yčas, 1996:
173).
Our analysis of the two age groups (see Table 1) is coherent with the above
recommendations. Because workers over 54 years of age have seniority and receive higher
wages, their benefits are also generally higher. Moreover, their benefits are calculated as
75% of the regulated base rather than the 55% that workers under 55 years of age receive.
Despite these favourable conditions, earnings losses are clearly greater for older workers.
On the other hand, while younger workers have a lower pension, they also experience a
lower level of permanent earnings losses. For this group, specific policy interventions may
also be essential, but the incentives still favour participation in the labour market as they
have a longer horizon ahead to obtain wages and higher retirement pensions in the future.
Thus, the most realistic option for closing the current permanent earnings gap is to facilitate
re-employment after the TPD entitlement. Active measures seem to be the best candidates
to accomplish this challenge.
Finally, as a robustness check, we estimated the same model using annual data from the
salary payments rather than the contributory base. These data also come from the MCVL,
which includes tax data from the National Revenue Agency. The advantage of this fiscal
information is the inclusion of total personal earnings (with no minimum or maximum
thresholds, as in the case of contributory bases). However, the weakness is that because we
14
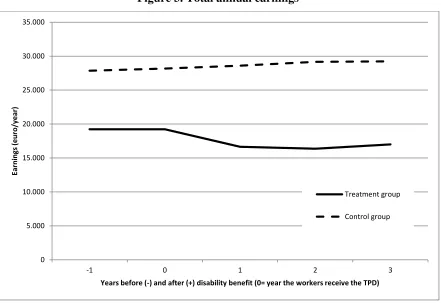
Figure 3 supports the same conclusions as those of the previous analysis. In other words,
there is an earnings gap between the control and the treatment group that increases after the
TPD entitlement.
The estimations with DiD-PSM are consistent with the above findings. There is a decrease
in annual earnings of 3,000 euro during the first year after accessing the TPD pension, and
this increases to 4,800 euro two years later and 4,300 euro three years later. Separately
estimating the effect for workers over 54 and under 55 years of age, we again find that the
decrease in total earnings is higher for older workers.
Therefore, the annual information confirms the results obtained using monthly data.
<<Figure 3>>
5
Conclusions
Disability pensions are income transfers programmes that attempt to alleviate the earnings
decrease related to the difficulties of finding a suitable job after the onset of a disability.
The majority of the previous literature has focused on the negative impact of these types of
programmes on the incentive to return to work.
However, evaluating the main objective of such programmes, that is, whether they close the
total earnings gap or not, remains unexplored. Thus, this has been the objective of this
research. We have focused on a specific type of disability pension (TPD or total permanent
disability, in Spanish, Incapacidad Permanente Total) of the Spanish Social Security. The
TPD is for workers who have become partially disabled, but can still work, although the
work would be in an occupation different from their pre-disability work. In other words,
15
We have used an administrative dataset that provides longitudinal information on wages
and pensions as well as the full employment history of all individuals. We have defined a
treatment and a control group. The treatment group consists of male workers entering the
TPD pension in 2005 or 2006, while the control group corresponds to fully comparable
male workers. The econometric strategy combines propensity score matching and
difference-in-differences. The PSM estimates the impact of the programme conditioned on
observable variables, while the DiD controls for unobserved heterogeneity, such as the
health status of individuals, which is not directly observable in our dataset.
The descriptive analysis shows a decline of earnings even 18 months before the TPD
pension entitlement and a sharp decrease approximately 6 months before the entitlement.
On average, while there is a partial recovery of this decrease, a significant earnings gap
remains up to two years following entitlement. The estimation of the causal effect of the
TPD shows a significant earnings gap for male workers entitled to the TPD. This gap is
approximately 400 euro per month two years after pension entitlement. When estimating
separately for workers under and over 54 years of age, earnings losses for the oldest
sub-group are greater, even though they receive greater benefits.
Therefore, the main objective of this policy is only partially satisfied. The TPD partially
closes the earnings gap with respect to those not suffering this type of negative health
shock. However, a significant earnings differential remains in the long-term.
The policy options to close this earnings gap and improve the well-being of these workers
include increasing the amount of the TPD pension and developing additional interventions
that are aligned with active labour market policies.
Previous empirical literature shows that increasing the amount of the TPD pension has a
16
years of age. Active policies, such as rehabilitation programmes and specialised labour
market counselling, may increase the re-employment probabilities of these workers without
introducing negative incentives to work. However, more intense and/or adapted
programmes should be implemented for workers over 54 years of age, as they not only
suffer a larger earnings gap even after receiving higher benefits, but they also face more
challenges to return to work after becoming disabled.
On the other hand, if young workers with partial disability return to employment, they have
the opportunity to increase their wages over their expected longer working life and thereby
contribute to larger retirement pension. The higher employment rates of disabled workers
under 55 years of age suggest that they may maintain their earnings (i.e., economic
well-being) at a similar level as before the negative health shock.
The OECD (2007) advises that people with a partially reduced work capacity should not
leave the labour force permanently and that they should be supported as they seek to find an
appropriate job or to remain in their current job so their social inclusion and living
standards may be raised. Our results support that Social Security should both maintain
income support to workers with a partial disability and should encourage their employment
participation (for example, with specialised active labour market policies) to prevent the
17
References
Autor, D.H. and Duggan M.G. (2007): “Distinguishing income from substitution effects in
disability insurance”. American Economic Review, vol. 97 (2), pp. 119-124.
Becker, S.O. and Ichino, A. (2002): “Estimation of Average Treatment Effects Based on
Propensity Scores.” Stata Journal, vol. 2 (4), pp. 358–377.
Benitez-Silva, H., Disney, R. and Jimenez-Martin, S. (2010): “Disability, capacity for work
and the business cycle: an international perspective.” Economic Policy, Volume
25 (63), pp. 483–536.
Blundell, R. and Costa Dias, M. (2002): Alternative approaches to evaluation in empirical
microeconomics. Centre for Microdata Methods and Practice, working paper
CWP10/02.
Bound, J. and Burkhauser, R.V. (1999): “Economic analysis of transfer programs targeted
on people with disabilities”. In Ashenfelter, O.C. and Card, D. (eds.): Handbook of
Labour Economics, vol. 3C, pp. 3417-3527. Elsevier Science.
Bound, J. Burkhauser, R.V. and Nichols, A. (2003): “Tracking the household income of
SSDI and SSI applicants.” Worker well-being and public policies. Research in Labour
Economics, vol. 22, pp. 113-158.
Charles, K.K. (2003): “The longitudinal structure of earnings losses among work-limited
disabled workers: age of onset effects and adjustment”, Journal of Human Resources,
vol. 38(3), pp. 618-646.
Couch, K.A. and Placzek, D.W. (2010): “Earnings Losses of Displaced Workers
18
Malo, M.A., Cueto, B. and Rodríguez, V. (2011): “Compatibilidad entre pensiones
contributivas por incapacidad y empleo: el caso español”, Cuadernos de Relaciones
Laborales, vol. 29 (1), pp. 52-78.
Marie, O. and Vall Castello, J. (2012): “Measuring the (income) effect of disability
insurance generosity on labour market participation”. Journal of Public Economics, vol.
96, pp. 198–210.
Mok, W.K.C., Meyer, B.D., Charles, K.K. y Achen, A.C. (2008): “A note on ‘The
longitudinal structure of earnings losses among work-limited disabled workers’”.
Journal of Human Resources, vol. 43(3), pp. 721-728.
OECD (2007): “New ways of addressing partial work capacity. OECD thematic review on
sickness, disability and work”. Issues paper and progress report.
Parsons, D.O. (1980): “The decline of male labour force participation.” Journal of Political
Economy, vol. 88, pp. 117-134.
Riphahn, R.T. (1999): “Income and employment effects of health shocks. A test case for
the German welfare state.” Journal of Population Economics, vol. 12, pp. 363-389.
Rosenbaum, P.R. and Rubin, D.B. (1983): “The central role of the propensity score in
observational studies for causal effects”. Biometrika, vol. 70, nº 1, pp. 41-55.
Rosenbaum, P.R. and Rubin, D.B. (1984): “Reducing Bias in Observational Studies Using
Subclassification on the Propensity Score.” Journal of the American Statistical
Association, Vol. 79, pp. 516-524.
Smith, J. (2000): “A critical survey of empirical methods for evaluating active labour
19
Smith, J. and Todd, P. (2005): “Does Matching Overcome Lalonde’s Critique of
Nonexperimental Estimators?” Journal of Econometrics, vol. 125(1-2), March-April, pp.
305-353.
Stapleton, D.C., Burkhauser, R.V., She, P., Weathers II, R.R. and Livermore, G.A. (2009):
“Income security for workers. A stressed support system in need of innovation.” Journal
of Disability Policy Studies, vol. 19 (4), pp. 204-220.
Vall Castello, J. (2012): “Promoting employment of disabled women in Spain; Evaluating a
policy.” Labour Economics, vol. 19, pp. 82-91.
Yčas, M.A. (1996): “Patterns of Return to Work in a Cohort of Disabled-Worker
Beneficiaries.” In Mashaw, J.L., Reno, V. Burkhauser, R.V. and Berkowitz, M. (eds.):
Disability, Work and Cash Benefits. Kalamazoo, MI: W.E. Upjohn Institute for
20
Appendix. The permanent disability system in Spain
There are three levels of contributory pensions for permanent disability in Spain: total
permanent disability for usual occupation, absolute permanent disability and serious
disability12.
A serious disability is the most severe form of disability. It is permanent, and the individual
requires assistance from another person to perform daily activities, such as getting dressed,
moving, eating, and so on.
An absolute permanent disability is a disability that absolutely limits the worker from
performing the basic duties of any profession or trade.
A total permanent disability for usual occupation (TPD) is a disability that limits the
worker from performing the main tasks of his profession, although the individual is capable
of performing the tasks associated with a different profession. We focussed on the latter
because no other disability is compatible with performing a different job at either the same
or a different workplace13.
The eligibility requirements for a total permanent disability pension in Spain are as
follows14:
- The applicant must be either under 65 years of age at the time of the causal event
or the disability must be the result of an ordinary disease or a non-work related injury and
12
Here, we follow the translation into English of the Spanish legal terms included in the web page of the
Spanish Social Security:
http://www.seg-social.es/Internet_6/Trabajadores/PrestacionesPension10935/Incapacidadpermanen10960/RegimenGeneral/Gr ados/index.htm
13
The other two pensions do not prevent profit or non-profit activities being carried out. However, these activities should be in accordance to the legally recognised level of disability and not related with a change in the capacity to work. Otherwise, the claimant could be reassessed and downgraded to the total permanent disability category.
14
21
be unable to meet the admission requirements of the contributory retirement pension —i.e.,
15 years of contributions.
- The applicant must be affiliated with the Social Security System or be associated
with a similar legal program.
If the disability event is due to a work-related injury or an occupational illness, there are no
requirements with respect to previous contributions. In other cases (i.e., ordinary diseases
of life), a minimum contributory period applies depending on the age of the applicant.
In Spain, the Social Security administration is responsible for assessing, qualifying and
reviewing eligibility for contributory benefits related to permanent disability15.
The amount of the TPD benefit is calculated as 55% of the regulatory base (RB) with
regard to the cause of the disability. This percentage may increase to 75% for beneficiaries
over 55 years of age when they are unlikely to find employment in a different activity due
to a lack of overall or specialised training and as a result of the economic and employment
situations in the area of residence.
The calculation of the regulatory base varies depending on the cause of the permanent
disability as follows:
15
The Social Security webpage explains the process to obtain a permanent disability pension:
22
cause of permanent disability
Regulatory base
ordinary disease
112 * 24
1 96
25 1
25
i i I
I Bi Bi
BR
Bi: Contributory base in the i-month before the negative health shock. Ii: Inflation rate in the i-month before the negative health shock (i= 1, 2, …, 96).
Except if age < 52: RB= Bi /(number of months *1,1666)
non-work related injury
BR= Bi for 24-month continuous period (within the last seven years) /28
(if there is no 24-month continuous period, minimum bases for the 24 months before the TDP)
work-related injury or occupational disease
23
[image:24.612.95.516.177.585.2]Figure A.1. Sample selection
Figure A.2. Distribution of the propensity score by treatment and control group
0 .2 .4 .6 .8 1
Propensity Score
24
Table A.1. Descriptive statistics of the treatment and control groups
Mean S.D. Mean S.D. Treatment
group Control group Age at the time of TPD pension entitlement* 52.0 9.1 42,7 8,8
Qualification level
Highly qualified workers 0.112 0.315 0.271 0.445
Semi-skilled and skilled clerks 0.156 0.363 0.207 0.405
Auxiliary workers 0.143 0.351 0.126 0.332
Semi-skilled and skilled labourers 0.556 0.497 0.359 0.480
Unskilled labourers 0.033 0.178 0.037 0.190
Non-nationals 0.048 0.214 0.078 0.268
Age at first employment spell 22.0 5.8 22.1 6.6
Working experience until TPD pension entitlement (years)
Employment 22.4 9.5 15.4 10,1
Unemployment 2.5 3.0 1.8 2.0
# of spells before TPD pension entitlement
Total 24.9 30.1 15.6 19.2
Employment 18.5 25.7 12.5 16.6
Unemployment 6.3 8.4 3.1 5.2
N (observations) 1,443 1,528
* For the control group, the time reference is 2005.
25
Table A.2. Propensity score estimation (total sample)
Coef. S.E.
Age (ref: > 55)
<35 -2.973 0.239 ***
36-40 -2.524 0.216 ***
41-45 -2.233 0.197 ***
46-55 -1.473 0.150 ***
Age at first employment spell (ref: 26-30)
< 20 -0.014 0.175
21-25 -0.101 0.163
> 30 -0.952 0.253 ***
Skill (ref: low)
High -1.055 0.114 ***
Medium -0.204 0.108 *
Working experience (ref: < 5 years)
5-10 0.873 0.226 ***
11-20 0.881 0.227 ***
21-30 0.810 0.259 ***
> 30 0.582 0.288 **
Unemployment spells (ref: > 1)
0 -0.679 0.112 ***
1 -0.260 0.139 *
Working experience in industrial sector (Yes=1) 0.196 0.094 **
Working 18 months before TPD (Yes=1) -0.804 0.170 ***
Level of significance: * 10%; ** 5%; *** 1%
26
Figure 1. Total earnings
Source: MCVL (Muestra Continua de Vidas Laborales/ Longitudinal Sample of Working Lives) and authors’ calculations. Figure 2. Total earnings by age
Source: MCVL (Muestra Continua de Vidas Laborales / Longitudinal Sample of Working Lives) and the authors’
calculations. 0 200 400 600 800 1.000 1.200 1.400 1.600 1.800
-36 -34 -32 -30 -28 -26 -24 -22 -20 -18 -16 -14 -12 -10 -8 -6 -4 -2 0 2 4 6 8 10 12 14 16 18 20 22
E arni ng s (e ur o / m ont h)
Months before (-) and after (+) disability benefit (0= month the workers receive the TDP)
Control group Treatment group 0 200 400 600 800 1000 1200 1400 1600 1800
-36 -34 -32 -30 -28 -26 -24 -22 -20 -18 -16 -14 -12 -10 -8 -6 -4 -2 0 2 4 6 8 10 12 14 16 18 20 22 24 26 28 30 32 34 36
E ur o s / mo nt h
Months before (-) and after (+) disability benefit (0= month the workers receive the TDP)
Earnings (€/month)
[image:27.612.87.531.422.650.2]27
Figure 3. Total annual earnings
Source: MCVL (Muestra Continua de Vidas Laborales / Longitudinal Sample of Working Lives) and the authors’
calculations.
0 5.000 10.000 15.000 20.000 25.000 30.000 35.000
-1 0 1 2 3
E
arni
ng
s
(e
ur
o/y
e
ar)
Years before (-) and after (+) disability benefit (0= year the workers receive the TPD)
Treatment group
28
Table 1. DID-PSM results: difference in monthly earnings (Euro)
All > 54 < 55
Months after DI ATT S.E. ATT S.E. ATT S.E.
1 -459.793 35.241 -422.715 75.964 -495.121 41.940
2 -480.988 46.146 -512.455 70.347 -502.956 40.019
3 -449.705 37.228 -441.388 69.774 -471.264 42.667
4 -452.904 34.939 -436.975 74.425 -456.501 52.407
5 -448.487 39.429 -442.923 78.907 -431.758 45.714
6 -467.264 41.285 -474.225 79.481 -453.214 38.575
7 -472.066 39.595 -512.375 68.532 -462.979 44.225
8 -468.181 40.959 -518.255 65.567 -416.063 39.801
9 -481.338 37.826 -548.627 70.269 -422.382 39.076
10 -463.037 33.070 -540.408 75.270 -416.661 45.420
11 -463.090 35.477 -508.081 65.003 -423.156 43.047
12 -525.273 37.301 -573.693 66.471 -461.189 39.452
13 -459.539 38.512 -515.716 70.368 -413.383 43.500
14 -486.992 33.087 -548.767 71.465 -456.659 41.907
15 -438.669 38.502 -507.394 72.393 -411.428 45.634
16 -458.140 37.588 -535.916 71.793 -421.672 43.012
17 -420.530 40.517 -494.343 66.116 -394.405 41.840
18 -442.003 43.764 -520.581 60.089 -384.072 44.285
19 -432.870 41.452 -512.390 66.778 -359.026 46.901
20 -400.853 42.129 -477.761 77.718 -315.494 46.276
21 -405.621 34.054 -513.647 65.597 -338.216 40.400
22 -369.461 37.654 -446.756 61.697 -325.469 41.610
23 -355.659 34.501 -407.517 73.191 -308.167 50.336
29
Table 2. DID-PSM results: difference in annual earnings (Euro)
All > 54 < 55
years after
DI ATT S.E. ATT S.E. ATT S.E.
1 -2.947,5 610,5 -2.428,1 1.104,1 -3.408,7 628,1
2 -4.803,4 1.311,2 -8.438,7 3.393,9 -2.105,6 982,2
3 -4.269,8 1.228,1 -8.098,1 3.344,1 -1.360,5 929,8