Research
Training in data definitions improves quality of intensive care
data
Daniëlle GT Arts
1,2, Rob J Bosman
3, Evert de Jonge
4, Johannes CA Joore
5and
Nicolette F de Keizer
21Informatician, Department of Intensive Care Medicine, Academic Medical Center, University of Amsterdam, The Netherlands 2Informatician, Department of Medical Informatics, Academic Medical Center, University of Amsterdam, The Netherlands
3Anaesthesiologist-Intensivist, Department of Intensive Care Medicine, Academic Medical Center, Onze Lieve Vrouwe Gasthuis, Amsterdam, The Netherlands 4Internist-Intensivist, Department of Intensive Care Medicine, Academic Medical Center, University of Amsterdam, The Netherlands
5Internist-Intensivist, Department of Internal Medicine & Dermatology, Division of Acute Internal Medicine & Infectious Diseases, University Medical Center, Utrecht, The Netherlands
Correspondence: Daniëlle GT Arts, [email protected]
Introduction
A number of regional and (inter)national intensive care reg-istries have been developed to enable quality assessment in intensive care, including the British Intensive Care National
Audit & Research Centre (ICNARC) and the IMPACT project from the American Society of Critical Care Medicine. These registries enable evaluation of the effectiveness and effi-ciency of the care process. In 1996 the National Intensive
179 APACHE = Acute Physiology and Chronic Health Evaluation; ICU = intensive care unit; NICE = National Intensive Care Evaluation; SAPS = Simpli-fied Acute Physiology Score.
Abstract
BackgroundOur aim was to assess the contribution of training in data definitions and data extraction guidelines to improving quality of data for use in intensive care scoring systems such as the Acute Physiology and Chronic Health Evaluation (APACHE) II and Simplified Acute Physiology Score (SAPS) II in the Dutch National Intensive Care Evaluation (NICE) registry.
MethodsBefore and after attending a central training programme, a training group of 31 intensive care physicians from Dutch hospitals who were newly participating in the NICE registry extracted data from three sample patient records. The 5-hour training programme provided participants with guidelines for data extraction and strict data definitions. A control group of 10 intensive care physicians, who were trained according the to train-the-trainer principle at least 6 months before the study, extracted the data twice, without specific training in between.
Results In the training group the mean percentage of accurate data increased significantly after training for all NICE variables (+7%, 95% confidence interval 5%–10%), for APACHE II variables (+6%, 95% confidence interval 4%–9%) and for SAPS II variables (+4%, 95% confidence interval 1%–6%). The percentage data error due to nonadherence to data definitions decreased by 3.5% after training. Deviations from ‘gold standard’ SAPS II scores and predicted mortalities decreased significantly after training. Data accuracy in the control group did not change between the two data extractions and was equal to post-training data accuracy in the training group.
ConclusionTraining in data definitions and data extraction guidelines is an effective way to improve quality of intensive care scoring data.
Keywordsdata extraction, data quality, medical registry, training program Received: 15 October 2002
Revisions requested: 28 November 2002 Revisions received: 16 January 2003 Accepted: 22 January 2003 Published: 18 February 2003
Critical Care2003, 7:179-184 (DOI 10.1186/cc1886) This article is online at http://ccforum.com/content/7/2/179 © 2003 Arts et al., licensee BioMed Central Ltd
(Print ISSN 1364-8535; Online ISSN 1466-609X). This is an Open Access article: verbatim copying and redistribution of this article are permitted in all media for any purpose, provided this notice is preserved along with the article's original URL.
180
Care Evaluation (NICE) registry was set up in The Netherlands for the same reason. A minimum data set is extracted from the patient record for every patient admitted to each of 21 inten-sive care units (ICUs) currently participating in the NICE reg-istry. Scoring systems such as the Acute Physiology and Chronic Health Evaluation (APACHE) II [1] and the Simplified Acute Physiology Score (SAPS) II [2] are used to calculate a score for each patient based on the most abnormal data from the first 24 hours following intensive care admission; from this they quantify the severity of illness and calculate the corre-sponding probability of in-hospital mortality. As an indicator for quality assessment of intensive care, the observed mortality in the intensive care population is compared with the calculated case–mix corrected mortality in that population.
The use of such an intensive care registry for quality assess-ment strongly depends on the quality of registry data. Several studies have shown interobserver and intraobserver variability in calculation of severity-of-illness scores [3–10]. Fery-Lemonnier and coworkers [3] discussed some of the prob-lems that cause inaccurate APACHE II data collection, including ambiguous definitions and complex calculations. Chen and coworkers [4] also cited lack of clear instructions concerning the timing of APACHE II data collection as a source of variability.
In order to improve quality of data, the NICE registry imple-mented a framework of quality assurance procedures [11]. As a part of this framework the NICE foundation has defined all variables. The NICE data definitions are present in a data dictionary that is available on the internet [12]. At least two physicians per ICU are obliged to attend a central training session organized by the NICE board, during which the data definitions are discussed. Physicians who have attended the central training session train their local staff. This is called the ‘train-the-trainer’ principle. The objective of the present study was to investigate whether this total training concept improves data quality and increases the validity of severity-of-illness scoring in the Dutch NICE registry.
Methods
Sample data
Two intensive care physicians who were experienced in sever-ity scoring and formerly involved in composing the NICE data definitions selected three sample patient cases. These cases were modified to include some potential pitfalls in data extrac-tion (e.g. abnormal physiological values just before or 24 hours after admission to the ICU). The NICE dataset consists of 88 variables (37 categorical variables, 43 numerical variables, six date/time variables, and two strings). In order to reduce errors associated with identifying the worst value, NICE requires the lowest and the highest values recorded in the first 24 hours, Subsequently a central computer algorithm selects the worst value. The standardized data definitions used in the NICE registry are in agreement with widely accepted data def-initions used in the severity-of-illness scoring models (e.g.
APACHE II and SAPS II) [1,2,13–15]. According to these def-initions, the two physicians reached consensus on values for all data items for the three sample patient cases. These values were considered the ‘gold standard’.
Training group
Between February 1999 and May 2001, four central NICE training sessions took place, which were attended by a total of 31 participants. Training session participants were physi-cians from ICUs that intended to participate in the NICE reg-istry. Each training session took approximately 5 hours. All training participants received a copy of the NICE data dictio-nary. During the sessions the definitions of all variables and the data extraction guidelines were discussed and practiced with some patient cases. These central training sessions were given by members of the NICE board who had been involved in the composition of the NICE data definitions and were highly experienced with severity-of-illness scoring systems. All training participants received photocopies of the records from the three selected sample patient cases. They were asked to extract the NICE data from these records into specially designed paper forms 1 week before attending the training session and within 1 month afterward.
Control group
In order to assess the effect on quality of data extracted for the same patient records twice (without training), photo-copies of the records from the same three sample patient cases were issued to a control group. The control group con-sisted of 10 randomly selected physicians and registrars working in one of the ICUs that had been routinely extracting NICE data for several years. The control group had been locally instructed on data definitions and guidelines at least 6 months before the study, according to the ‘train-the-trainer’ principle, by one of the intensive care staff who had previ-ously attended a central NICE training session. A copy of the NICE data dictionary was available to all control group members. The control group was asked to extract data from the sample patient records twice at an interval of 4–6 weeks without training in between.
After the first extraction both the training group and the control group were informed about the study design, implying that there would be a second data extraction 1 month after the first. Participants in the training group and in the control group did not receive their results for the first data extraction before they had completed the second.
Analysis of data quality
181
by comparing the extracted data with the gold standard data. The criteria used for analyzing the accuracy of APACHE II and SAPS II variables were different from those used for all NICE variables.
Criteria for all NICE variables
When assessing data quality for all NICE variables, categori-cal values, strings, dates and times were judged inaccurate when they were incomplete (an item left blank when, accord-ing to the gold standard, it was available) or not equal to the gold standard value. Numerical values were considered inac-curate when they were incomplete or deviated from the gold standard value by a degree greater than was considered acceptable. For example, a deviation in systolic blood pres-sure of more than 10 mmHg below or above the gold stan-dard systolic blood pressure was considered inaccurate. Detailed criteria are available from the authors.
Criteria for APACHE II variables and SAPS II variables
APACHE II and SAPS II data were judged inaccurate if they caused a deviation from the gold standard score for that par-ticular APACHE II or SAPS II variable. For instance, a recorded mean blood pressure of 130 mmHg instead of the gold standard value of 127 would be considered inaccurate because the first results in 3 APACHE II points for blood pressure and the latter in only 2 APACHE II points.
Statistics
Values are presented as percentage accurate data and as absolute deviations from gold standard APACHE II and SAPS II scores and predicted mortalities. The percentage accurate data per participant per case was calculated by dividing the number of correctly recorded data items by the total number of data items that should have been recorded. A 95% confidence interval was calculated for all medians. For the training group and for the control group, differences in percentages of accurate data or in deviations from gold stan-dard scores between the first and the second scoring were tested using the Wilcoxon signed rank sum test. P< 0.05
was considered statistically significant. We analyzed the type of data errors and compared their frequency of occurrence between the two data extractions by the training group. All data analyses were performed using SPSS software version 10.0 (SPSS Inc, Chicago, IL, USA).
Results
Group characteristics
Of all 31 training participants, 22 extracted the NICE data for one or more of the three sample patient cases before and after training. A total of 55 sample cases were evaluated.
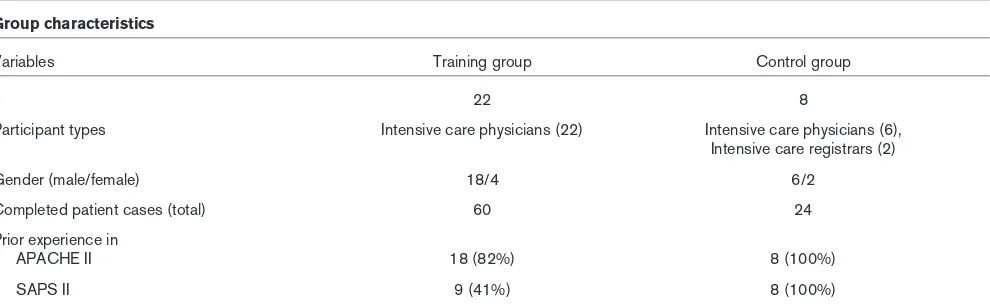
Eight of the 10 physicians and registrars in the control group returned the completed data collection forms for all three sample cases for the first and the second data extractions. This resulted in 24 cases. Training and control group charac-teristics are described in Table 1. Participants in the training group had more experience with APACHE II (82%) than with SAPS II (41%). Participants who did not extract data for all three cases before as well as after training did not differ in data accuracy as compared with those who fully extracted data for all three cases.
Percentage complete and accurate data items
Table 2 shows the percentage accurate data. Results of the Wilcoxon signed rank sum test indicate that, for all three data subsets, the percentage accurate data increased after train-ing (P< 0.01) in the training group. The percentage accurate data for all NICE variables was 79% before and 86% after training. The control group showed no difference between the two sessions for all three data subsets. In the control group, the percentages of accurate data in the first and the second scoring were 86% and 85%, respectively.
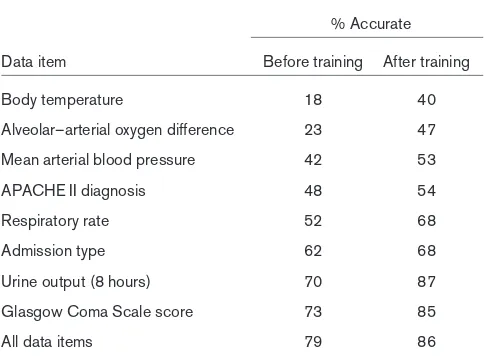
[image:3.612.61.556.99.253.2]Table 3 displays data items with an accuracy percentage below 75%. A relatively large number of inaccurate values was recorded for physiological data and laboratory data. ‘Body temperature’ was one of the physiological variables with a high error rate. Before training as well as after, the
Table 1
Group characteristics
Variables Training group Control group
n 22 8
Participant types Intensive care physicians (22) Intensive care physicians (6),
Intensive care registrars (2)
Gender (male/female) 18/4 6/2
Completed patient cases (total) 60 24
Prior experience in
APACHE II 18 (82%) 8 (100%)
SAPS II 9 (41%) 8 (100%)
182
‘mean blood pressure’ was frequently left blank and the ‘mean alveolar–arterial oxygen difference’ was frequently incorrect. These two variables must be calculated on the basis of other physiological variables. The APACHE II diagno-sis was often erroneously extracted.
Types of data errors
Data errors were categorized into three types: (1) incomplete data; (2) nonadherence to data definitions, such as the selec-tion of values outside the first 24 hours of intensive care admission, inaccurate calculation and ignoring specific guide-lines; and (3) other errors that could not directly be accounted for, such as writing errors, transposed minimal and maximal values, or values that were not in the source data. The percentages of data error types are displayed in Table 4. All types of data errors exhibited a decrease after training.
Nonadherence to data definitions decreased the most after training. Incomplete data mostly concerned respiratory rate and mean blood pressure. Inaccurate data from outside the first 24 hours of intensive care admission affected all kinds of physiological and laboratory data. Calculation errors mostly pertained to urine production and alveolar–arterial oxygen dif-ference. Blood gas values should be selected from the sample that results in the highest alveolar–arterial oxygen dif-ference; incorrect selection of blood gas samples resulted in inaccurate values for all five blood gas variables (i.e. partial arterial oxygen pressure, partial arterial carbon dioxide pres-sure, fractional inspired oxygen, alveolar–arterial oxygen dif-ference and pH), causing a relatively high increase in the percentage of inaccurate data. Other variables for which training participants frequently ignored data definitions were admission type, diagnoses, Glasgow Coma Scale scores and body temperature. Measurements of body temperature from
Percentage complete and accurately recorded data items for all NICE variables, APACHE II variables and SAPS II variables
Group All variables NICE (n= 88) APACHE II variables (n= 35) SAPS II variables (n= 26) Training group (60 cases)
Before training 79 (74–84) 82 (77–88) 89 (86–92)
After training 86 (82–91) 89 (87–91) 93 (91–96)
Difference 7 (2–11)* 6 (2–9)* 4 (0–5)*
Control group (24 cases)
1st data extraction 86 (80–91) 86 (81–90) 94 (90–94)
2nd data extraction 85 (75–91) 86 (77–92) 93 (82–95)
Difference 3 (–10 to +9) 1 (–6 to +7) 1 (–10 to +5)
[image:4.612.55.558.117.253.2]Values are presented as median percentage (95% confidence interval). *P< 0.05. APACHE, Acute Physiology and Chronic Health Evaluation; NICE, National Intensive Care Evaluation; SAPS, Simplified Acute Physiology Score.
Table 3
NICE data items with percentage accuracy below 75% before training in the training group (for all NICE variables)
% Accurate
Data item Before training After training
Body temperature 18 40
Alveolar–arterial oxygen difference 23 47
Mean arterial blood pressure 42 53
APACHE II diagnosis 48 54
Respiratory rate 52 68
Admission type 62 68
Urine output (8 hours) 70 87
Glasgow Coma Scale score 73 85
All data items 79 86
[image:4.612.56.299.327.508.2]Sixty cases were assessed in total in the training group. APACHE, Acute Physiology and Chronic Health Evaluation; NICE, National Intensive Care Evaluation.
Table 4
Types of data extraction errors and their frequency of occurrence in the training group before and after training (for all NICE variables)
Frequency (%) Before After
Data error type training training Difference
Incomplete 7.4 4.5 2.9*
Nonadherence to data definitions 11.4 7.9 3.5* Inclusion of values outside 3.8 1.3 2.5* first 24 hours
Calculation error 2.8 2.3 0.5
Other 4.8 4.3 0.5*
Other (errors that could not 2.1 1.3 0.8
directly be accounted for)
Total inaccurate data 21.2 13.9 7.3*
[image:4.612.314.557.337.516.2]183
the rectum, blood, oesophagus or ear are considered to be core temperatures. According to the definition 1°C should be added to temperatures measured at the patient’s groin; this was often forgotten. Other errors that could not directly be accounted for were randomly distributed among all variables. In most of these cases the documented data value did not correspond to the true lowest or highest value.
Severity-of-illness scores and predicted mortalities
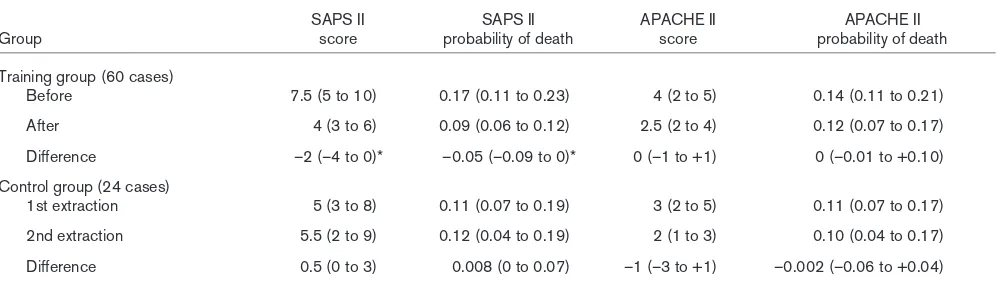
Results of the Wilcoxon signed rank sum test indicate that, after training, SAPS II scores and mortality probabilities in the training group showed less absolute deviation from gold stan-dard scores and predicted mortalities (P= 0.002 in both cases; Table 5). APACHE II scores and mortality probabilities showed no improvement after training. In the control group, deviations from SAPS II and APACHE II gold standard scores and mortality probabilities were equally large at both data extractions.
Discussion
Based on the results of the present study we may conclude that training in data definitions and data collection guidelines improves data quality in general. Before training, many vari-ables were incorrect and incomplete; this was probably due to the fact that participants were unacquainted with most of the data definitions. After training, completeness and adher-ence to data definitions increased significantly.
It could be argued that the decrease in errors after training was not the result of training but simply the result of extract-ing the same data twice within 2 months. Therefore, a control group was included, members of which also extracted the data from the same three cases twice with an interval of 4–6 weeks but without any training (or other intervention) in between. In that group, no difference was observed in data accuracy between the first and second data extractions. The fact that data quality did not change between the first and second data extractions in the control group suggests that
simply assessing the same cases twice did not influence data quality in the training group. However, it cannot be ruled out that data quality in the control group was already optimal at the first data extraction, making it impossible to improve further (‘ceiling effect’). Data accuracy in the control group was equal to the data accuracy after training in the training group. We could conclude from this that central and local training sessions (in the control group) are equally effective and that the effect of training remains for a longer period. Alternatively, the difference in baseline data quality might have been a reflection of different characteristics of both groups. For example, the number of participants in both groups was not equal, and the control group consisted of physicians from one hospital whereas the participants in the training group were from different sites.
We only evaluated the short-term effects of training on data quality. Further studies are necessary to determine how long these beneficial effects will last.
In the present study we found that, after training, 14% of all data items were still incomplete or inaccurate. We recently examined the quality of data contained in the NICE registry and found a considerably lower error rate (6%) [16]. The dif-ferent findings in these two studies may have various reasons. First, in the present study the cases were specially selected for evaluation of data quality and contained many artificially incorporated pitfalls in data extraction. Second, in contrast to real data extraction for the NICE registry, no automatic data checks were run on the extracted data. Finally, in reality, data are extracted by the treating physician. For this study, the physicians had to extract data from copies of patient records that they were not familiar with and from patients they had never seen.
[image:5.612.58.556.120.263.2]The NICE registry is primarily used to calculate severity-of-illness scores and predicted mortality based on these scores. The validity of SAPS II scores and mortality probabilities
Table 5
Deviation from the gold standard severity-of-illness scores and mortality probabilities for training and control groups
SAPS II SAPS II APACHE II APACHE II
Group score probability of death score probability of death
Training group (60 cases)
Before 7.5 (5 to 10) 0.17 (0.11 to 0.23) 4 (2 to 5) 0.14 (0.11 to 0.21)
After 4 (3 to 6) 0.09 (0.06 to 0.12) 2.5 (2 to 4) 0.12 (0.07 to 0.17)
Difference –2 (–4 to 0)* –0.05 (–0.09 to 0)* 0 (–1 to +1) 0 (–0.01 to +0.10)
Control group (24 cases)
1st extraction 5 (3 to 8) 0.11 (0.07 to 0.19) 3 (2 to 5) 0.11 (0.07 to 0.17)
2nd extraction 5.5 (2 to 9) 0.12 (0.04 to 0.19) 2 (1 to 3) 0.10 (0.04 to 0.17)
Difference 0.5 (0 to 3) 0.008 (0 to 0.07) –1 (–3 to +1) –0.002 (–0.06 to +0.04)
184
improved after training, whereas the validity of APACHE II scores and mortality probabilities did not. This difference is probably accounted for by the fact that, before training, only a few participants were experienced in SAPS II data collection and almost all participants were familiar with APACHE II data collection. The deviations from gold standard scores and probabilities found in the present study, even after training, are still considerable and may not support their use in clinical practice. However, the reliability of severity-of-illness scores was found to be sufficient by two other studies [7,16]. These different findings can be explained by differences in study designs, such as the incorporation of artificial pitfalls in the present study.
Four APACHE II variables, namely temperature, alveolar– arterial oxygen difference, mean arterial blood pressure and APACHE II diagnostic category, exhibited a high percentage of incorrect data before and after training. These variables have similarly been reported by other researchers to have low accuracy and reliability rates [3,4,7]. In a study conducted by Chen and coworkers [4], variables involving calculations, such as the alveolar oxygen difference, were found to have the lowest agreement. Several studies suggest that the ambiguous definitions for some of the APACHE II medical terms are an important cause of the wide interobserver varia-tions [3–5]. Physicians, researchers and decision makers should be aware of the variability in severity-of-illness scores and mortality probabilities, and take them into account. To increase data accuracy and reduce variability on an interna-tional level, there should be an internainterna-tional agreement on unambiguous definitions for all variables used in APACHE II and SAPS II models.
A study conducted by Polderman and coworkers [10] showed that training in data extraction reduced the inter-observer variability in APACHE II scoring in a single university hospital setting. It is possible that the positive effect of train-ing in their study was overestimated because their traintrain-ing programme focused on the errors observed in the first data extraction episode, before training. The content of our NICE training programme was determined before we started the present study and was not affected by the results of the first data extraction.
Many ICUs collect severity-of-illness scores. Data transcrip-tion from a patient record to a case record form is the most commonly used method for collection of these scores. There-fore, we believe that the positive effect of training found in the present study will also be found in other intensive care reg-istries and clinical trials.
Although it is probably not possible to have an intensive care registry that is completely free of errors, this study shows that centrally organized training in data definitions, which is further diffused by the train-the-trainer principle, is an important basis for good data quality.
Competing interests
None declared.
Acknowledgement
We thank Jeremy Wyatt for his valuable comments on this manuscript.
References
1. Knaus WA, Draper EA, Wagner DP, Zimmerman JE: APACHE II: a severity of disease classification system. Crit Care Med
1985, 13:818-829.
2. Le Gall JR, Lemeshow S, Saulnier F: A new Simplified Acute Physiology Score (SAPS II) based on a European/North American multicenter study.JAMA 1993, 270:2957-2963. 3. Fery-Lemonnier E, Landais P, Loirat P, Kleinknecht D, Brivet F:
Evaluation of severity scoring systems in ICUs: translation, conversion and definition ambiguities as a source of inter-observer variability in Apache II, SAPS and OSF. Intensive Care Med1995, 21:356-360.
4. Chen LM, Martin CM, Morrison TL, Sibbald WJ: Interobserver variability in data collection of the APACHE II score in teach-ing and community hospitals. Crit Care Med1999, 27 :1999-2004.
5. Holt AW, Bury LK, Bersten AD, Skowronski GA, Vedig AE: Prospective evaluation of residents and nurses as severity score data collectors.Crit Care Med1992, 20:1688-1691. 6. Goldhill DR, Sumner A: APACHE II, data accuracy and outcome
prediction.Anaesthesia1998, 53:937-943.
7. Damiano AM, Bergner M, Draper EA, Knaus WA, Wagner DP: Reliability of a measure of severity of illness: acute physiol-ogy of chronic health evaluation II.J Clin Epidemiol1992, 45: 93-101.
8. Polderman KH, Thijs LG, Girbes AR: Interobserver variability in the use of APACHE II scores.Lancet1999, 353:380.
9. Polderman K, Christiaans H, Wester J, Spijkstra J, Girbes A: Intra-observer variability in APACHE II scoring.Intensive Care Med
2001, 27:1550-1552.
10. Polderman K, Jorna E, Girbes A: Inter-observer variability in APACHE II scoring: effect of strict guidelines and training.
Intensive Care Med2001, 27:1365-1369.
11. Arts DGT, de Keizer NF, Scheffer GJ: Defining and improving data quality in medical registries: a literature review, case study, and generic framework.J Am Med Inform Assoc2002, 9:600-611.
12. National Intensive Care Evaluation (NICE). [http://www.stichting-nice.nl]
13. Lemeshow S, Klar J, Teres D, Spitz Avrunin J, Gehlbach S, Rapoport J, Rué M: Mortality probability models for patients in
Key messages
• Good definitions for all data items are a prerequisite for highly accurate data collection
• Training in data extraction and definitions appears to be effective in improving quality of intensive care data
• Within the scoring system data, the positive training effect was only proven for the SAPS II data, in which the study population was less experienced as com-pared with APACHE II
• The positive effect of central training may be diffused by the train-the-trainer principle
185 the intensive care unit for 48 or 72 hours: a prospective,
multi-center study.Crit Care Med1994, 22:1351-1358.
14. Knaus WA, Wagner DP, Draper EA, Zimmerman JE, Bergner M, Bastos PG, Sirio CA, Murphy DJ, Lotring T, Damiano A: The APACHE III prognostic system. Risk prediction of hospital mortality for critically ill hospitalized adults.Chest1991, 100: 1619-1636.
15. Le Gall JR, Klar J, Lemeshow S, Saulnier F, Alberti C, Artigas A, Teres D: The Logistic Organ Dysfunction system. A new way to assess organ dysfunction in the intensive care unit. ICU Scoring Group.JAMA1996, 276:802-810.
16. Arts D, de Keizer N, Scheffer G, de Jonge E: Quality of data col-lected for severity of illness scores in the Dutch National Intensive Care Evaluation (NICE) registry.Intensive Care Med