Comparing human versus automatic feature extraction for fine-grained
elementary readability assessment
Yi Ma, Ritu Singh, Eric Fosler-Lussier Dept. of Computer Science & Engineering
The Ohio State University Columbus, OH 43210, USA
may,singhri,[email protected]
Robert Lofthus Xerox Corporation Rochester, NY 14604, USA [email protected]
Abstract
Early primary children’s literature poses some interesting challenges for automated readabil-ity assessment: for example, teachers often use fine-grained reading leveling systems for determining appropriate books for children to read (many current systems approach read-ability assessment at a coarser whole grade level). In previous work (Ma et al., 2012), we suggested that the fine-grained assess-ment task can be approached using a ranking methodology, and incorporating features that correspond to the visual layout of the page improves performance. However, the previ-ous methodology for using “found” text (e.g., scanning in a book from the library) requires human annotation of the text regions and cor-rection of the OCR text. In this work, we ask whether the annotation process can be auto-mated, and also experiment with richer syntac-tic features found in the literature that can be automatically derived from either the human-corrected or raw OCR text. We find that auto-mated visual and text feature extraction work reasonably well and can allow for scaling to larger datasets, but that in our particular exper-iments the use of syntactic features adds little to the performance of the system, contrary to previous findings.
1 Introduction
Knowing the reading level of a children’s book is an important task in the educational setting. Teachers want to have leveling for books in the school library; parents are trying to select appro-priate books for their children; writers need
guid-ance while writing for different literacy needs (e.g. text simplification)—reading level assessment is re-quired in a variety of contexts. The history of as-sessing readability using simple arithmetic metrics dates back to the 1920s when Thorndike (1921) has measured difficulty of texts by tabulating words ac-cording to the frequency of their use in general lit-erature. Most of the traditional readability formulas were also based on countable features of text, such as syllable counts (Flesch, 1948).
More advanced machine learning techniques such as classification and regression have been applied to the task of reading level prediction (Collins-Thompson and Callan, 2004; Schwarm and Osten-dorf, 2005; Petersen and OstenOsten-dorf, 2009; Feng et al., 2010); such works are described in further de-tail in the next Section 2. In recent work (Ma et al., 2012), we approached the problem of fine-grained leveling of books, demonstrating that a ranking ap-proach to predicting reading level outperforms both classification and regression approaches in that do-main. A further finding was that visually-oriented features that consider the visual layout of the page (e.g. number of text lines per annotated text region, text region area compared to the whole page area and font size etc.) play an important role in predict-ing the readpredict-ing levels of children’s books in which pictures and textual layout dominate the book con-tent over text.
However, the data preparation process in our pre-vious study involves human intervention—we ask human annotators to draw rectangle markups around text region over pages. Moreover, we only use a very shallow surface level text-based feature set to
compare with the visually-oriented features. Hence in this paper, we assess the effect of using com-pletely automated annotation processing within the same framework. We are interested in exploring how much performance will change by completely eliminating manual intervention. At the same time, we have also extended our previous feature set by in-troducing a richer set of automatically derived text-based features, proposed by Feng et al. (2010), which capture deeper syntactic complexities of the text. Unlike our previous work, the major goal of this paper is not trying to compare different machine learning techniques used in readability assessment task, but rather to compare the performance differ-ences between with and without human labor in-volved within our previous proposed system frame-work.
We begin the paper with the description of re-lated work in Section 2, followed by detailed ex-planation regarding data preparation and automatic annotations in Section 3. The extended features will be covered in Section 4, followed by experimental analysis in Section 5, in which we will compare the results between human annotations and automatic annotations. We will also report the system per-formance after incorporating the rich text features (structural features). Conclusions follow in Section 6.
2 Related Work
Since 1920, approximately 200 readability formulas have been reported in the literature (DuBay, 2004); statistical language processing techniques have re-cently entered into the fray for readability assess-ment. Si and Callan (2001) and Collins-Thompson and Callan (2004) have demonstrated the use of lan-guage models is more robust for web documents and passages. Heilman et al. (2007) studied the impact of grammar-based features combined with language modeling approach for readability assess-ment of first and second language texts. They ar-gued that grammar-based features are more perti-nent for second language learners than for the first language readers. Schwarm and Ostendorf (2005) and Petersen and Ostendorf (2009) both used a sup-port vector machine to classify texts based on the reading level. They combined traditional methods
of readability assessment and the features from lan-guage models and parsers. Aluisio et al. (2010) have developed a tool for text simplification for the authoring process which addresses lexical and syn-tactic phenomena to make text readable but their as-sessment takes place at more coarse levels of liter-acy instead of finer-grained levels used for children’s books.
A detailed analysis of various features for auto-matic readability assessment has been done by Feng
et al. (2010). Most of the previous work has used
web page documents, short passages or articles from educational newspapers as their datasets; typically the task is to assess reading level at a whole-grade level. In contrast, early primary children’s literature is typically leveled in a more fine-grained manner, and the research question we pursued in our previ-ous study was to investigate appropriate methods of predicting what we suspected was a non-linear read-ing level scale.
Automating the process of readability assessment is crucial for eventual widespread acceptance. Pre-vious studies have looked at documents that were already found in electronic form, such as web texts. While e-books are certainly on the rise (and would help automated processing) it is unlikely that paper books will be completely eliminated from the pri-mary school classroom soon. Our previous study re-quired both manual scanning of the books and man-ual annotation of the books to extract the location and content of text within the book — the necessity of which we evaluate in this study by examining the effects of errors from the digitization process.
3 Data Preparation and Book Annotation
Reading # of Reading # of Level Books Level Books
A 6 H 7
B 9 I 6
C 5 J 11
D 8 K 6
E 11 L 3
F 10 M 6
[image:3.612.96.277.60.191.2]G 7 N 2
Table 1: Distribution of books over Fountas and Pinnell reading levels
Our agreement with the books’ publishers only allows access to physical copies of books rather than electronic versions; we scan each book into a PDF version. This situation would be similar to that of a contemporary classroom teacher who is se-lecting books from the classroom or school library for evaluating a child’s literacy progress.1 We then use Adobe Acrobat to run OCR (Optical Character Recognition) on the PDF books. Following our pre-vious work, we first begin our process of annotat-ing each book usannotat-ing Adobe Acrobat before convert-ing them into correspondconvert-ing XML files. Features for each book are extracted from their correspond-ing XMLs which contain all the text information and book layout contents necessary to calculate the fea-tures. Each book is manually scanned, and then an-notated in two different ways: we use human anno-tators (Section 3.1) and a completely automated pro-cess (Section 3.2). The job of human annotators is primarily to eliminate the errors made by OCR soft-ware, as well as correctly identifying text regions on each page. We encountered three types of typical OCR errors for the children’s books in our set:
1. False alarms: some small illustration picture segments (e.g. flower patterns on a little girl’s pajama or grass growing in bunches on the ground) are recognized as text.
2. False negatives: this is more likely to occur for text on irregular background such as white text
1While it is clear that publishers will be moving toward elec-tronic books which would avoid the process of scanning (and likely corresponding OCR problems), it is also clear that phys-ical books and documents will be present in the classroom for years to come.
OCR Correct Example output word
1 I 1−I
! I ! −I
[ f [or−for O 0 1OO−100 nn rm wann−warm rn m horne−home IT! m aIT!−am
[image:3.612.344.510.60.254.2]1n m tilne−time n1. m n1.y−my 1V W 1Ve−We vv w vvhen−when
Table 2: Some common OCR errors
on black background or text overlapped with illustrations.
3. OCR could misread the text. These are most common errors. Some examples of this type of error are shown in Table 2.
The two different annotation processes are explained in the following Subsections 3.1 and 3.2.
3.1 Human Annotation
Annotators manually draw a rectangular box over the text region on each page using Adobe Acrobat markup drawing tools. The annotators also correct the type 2 and 3 of OCR errors which are mentioned above. In human annotation process, the false alarm (type 1) errors are implicitly prevented since the an-notators will only annotate the regions where text truly exists on the page (no matter whether the OCR recognized or not).
3.2 Automatic Annotation
For automatic annotation, we make use of JavaScript API provided by Adobe Acrobat. The automatic an-notation tool is implemented as a JavaScript plugin menu item within Adobe Acrobat. The JavaScript API can return the position of every single recog-nized word on the page. Based on the position cues of each word, we design a simple algorithm to auto-matically cluster the words into separate groups ac-cording to certain spatial distance thresholds.2
In-2
tuitively, one could imagine the words as small floating soap bubbles on the page—where smaller bubbles (individual words) which are close enough will merge together to form bigger bubbles (text re-gions) automatically. For each detected text region, a bounding rectangle box annotation is drawn on the page automatically. Beyond this point, the rest of the data preparation process is identical to hu-man annotation, in which the corresponding XMLs will be generated from the annotated versions of the PDF books. However, unlike human annota-tion, automating the annotation process can intro-duce noise into the data due to uncorrected OCR er-rors. In correspondence to the three types of OCR errors, automatic annotation could also draw extra bounding rectangle boxes on non-text region (where OCR thinks there is text there but there is not), fails to draw bounding rectangle boxes on text region (where OCR should have recognized text there but it does not) and accepts many mis-recognized non-word symbols as text content (where OCR misreads words).
3.3 Generating XMLs From Annotated PDF Books
This process is also implemented as another JavaScript plugin menu item within Adobe Acrobat. The plugin is run on the annotated PDFs and is de-signed to be agnostic to the annotation types—it will work on both human-annotated and auto-annotated versions of PDFs. Once the XMLs for each chil-dren’s book are generated, we could proceed to the feature extraction step. The set of features we use in the experiments are described in the following Sec-tion 4.
4 Features
For surface-level features and visual features, we utilize similar features proposed in our previous study.3 For completeness’ sake, we list these two sets of features as follows in Section 4.1:
3
We discard two visual features in both the human and au-tomatic annotation that require the annotation of the location of images on the page, as these were features that the Adobe Acrobat JavaScript API could not directly access.
4.1 Surface-level Features and Visually-oriented Features
• Surface-level Features
1. Number of words
2. Number of letters per word 3. Number of sentences 4. Average sentence length
5. Type-token ratio of the text content.
• Visually-oriented Features
1. Page count
2. Number of words per page 3. Number of sentences per page 4. Number of text lines per page 5. Number of words per text line
6. Number of words per annotated text rect-angle
7. Number of text lines per annotated text rectangle
8. Average ratio of annotated text rectangle area to page area
9. Average font size
4.2 Structural Features
Since our previous work only uses surface level of text features, we are interested in investigating the contribution of high-level structural features to the current system. Feng et al. (2010) found several parsing-based features and part-of-speech based fea-tures to be useful. We utilize the Stanford Parser (Klein and Manning, 2003) to extract the following features from the XML files based on those used in (Feng et al., 2010):
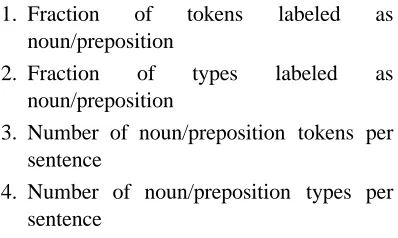
• Parsed Syntactic Features for NPs and VPs
1. Number of the NPs/VPs
2. Number of NPs/VPs per sentence
3. Average NP/VP length measured by num-ber of words
4. Number of non-terminal nodes per parse tree
5. Number of non-terminal ancestors per word in NPs/VPs
1. Fraction of tokens labeled as noun/preposition
2. Fraction of types labeled as noun/preposition
3. Number of noun/preposition tokens per sentence
4. Number of noun/preposition types per sentence
5 Experiments
In the experiments, we look at how much the perfor-mance dropped by switching to zero human inputs. We also investigate the impact of using a richer set of text-based features. We apply the ranking-based book leveling algorithm proposed by our previous study (Ma et al., 2012) and use theSVMrankranker
(Joachims, 2006) for our experiments. In this sys-tem, the ranker learns to sort the training books into leveled order. The unknown test book is inserted into the ordering of the training books by the trained ranking model, and the predicted reading level is calculated by averaging over the levels of the known books above and below the test book. Following the previous study, each book is uniformly partitioned into 4 parts, treating each sub-book as an individ-ual entity. A leave-n-out procedure is utilized for
evaluation: during each iteration of the training, the system leaves out all npartitions (sub-books) cor-responding to one book. In the testing phase, the trained ranking model tests on all partitions corre-sponding to the held-out book. We obtain a single predicted reading level for the held-out book by av-eraging the results for all its partitions; avav-eraging produces a more robust result. Two separate experi-ments are carried out on human-annotated and auto-annotated PDF books respectively.
We use two metrics to determine quality: first, the accuracy of the system is computed by claiming it is correct if the predicted book level is within±1of
the true reading level.4 The second scoring metric is
the absolute error of number of levels away from the key reading level, averaged over all of the books.
4We follow our previous study to use±
1accuracy evalu-ation metric in order to generate consistent results and allow easy comparison. Another thing to notice is that this is still rather fine-grained since multiple reading levels correspond to one single grade level.
We report the experiment results on different combinations of feature sets: surface level features plus visually-oriented features, surface level features only, visually-oriented features only, structural fea-tures only and finally combining all the feafea-tures to-gether.
5.1 Human Annotation vs. Automatic Annotation
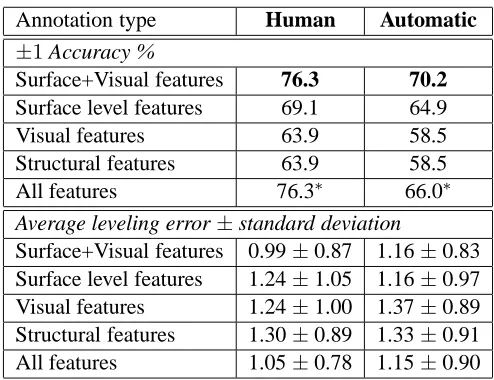
As we can observe from Table 3,5overall the human annotation gives higher accuracy than automatic an-notation across different feature sets. The perfor-mance difference between human annotation and au-tomatic annotation could be attributed to the OCR errors (described in Section 3.2) which are intro-duced in the automatic annotation process. How-ever, to our surprise, the best performance of human annotation is not significantly better than automatic annotation even atp < 0.1 level (figures in bold).6
Only for the experiment using all features does hu-man annotation outperform the automatic annota-tion at p < 0.1 level (still not significantly better
at p < 0.05 level, figures with asterisks). There-fore, we believe that the extra labor involved in the annotation step could be replaced by the automatic process without leading to a significant performance drop. While the process does still require manual scanning of each book (which can be time consum-ing dependconsum-ing on the kind of scanner), the automatic processing can reduce the labor per book from ap-proximately twenty minutes per book to just a few seconds.
5.2 Incorporating Structural Features
[image:5.612.102.301.64.183.2]Our previous study demonstrated that combin-ing surface features with visual features produces promising results. As mentioned above, the sec-ond aim of this study is to see how much benefit we can get from incorporating high-level structural features, such as those used in (Feng et al., 2010) (described in Section 4.2), with the features in our previous study.
Table 3 shows that for both human and automatic
5
In three of the books, the OCR completely failed; thus only 94 books are available for evaluation of the automatic annota-tion.
6
Annotation type Human Automatic ±1Accuracy %
Surface+Visual features 76.3 70.2
Surface level features 69.1 64.9 Visual features 63.9 58.5 Structural features 63.9 58.5 All features 76.3∗ 66.0∗ Average leveling error±standard deviation
[image:6.612.182.429.60.250.2]Surface+Visual features 0.99±0.87 1.16±0.83 Surface level features 1.24±1.05 1.16±0.97 Visual features 1.24±1.00 1.37±0.89 Structural features 1.30±0.89 1.33±0.91 All features 1.05±0.78 1.15±0.90
Table 3: Results on 97 books using human annotations vs. automatic annotations, reporting accuracy within one level and average error for 4 partitions per book.
annotation under the ±1 accuracy metric, the
vi-sual features and the structural features have the same performance, whose accuracy are both slightly lower than that of surface level features. By combin-ing the surface level features with the visual features, the system obtains the best performance. How-ever, by combining all three feature sets, the sys-tem performance does not change for human annota-tion whereas it hurts the performance for automatic annotation—it is likely that the OCR errors existing in the automatic annotations give rise to erroneous structural features (e.g. the parser would produce less robust parses for sentences which have out of vocabulary words). Overall, we did not observe bet-ter performance by incorporating structural features. Using structural features on their own also did not produce noteworthy results. Although among the three kinds of features (surface, visual and struc-tural), structural features have the highest computa-tional cost, it exhibits no significant improvement to system results. In the average leveling error metric, the best performance is again obtained at the com-bination of surface level features and visual features for human annotation, whereas the performance re-mains almost the same after incorporating structural features for automatic annotation.
6 Conclusion
In this paper, we explore the possibility of reducing human involvement in the specific task of predicting
reading levels of scanned children’s books by elimi-nating the need for human annotation. Clearly there is a trade off between the amount of human labor involved and the accuracy of the reading level pre-dicted. Based on the experimental results, we did not observe significant performance drop by switch-ing from human annotation to automatic annotation in the task of predicting reading levels for scanned children’s books.
We also study the effect of incorporating struc-tural features into the proposed ranking system. The experimental results showed that structural features exhibit no significant effect to the system perfor-mance. We conclude for the simply structured, short text that appears in most children’s books, a deep level analysis of the text properties may be overkill for the task and produced unsatisfactory results at a high computational cost for our task.
In the future, we are interested in investigating the importance of each individual feature as well as ap-plying various feature selection methods to further improve the overall performance of the system—in the hope that making the ranking system more ro-bust to OCR errors introduced by automatic annota-tion processing. Another interesting open quesannota-tion is that how many scanned book pages are needed to make a good prediction.7 Such analysis would be very helpful for practical purposes, since a teacher
7
could just scan few sample pages instead of a full book for a reliable prediction.
References
S. Aluisio, L. Specia, C. Gasperin, and C. Scarton. 2010. Readability assessment for text simplification. In Pro-ceedings of the NAACL HLT 2010 Fifth Workshop on Innovative Use of NLP for Building Educational Ap-plications, pages 1–9. Association for Computational Linguistics.
K. Collins-Thompson and J. Callan. 2004. A language modeling approach to predicting reading difficulty. In Proceedings of HLT / NAACL 2004, volume 4, pages 193–200, Boston, USA.
W.H. DuBay. 2004. The principles of readability. Im-pact Information, pages 1–76.
L. Feng, M. Jansche, M. Huenerfauth, and N. Elhadad. 2010. A comparison of features for automatic read-ability assessment. In Proceedings of the 23rd In-ternational Conference on Computational Linguistics (COLING 2010), pages 276–284, Beijing, China. As-sociation for Computational Linguistics.
R. Flesch. 1948. A new readability yardstick. Journal of applied psychology, 32(3):221–233.
I. Fountas and G. Pinnell. 2010. Fountas and pinnell benchmark assessment system 1. http://www.heinemann.com/products/E02776.aspx. M. Heilman, K. Collins-Thompson, J. Callan, and M.
Es-kenazi. 2007. Combining lexical and grammatical features to improve readability measures for first and second language texts. In Proceedings of NAACL HLT, pages 460–467.
T. Joachims. 2006. Training linear SVMs in linear time. In Proceedings of the 12th ACM SIGKDD interna-tional conference on Knowledge discovery and data mining, pages 217–226. ACM.
D. Klein and C. Manning. 2003. Accurate unlexical-ized parsing. In Proceedings of the 41st Meeting of the Association for Computational Linguistics, pages 423–430.
Y. Ma, E. Fosler-Lussier, and R. Lofthus. 2012. Ranking-based readability assessment for early pri-mary children’s literature. In Proceedings of NAACL HLT.
S. Petersen and M. Ostendorf. 2009. A machine learn-ing approach to readlearn-ing level assessment. Computer Speech & Language, 23(1):89–106.
S. Schwarm and M. Ostendorf. 2005. Reading level as-sessment using support vector machines and statistical language models. In Proceedings of the 43rd Annual Meeting on Association for Computational Linguis-tics, pages 523–530. Association for Computational Linguistics.
L. Si and J. Callan. 2001. A statistical model for scien-tific readability. In Proceedings of the tenth interna-tional conference on Information and knowledge man-agement, pages 574–576. ACM.