Proceedings of the Tenth Workshop on Innovative Use of NLP for Building Educational Applications, 2015, pages 42–48,
Automated Scoring of Picture-based Story Narration
Swapna Somasundaran1, Chong Min Lee1, Martin Chodorow2 and Xinhao Wang1 1Educational Testing Service, 660 Rosedale Road, Princeton, NJ 08541, USA
2Hunter College and the Graduate Center, CUNY, New York, NY 10065, USA {ssomasundaran,clee001,xwang002}@ets.org
martin.chodorow@hunter.cuny.edu
Abstract
This work investigates linguistically moti-vated features for automatically scoring a spo-ken picture-based narration task. Specifically, we build scoring models with features for story development, language use and task rele-vance of the response. Results show that com-binations of these features outperform a base-line system that uses state of the art speech-based features, and that best results are ob-tained by combining the linguistic and speech features.
1 Introduction
Story-telling has been used in evaluating the devel-opment of language skills (Sun and Nippold, 2012; McKeough and Malcolm, 2011; Botvin and Sutton-Smith, 1977). It has also been incorporated into assessment of English language proficiency in tests such as ETS’s TOEFL Junior Comprehensive Test1,
where English language skills of non-native middle-school students are tested on a task designed to elicit stories based on pictures. The Six-Picture Narration task presents a series of six pictures (similar to a comic strip) to the test taker, who must orally pro-duce a story which incorporates the events depicted in the pictures. As the scoring guide2for this task
in-dicates, in addition to fluidity of speech and few pro-nunciation errors, high scoring responses must also 1Details of the task and sample can be found at https://toefljr.caltesting.org/sampleQuestions/TOEFLJr/s-movietheater.html
2https://www.ets.org/s/toefl junior/pdf/
toefl junior comprehensive speaking scoring guides.pdf
show good command of language conventions, in-cluding grammar and word usage, and must also be relevant to the task.
Previous work (Evanini and Wang, 2013) ex-plored automated assessment of the speech compo-nent of the spoken responses to the picture narra-tion task, but the linguistic and narrative aspects of the response have not received much attention. In this work, we investigate linguistic and construct-relevant aspects of the test such as (1) relevance and completeness of the content of the responses with respect to the prompt pictures, (2) proper word us-age (3) use of narrative techniques such as detailing to enhance the story, and (4) sequencing strategies to build a coherent story.
The contribution of this work is three-fold. First, we improve the construct coverage of the automated scoring models by incorporating evaluation of ele-ments prescribed in the scoring rubric. Second, our linguistically motivated features allow for clear in-terpretation and explanation of scores, which is es-pecially important if the automated scoring is to be employed for educational purposes. Finally, our re-sults are promising – we show that the combination of linguistic and construct-relevant features which we explore in this work outperforms the state of the art baseline system, and that the best performance is obtained when the linguistic and construct-relevant features are combined with the speech features.
2 Related Work
prosody and pronunciation. Our work explores the other (complementary) dimensions of the test such as language use, content relevance and story devel-opment.
Somasundaran and Chodorow (2014) construct features for awkward word usage and content rele-vance for a written vocabulary test which we adapt for our task. Discourse organization features have been employed for essay scoring of written essays in the expository and argumentative genre (Attali and Burstein, 2006). Our discourse features are focused on the structure of spoken narratives. Our relevance measure is intended to capture topicality while pro-viding leeway for creative story telling, which is different from scoring summaries (Loukina et al., 2014). King and Dickinson (2013) use dependency parses of written picture descriptions. Given that our data is automatically recognized speech, parse features are not likely to be reliable. We use mea-sures of n-gram association, such as pointwise mu-tual information (PMI), that have a long history of use for detecting collocations and measuring their quality (see Manning and Sch¨utze (1999) and Lea-cock et al. (2014) for reviews). Our application of a large n-gram database and PMI is to encode lan-guage proficiency in sentence construction without using a parser.
Picture description tasks have been employed in a number of areas of study ranging from second language acquisition to Alzheimer’s disease (Ellis, 2000; Forbes-McKay and Venneri, 2005). Pictubased story narration has also been used to study re-ferring expressions (Lee et al., 2012) and to analyze child narratives (Hassanali et al., 2013).
3 Data
The TOEFL Junior Comprehensive assessment is a computer-based test intended for middle school stu-dents around the ages of 11 - 15, and is designed to assess a student’s English communication skills. As mentioned above, we focus on the Six-Picture Narration task. Human expert raters listen to the recorded responses, which are about 60 seconds in duration, and assign a score to each on a scale of 1 - 4, with score point 4 indicating an excellent re-sponse. In this work, we use the automatic speech recognition (ASR) output transcription of the
re-Total —Score Distribution—
1 2 3 4
Train 877 142 401 252 82
[image:2.612.338.513.64.115.2]Eval 674 132 304 177 61
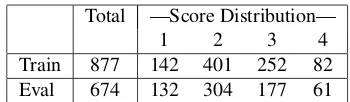
Table 1: Number of responses and score distributions for training and evaluation datasets.
sponses (see (Evanini and Wang, 2013) for details). The data consists of 3440 responses to 6 prompts, all of which were scored by human raters. Ta-ble 1 shows the data size and partitions for the ex-periments as well as the score distributions. An ASR partition (with 1538 responses) was created and used for training the speech recognition mod-els and was used also for our linguistic feature de-velopment. Trainwas used for cross validation ex-periments as well as for training a final model that was evaluated onEvalevaluation dataset. Quadratic Weighted Kappa (QWK) between human raters for Train is 0.69 and for Eval is 0.70. Responses con-taining anomalous test taker behavior (such as non-English responses or non-responses) and responses with severe technical difficulties (such as static or background noise) receive separate ratings and are excluded from this study. This filtering resulted in a total of 874 responses in Train and 672 responses in Eval data sets.
4 Features
We explore five different feature sets to help us an-swer the following questions about the response: Did the test taker construct a story about the pictures in the prompt (or did he/she produce an irrelevant re-sponse instead?) (Relevance); Did the test taker use words appropriately in the response? Proper usage of words and phrases is characterized by the proba-bilities of the contexts in which they are used (Col-location); Did the test taker adequately organize the narrative? (Discourse); Did the test taker enhance the narrative by including details (Detailing); and Did the test taker develop the story through expres-sion of emotion and character development? (Senti-ment)
4.1 Relevance
the overlap of the content of the response and the content of the pictures similar to (Somasundaran and Chodorow, 2014). To facilitate this, each prompt is associated with a reference corpus containing a de-tailed description of each picture, and also an overall narrative that ties together the events in the pictures. Each reference corpus was created by merging the picture descriptions and narratives that were gener-ated independently by 10 annotators.3 To calculate
overlap, stop words were first removed from lem-matized versions of the response and the reference corpus.
Because test-takers often use synonyms and other words related to the prompt, we expanded the con-tent words in the reference corpus by adding their synonyms, as provided in Lin’s thesaurus (Lin, 1998) and in WordNet, and also included their WordNet hypernyms and hyponyms. This gave us the following 6 features which measure the over-lap, or coverage, between the lemmatized response and the lemmatized (i) reference corpus (lemmas), (ii) reference corpus expanded using Lin’s the-saurus (cov-lin), (iii) reference corpus expanded us-ing WordNet Synonyms (cov-wn-syns), (iv) refer-ence corpus expanded using WordNet Hypernyms (cov-wn-hyper), (v) reference corpus expanded us-ing WordNet Hyponyms (cov-wn-hypo), and (vi) reference corpus expanded using all of the above methods (cov-all).
4.2 Collocation
Inexperienced use of language is often characterized by inappropriate combinations of words, indicating the writer’s lack of knowledge of collocations. In order to detect this, we calculate the Pointwise Mu-tual Information (PMI) of all adjacent word pairs (bigrams), as well as all adjacent word triples (tri-grams) in the Google 1T web corpus (Brants and Franz, 2006). The higher the value of the PMI, the more common is the collocation for the word pair/triple in well formed texts. On the other hand, negative values of PMI indicate that the given word pair or triple is less likely than chance to occur together. We hypothesized that this would be a good indicator of awkward usage, as suggested in 3We do not calculate agreement as producing different de-scriptions and having variety was the goal of the task of refer-ence corpus creation.
Chodorow and Leacock (2000).
The PMI values for adjacent words obtained over the entire response are then assigned to bins, with 8 bins for word pairs and another 8 for word triples following the procedure from (Somasundaran and Chodorow, 2014). Each of the 8 bins represents a range of PMI : p > 20,10 < p ≤ 20,1 < p ≤ 10,0 < p ≤ 1,−1 < p ≤ 0,−10 < p ≤ −1,−20< p≤ −10, p≤ −20.
We generate two sets of features based on the pro-portions of bigrams/trigrams falling into each bin, resulting in a total of 16 features. In addition to binning, we also encode as features the maximum, minimum and median PMI value obtained over all bigrams and trigrams. These encode the best and the worst word collocations in a response as well as the overall general quality of the response.
4.3 Discourse
Stories are characterized by events that are related (and ordered) temporally or causally. In order to form a coherent narrative, it is often necessary to use proper transition cues to organize the story. In-tuitively, coherent responses are more likely to have these cues than less coherent responses.
the response (temporalCuesScore), the sum of the probabilities of belonging to the causal category for each cue found in the response (causalCuesScore).
4.4 Detailing
We hypothesized that better responses would show evidence of effective narrative techniques, such as providing vivid descriptions of the events and pro-viding depth to the story. For example, one could say“In the afternoon a boy and a man went to the library.”, or make the story more interesting by as-signing names to the characters and places as“One day John went to the Central Public Library be-cause he wanted to do some research for his science project. An old man was walking behind him; his name was Peter. ”
We observed that certain syntactic categories, such as adjectives and adverbs, come into play in the process of detailing. Also, detailing by providing names to the characters and places results in a higher number of proper nouns (NNPs). Thus our detailing feature set consists of the following features: a bi-nary value indicating whether the response contains any proper nouns (presenceNames), the number of proper nouns in the response (countNames), a binary value indicating whether the response contains any adjectives (presenceAdj), the number of adjectives in the response (countAdj), a binary value indicat-ing whether the response contains any adverbs (pres-enceAdv), the number of adverbs in the response (countAdv). We use separate features for counts and presence of the syntactic category in order to balance the trade-off between sparsity and informativeness. The count features are more informative, but they can be sparse (especially for higher counts).
4.5 Sentiment
One common technique used in developing a story is to reveal the character’s private states, emotions and feelings. This requires the use of subjectivity and sentiment terms.
We use lexicons for annotating sentiment and subjective words in the response. Specifically, we use a sentiment lexicon (ASSESS) developed in pre-vious work in assessments (Beigman Klebanov et al., 2013) and the MPQA subjectivity lexicon (Wil-son et al., 2005). ASSESS lexicon assigns a pos-itive/negative/neutral polarity probability profile to
its entries, and MPQA lexicon associates a positive, negative or neutral polarity category to its entries. We consider a word from the ASSESS lexicon to be polar if the sum of positive and negative probabili-ties is greater than 0.65 (we arrived at this number after manual inspection of the lexicon). This gives us the subjectivity feature set comprised of the fol-lowing features: A binary value indicating whether the response contains any polar words from the AS-SESS lexicon (presencePolarProfile), the number of polar words from the ASSESS lexicon found in the response (cntPolarProfile), a binary value indicating whether the response contains any polar words from the MPQA lexicon (presenceMpqaPolar), the num-ber of polar words from the MPQA lexicon found in the response (cntMpqaPolar), a binary value indicat-ing whether the response contains any neutral words from the MPQA lexicon (presenceMpqaNeut), the number of neutral words from the MPQA lexicon found in the response (cntMpqaNeut).
We construct separate features from the ASSESS lexicon and the MPQA lexicon because we found that the neutral category had different meanings in the two lexicons – even the neutral entries in the MPQA lexicon are valuable as they may indicate speech events and private states (e.g. view, assess, believe, cogitate, contemplate, feel, glean, think etc.). On the other hand, words with a high prob-ability of being neutral in the ASSESS lexicon are non-subjective words (e.g. woman, undergo, entire, technologies).
5 Experiments
Feature set CV Eval
Relevance 0.43 0.46
Collocation 0.48 0.40
Discourse 0.25 0.27
Details 0.18 0.21
Subjectivity 0.17 0.16
EW13 baseline 0.48 0.52
All Feats 0.52 0.55
[image:5.612.346.508.64.156.2]All Feats + EW13 0.58 0.58
Table 2: Performance of different feature sets.
human-annotated score, correcting for chance agree-ment and penalizing large disagreeagree-ments more than small ones.
5.1 Baseline
We use the previous state-of-the-art features from Evanini and Wang (2013) as our baseline (EW13). They are comprised of the following subsets: flu-ency (rate of speech, number of words per chunk, average number of pauses, average number of long pauses), pronunciation (normalized Acoustic Model score, average word confidence, average differ-ence in phone duration from native speaker norms), prosody (mean duration between stressed syllables), and lexical choice (normalized Language Model score).
5.2 Results and Analysis
We performed cross validation on our training data (Train) and also performed training on the full train-ing dataset with evaluation on the Eval data. Table 2 reports our results on 10-fold cross validation ex-periments on the training data (CV), as well results when training on the full training dataset and test-ing on the evaluation dataset (Eval). The first 5 rows report the performance of the individual feature sets described in Section 4. Not surprisingly, each in-dividual feature set is not able to perform as well as the EW13 baseline, which is comprised of an ar-ray of many features that measures various speech characteristics. One exception to this is the colloca-tion feature set that performs as well as the EW13 baseline in the cross validation experiments. No-tably, the combination of all five feature sets pro-posed in this work (All Feats), performs better than the EW13 baseline, indicating that our relevance and
Feature set Performance
EW13 baseline 0.48
EW13 + Relevance 0.54
EW13 + Collocation 0.57
EW13 + Discourse 0.49
EW13 + Details 0.50
EW13 + Subjectivity 0.50
Table 3: Performance of the Baseline when each individ-ual feature set is added to it.
linguistic features are important for scoring for this spoken response item type. Finally the best perfor-mance is obtained when we combine our features with the speech-based features. This improvement of All Feats + EW13 over the baseline is statistically significant atp <0.01, based on 10K bootstrap sam-ples (Zhang et al., 2004). Somewhat surprisingly, the testing on the evaluation dataset showed slightly better performance for most types of features than the cross validation testing. We believe that this might be due to the fact that, for the Eval results, all the training data were available to train the scoring models.
We also performed analysis on the Train set to see if the baseline’s performance is impacted when each of our individual feature sets is added to it. As shown in Table 3, each of the feature sets is able to improve the baseline’s performance (of 0.48 QWK). Specifically, Discourse and Subjectivity produce a slight improvement while Relevance produces mod-est improvement. However, only the improvement produced by the Collocation features was statisti-cally significant (p <0.01)
6 Conclusions
[image:5.612.114.259.65.181.2]References
Yigal Attali and Jill Burstein. 2006. Automated essay scoring with e-rater v. 2.0. Journal of Technology, Learning, and Assessment, 4:3.
Beata Beigman Klebanov, Jill Burstein, and Nitin Mad-nani. 2013. Sentiment profiles of multi-word expres-sions in test-taker essays: The case of noun-noun com-pounds. In ACM Transactions on Speech and Lan-guage Processing, volume 10(3).
Gilbert J. Botvin and Brian Sutton-Smith. 1977. The de-velopment of structural complexity in children’s fan-tasy narratives. Developmental Psychology, 13(4):377 – 388.
Thorsten Brants and Alex Franz. 2006. Web 1T 5-gram Version 1. InLinguistic Data Consortium, Philadel-phia.
Martin Chodorow and Claudia Leacock. 2000. An unsu-pervised method for detecting grammatical errors. In Proceedings of the Conference of the North American Chapter of the Association of Computational Linguis-tics (NAACL), pages 140–147.
Jacob Cohen. 1968. Weighted kappa: Nominal scale agreement provision for scaled disagreement or partial credit. Psychological Bulletin, 70(4).
Rod Ellis. 2000. Task-based research and language ped-agogy. Language teaching research, 4(3):193–220. Keelan Evanini and Xinhao Wang. 2013. Automated
speech scoring for non-native middle school students with multiple task types. In Proceedings of Inter-speech, pages 2435–2439.
Keelan Evanini, Michael Heilman, Xinhao Wang, and Daniel Blanchard. 2014. Automated scoring for TOEFL Junior comprehensive writing and speaking. Technical report, ETS, Princeton, NJ.
KE Forbes-McKay and Annalena Venneri. 2005. De-tecting subtle spontaneous language decline in early Alzheimers disease with a picture description task. Neurological sciences, 26(4):243–254.
Khairun-nisa Hassanali, Yang Liu, and Thamar Solorio. 2013. Using Latent Dirichlet Allocation for child nar-rative analysis. InProceedings of the 2013 Workshop on Biomedical Natural Language Processing. Associ-ation for ComputAssoci-ational Linguistics.
Levi King and Markus Dickinson. 2013. Shallow seman-tic analysis of interactive learner sentences. In Pro-ceedings of the Eighth Workshop on Innovative Use of NLP for Building Educational Applications, pages 11–21, Atlanta, Georgia, June. Association for Com-putational Linguistics.
Claudia Leacock, Martin Chodorow, Michael Gamon, and Joel Tetreault. 2014. Automated Grammatical Er-ror Detection for Language Learners. Synthesis Lec-tures on Human Language Technologies. Morgan & Claypool.
Choonkyu Lee, Smaranda Muresan, and Karin Stromswold. 2012. Computational analysis of referring expressions in narratives of picture books. In Proceedings of the NAACL-HLT 2012 Work-shop on Computational Linguistics for Literature, pages 1–7, Montr´eal, Canada, June. Association for Computational Linguistics.
Dekang Lin. 1998. Automatic retrieval and cluster-ing of similar words. InProceedings of the 17th in-ternational conference on Computational linguistics-Volume 2, pages 768–774. ACL.
Anastassia Loukina, Klaus Zechner, and Lei Chen. 2014. Automatic evaluation of spoken summaries: the case of language assessment. InProceedings of the Ninth Workshop on Innovative Use of NLP for Building Edu-cational Applications, pages 68–78, Baltimore, Mary-land, June. Association for Computational Linguistics. Christopher Manning and Hinrich Sch¨utze. 1999. Foun-dations of Statistical Natural Language Processing. MIT Press.
Anne McKeough and Jennifer Malcolm. 2011. Stories of family, stories of self: Developmental pathways to in-terpretive thought during adolescence. New Directions for Child & Adolescent Development, 2011(131):59 – 71.
Rashmi Prasad, Nikhil Dinesh, Alan Lee, Eleni Milt-sakaki, Livio Robaldo, Aravind Joshi, and Bonnie Webber. 2008. The Penn Discourse Treebank 2.0. In Proceedings of the Sixth International Conference on Language Resources and Evaluation (LREC’08), Mar-rakech, Morocco, May. European Language Resources Association (ELRA).
Swapna Somasundaran and Martin Chodorow. 2014. Automated measures of specific vocabulary knowl-edge from constructed responses (use these words to write a sentence based on this picture). InProceedings of the Ninth Workshop on Innovative Use of NLP for Building Educational Applications, pages 1–11. Asso-ciation for Computational Linguistics.
Lei Sun and Marilyn A Nippold. 2012. Narrative writ-ing in children and adolescents: Examinwrit-ing the literate lexicon. Language, speech, and hearing services in schools, 43(1):2–13.
Theresa Wilson, Janyce Wiebe, and Paul Hoffmann. 2005. Recognizing contextual polarity in phrase-level sentiment analysis. InProceedings of the conference on Human Language Technology and Empirical Meth-ods in Natural Language Processing (HLT-EMNLP), pages 347–354. Association for Computational Lin-guistics.