Munich Personal RePEc Archive
Effect of consuming imported cultural
goods on trading partners’ tolerance
toward immigrants: The case of Japanese
anime in Korea
Yamamura, Eiji and Shin, Inyong
2 October 2015
1
Effect
of consuming imported cultural goods on trading partners’
tolerance toward immigrants: The case of Japanese anime in
Korea
Eiji Yamamuraa,, Inyong Shinb
aDepartment of Economics, Seinan Gakuin University, 6-2-92 Sawara-ku,
Nishijin, Fukuoka 814-8511, Japan
b Department of Economics, Asia University, 5-24-10 Musashi-Sakai, Tokyo
180-8629, Japan
Abstract
The consumption of imported goods is thought to influence consumers’ views and
attitudes toward export countries. It is important to consider this issue especially when there is political tension and conflict between countries. Because of this historical background, political conflict exists between Korea and Japan. This paper examines the effect of viewing Japanese anime (animation) on the attitudes of Koreans toward Japanese living in Korea. The major findings of the study show that the more frequently adult Koreans view Japanese anime, the more likely they are to accept Japanese as workplace colleagues and neighbors after controlling for endogeneity bias using instrumental variables. The findings of this paper imply that via the consumption of imported cultural goods, people are exposed to positive traits of the trading partner, and thus consumers have a stronger affinity with the export country. From this, we derive the policy implication that promoting trade of modern cultural goods is effective to increase mutual understanding between trade partners, reducing political tension between them.
JEL classification: D12, D74, F16, Z11, Z18
Keywords: Anime; Immigrants; Workplace; Neighbor; Trade; Externality; Cool Japan.
Tel: 81-92-823-4543, Fax: 81-92-823-2506
2
1. Introduction
Globalization through international trade, migration, and internet communication has
drastically changed modern society. The principle of traditional economics tells us that
international trade leads to an increase in mutual benefits between trade partners.
However, we observe a lot of conflicts between people with different values and different
historical and cultural backgrounds. As a consequence of globalization, frictions and
tensions between people can increase, which then acts to reduce any trade benefits.
Therefore, an increasing number of studies have investigated international trade by
incorporating cultural factors (e.g., Francois and van Ypersele, 2002; Bala and van Long,
2005; Janeba, 2007; Olivier et al., 2008). According to Rauch and Trinidad (2009), people
enjoy an intrinsic consumption value of imported cultural goods, which leads to an
increase in welfare in the short run. However, the importation of cultural goods leads to
cultural stagnation, which results in a decrease in welfare in the long run. Further,
globalization increases the anti-foreigner sentiment held by people who compete with
immigrants in the labor market (Gang et al., 2013)1. That is, globalization seems to cause
a negative externality. However, it is not only an increase in competition that affects
people’s perceptions toward immigrants; other factors such as social background and
identity also play a role in immigration-related issues (Epstein and Gang, 2010;
Abdulloev et al., 2014). One way to decrease conflict and tension is to reduce the level of
information asymmetry among people, as they can be misled by preconceived notions
about others, which leads to intolerance. Mutual understanding is important to reduce
1 Natives consider immigrant neighbors relatively less attractive, and immigrant
3
information asymmetry. According to the contact hypothesis, frequency of contact with a
minority is thought to alleviate tension between the minority and majority (Rothbart and
John, 1993)2.
Even in the age of globalization, to gain the mutual benefit of international labor
mobility it is important to consider not only the economic condition but also the social
and historical backgrounds between countries. People’s attitudes toward immigrants, to a
certain extent, depend on the political relationship between countries. In the workplace,
whether a migrant’s contribution is equivalent to the level expected of them depends on
the relationships and attitudes in the workplace. Even if migrants are sufficiently able and
diligent, their contribution is considered below the level expected of them when native
co-workers do not cooperate with them. Furthermore, people’s attitudes toward
immigrants are reflected in immigration policy and then in the openness of the labor
market. Regarding economic factors, education level is considered a critical determinant
of people’s attitudes (Sheve and Slaughter, 2001; Mayda, 2006). As for non-economic
factors, social and cultural prejudices are considered factors that determine the attitude
toward immigrants (Dustmann and Preston, 2007).
Koreans may have anti-Japanese sentiments partly because Korea was annexed to
Japan between 1910 and 1945 and endured severe hardship3. Because of this historical
background, political conflict exists between Korea and Japan. For instance, there is a
territorial dispute over the island of Tokdo (Takeshima). However, the Korean (Japanese)
negative attitude toward Japan (Korea) possibly leads to fewer economic benefits. The
2 A higher concentration of individuals of an ethnic minority results in the majority
population having a hostile attitude towards them (e.g., Dustmann and Preston, 2001; Gang et al., 2013). On the other hand, the probability of being racially harassed is found to be lower in areas with larger minority populations (Dustmann and Preston, 2011).
3 During the war, a number of Koreans were forced to come and work in Japan; they were
4
Japanese (Korean) popular culture industry is commonly called “Cool Japan (Korea)” and
has received increasing attention in economic policy. The consumption of cultural goods
can influence society’s attitude (Cheng, 2006). For example, a Chinese man uses “Cool
Japan” to promote friendship between Japan and China. He feels an affinity with Japan
through his viewing of Japanese anime although he does not live in Japan. Furthermore,
via his business he is connected to Japanese partners (Nihon Keizai Newspaper, 2013).
Thus, the role of policy regarding “Cool Japan” should be considered from a long-term
perspective. First, it is plausible that watching anime teaches foreigners about Japanese
society and therefore allows them to understand Japanese people better. That is, the
international trade of cultural goods is expected to create a ripple effect between trading
partners by enhancing mutual understanding. Fans of Japanese anime feel goodwill
toward Japanese people because of the positive association with a product they enjoy.
Therefore, a policy of promoting “Cool Japan” encourages foreigners to access
entertainment from Japan (e.g., manga and anime), which improves their impression of
Japanese people.
There are a number of economic studies dealing with modern cultural goods (e.g.,
Belk, 1987; Dewally and Ederington, 2006; Wyburn and Roach, 2012). From an
international economic viewpoint, Disdier, Tai et al. (2010) investigated the international
trade of cultural goods. Disdier, Head et al. (2010) provided empirical evidence that
exposure to foreign names through imported cultural goods such as movies, television,
and music influences the choice of their baby’s name by parents in France. Maystre et al.
(2014) empirically examined how international trade changed subjective values in import
and export countries. Based on data on the openness of bilateral trade (Disdier, Tai et al.,
5
trade is positively associated with cultural distance between the countries, implying that
international trade causes subjective values to become more similar between countries.
With respect to international labor mobility, the attitude toward immigrants or foreigners
has been increasingly analyzed from an economic viewpoint (e.g., Mayda, 2006,
Dustmann and Preston, 2007, Constant et al., 2009, Faccini and Mayda, 2009, Fertig and
Schmidt, 2011, Akai et al., 2014, Faccini and Mayda, 2012, Faccini et al., 2013). However,
no studies have examined how international trade in cultural goods influences people’s
attitude toward their trade partners. The value of this paper is that it is the first to
investigate how and the extent to which the international trade of modern cultural goods
influences people’s perceptions. To this end, we explore the effect of Koreans’
consumption of Japanese anime on their attitude toward Japanese people. The key
findings are as follows: Koreans who frequently view Japanese anime are more likely to
accept Japanese people as workplace colleagues and neighbors.
The remainder of this paper is organized as follows. Section 2 provides an explanation
regarding data and the empirical method used. Section 3 presents the estimation results
and their interpretation. The final section offers some conclusions.
2. Data and Methods
2.1. Data
This paper used individual-level data from the 2008 Korea General Social Survey
(KPSS) conducted by the Survey Research Center of Sungkyunkwan University. The
KPSS used a two-stage stratified sampling method and was conducted throughout Korea
in 2008. The 2008 KPSS questionnaire included a question on the consumption of cultural
6
concerning individuals’ characteristics via face-to-face interviews. In the sample used for
the estimation, respondents’ ages ranged between 18 and 91 years. The data cover
information related to marital and demographic (age and gender) status, annual household
income, and years of schooling. Additionally, respondents were asked how many children
they had and their ages.
Concerning the key variable, the survey question asked, “How often do you watch
Japanese anime?” Respondents could choose one of four responses: “1 (Not at all),” “2
(Seldom),” “3 (Sometimes),” and “4 (Often)”. The frequency distribution of watching
anime is illustrated in Figure 1, showing that almost half of the respondents watch no
Japanese anime at all. There is wide variation in the viewing of Japanese anime.
2.2. Preliminary observations
Table 1 exhibits the definitions and basic statistics of the variables used in this paper.
Koreans’ perceptions toward Japanese people are captured by three different dummy
variables: JP_workplace (JP_neighbor or JP_family). Perceptions toward Japanese as
workplace colleagues is JP_workplace; perceptions toward Japanese as neighbors is
JP_neighbor; and perceptions toward Japanese as relatives is JP_family. Table 1 shows
that nearly 80% of Koreans accept Japanese as workplace colleagues and neighbors. Even
though the mean value of JP_family is smaller than JP_workplace and JP_neighbor, 65%
of Koreans accept Japanese as relatives. The consumption level of imported cultural
goods is captured by Frequency of anime view, which ranges from 0 to 4. The mean
frequency of watching Japanese anime is 1.82. An alternative variable, Dummy Anime, is
0.49, suggesting that almost half of the respondents have watched Japanese anime. As
7
Frequency of anime view (Dummy Anime). These instrumental variables are measures of
children. For instance, number of children aged below 12 years (Child_12) and number
of children aged below 18 years (Child_18) are used as instrumental variables. As can be
seen in Table 1, the mean values of Child_12 and Child_18 are 0.49 and 0.80, respectively.
Their maximum and minimum values are 4 and 0, respectively. Figures 2 (a) and (b)
demonstrate that the distribution of those who have young children is skewed toward 0.
Table 2 shows the correlation matrix of the key variables. Significant positive
correlations are observed among JP_workplace, JP_neighbor, and JP_family, which is
convincing. Anime view is positively correlated with JP_workplace (JP_neighbor and
JP_family), and is statistically significant. Therefore, those who view Japanese anime
more frequently tend to be more tolerant toward Japanese people in various situations.
However, the causality between Anime view and perceptions toward Japanese people is
unknown. The causality is scrutinized in the regression estimation reported in the
subsequent section. The correlation between perceptions toward Japanese people and
anime viewing is discussed in the following subsection. Interestingly, Internet is
positively correlated with JP_workplace,JP_neighbor, and JP_family. Our interpretation
is as follows: via the internet, information can be obtained from both domestic sources
and from other countries. Therefore, people’s views regarding Japan are based on various
forms of information about Japan, even if domestic information tends to be negative.
Hence, people who obtain information from the internet are more likely to accept
Japanese people.
8
The estimated function of the baseline model takes the following form:
JP_workplacei (JP_neighbor or JP_family) = 1 Frequency of anime view (or Dummy
Anime)i + 2Family memberi + 3 TV i + 4 Interneti + 5School i + 6Incomei +
7Employi + 8Agei + 9Marryi + 10Malei +Xi+ ui,
where JP_workplacei (JP_neighbor or JP_family)i represents the dependent variable for
individual i. As is exhibited in definition of Table 1, the dependent variable is a dummy,
which takes the value of 1, otherwise 0. Hence, a probit model is used for the estimation.
Regression parameters are represented by . The error term is represented by ui. There
are political issues between Korea and Japan that influence whether Koreans accept
Japanese people in Korean society. X represents vectors of variables to capture an
individual’s political orientation4. Furthermore, there could be historical reasons why
various regions are affected in different ways by the former Japanese occupation. It seems
plausible that rural residents have both less exposure to anime and more hostility toward
Japan. In this case, observations can be grouped into clusters of geographical regions,
with model errors uncorrelated across clusters but correlated within clusters. Then, model
errors for individuals in the same region may be correlated, while model errors for
individuals in different regions are assumed to be uncorrelated. Failure to control for
within-cluster error correlation can lead to small standard errors, which lead to large
z-values. In the dataset, there is information about respondents’ residential areas. Therefore,
4 A set of dummy variables is included to control for respondents’ political orientations.
9
for the purpose of estimations, standard errors clustered by residential area are used for
the calculation of z-values5. Frequency of anime view (or Dummy Anime) is the key
variable for examining the effect of viewing Japanese anime on perceptions toward
Japanese people in various situations.
TV and Internet capture the effect of media providing information about international
issues and therefore Japan. If media information increases (decreases) the anti-Japanese
sentiment, people’s perceptions toward Japanese are more intolerant (tolerant). Korean
people can obtain information with various viewpoints about Japanese via the internet
because information is posted not only from Korea but also from the rest of the world.
Additionally, household income, schooling years, job status, age, marital status, and
gender differences are used to capture individual-level economic and social conditions.
The age effect is thought to be non-linear. Therefore, dummy variables such as Age_20
and Age30_39 are used to capture the effect of age6.
2.4. Instrumental variables
It seems that Koreans who feel comfortable with Japanese people are more likely to
prefer Japanese culture and therefore view Japanese anime. Even if various control
variables are incorporated, unobservable individual characteristics that influence feelings
toward Japanese people cannot be controlled for. That is, feelings are considered to be
included in the error term, which is correlated with Frequency of anime view (key
independent variable). Hence, endogenous bias naturally arises. To control for such bias,
5 In the dataset, residential areas can be divided into 200 blocks. In the case that dummies to capture residential area are included, the maximum likelihood calculation used for the probit and IV probit models fails to converge, and so estimation results cannot be obtained.
6 We attempted to incorporate additional dummies capturing those aged in their 40s, 50s,
10
this paper used an instrumental variables (IV) probit model. Yamamura (2014) used
Japanese data to show that people are more likely to watch anime when they have children
aged younger than 12 years who have not yet entered junior high school. Young children
are more likely to interact with their parents. For instance, children cannot go to the movie
theater to see anime by themselves, so they ask their parents to go with them to the theater.
As a consequence, their parents watch anime films even if they are not interested in that
genre. After controlling for age of respondents, perceptions about Japanese people are
unlikely to be related to whether respondents have young children7, 8. Hence, family
structure is appropriate as an instrumental variable for frequency of viewing Japanese
anime. Table 2 shows the significant positive correlation between Child_12 (Child_18)
and Frequency of anime view, which is consistent with Yamamura (2014). In contrast,
there is no significant correlation between Child_12 and JP_workplace (JP_neighbor and
JP_family). Child_18 is not significantly correlated with JP_workplace (JP_family)
although Child_18 and JP_neighbor are positively and significantly correlated. In this
paper, various sets of instrumental variables are used to check the appropriateness of the
approach and the robustness of the results. In the first specification, the number of
respondents’ children younger than 12 years of age and its square are used as instrumental
variables because the effect of the number of young children is not thought to be linear.
However, Child_12 excludes children in their early teens, who might have been watching
7 People from lower socioeconomic levels of society tend to have more children and also tend
to have a less international outlook. For instance, social conservatives might also tend towards having more children and a more nationalist outlook. These characteristics are mostly controlled for by education, income, and a set of political variables.
8 The respondents’ ages are thought to be negatively related with the number of young
11
with their parents for the past five years. It is necessary to examine how the results of the
first specification hold up if the cutoff age for children is raised. In the second
specification, the number of respondents’ children younger than 18 years of age and its
square are used as instrumental variables. Furthermore, given the distribution of the
number of children and the propensity to watch anime variables, collapsing these
variables to dummies of 0 or 1 is valuable for conducting estimations. Therefore, in the
third specification, the key independent variable is Dummy Anime and its instrumental
variables are Dummy Child_12 and Dummy Child_13_18 (see Table 1 for definitions).
3. Estimation Results and Discussion
3.1. Estimation results
The estimation results of the probit model are presented in Tables 3 and 4. The results
of the IV probit model are shown in Tables 5(a), 5(b), and 6. The results for the control
variables are shown in Table 3 but are not shown in the other tables to maintain focus on
the results of the key variables. The set of independent variables and the number of
observations are the same as those in the corresponding columns of Table 3. The values
without parentheses show the marginal effects. Results for JP_Workplace, JP_neighbor,
and JP_family are shown in columns (1)–(3), (4)–(6), and (7)–(9), respectively. In
columns (1), (4), and (7), the full sample is used for estimations. Concerning
JP_Workplace,unemployed people are less likely to be able to imagine the workplace
situation, hence the sample should be limited to employed workers. For consistency,
estimations for JP_neighbor and JP_family have been arrived at based on the subsample
12
columns (2), (5), and (8). Instrumental variables are not useful for unmarried people, who
are unlikely to have a child. However, unmarried people who watch anime might be more
inclined to be accepting of a Japanese relative, although this will not be picked up under
the current specification. Hence, unmarried people should not be included in the sample.
Accordingly, a subsample of employed workers who are married is used for estimations,
and the results are presented in columns (3), (6), and (9).
It can be seen from Table 3 that the coefficient of Frequency of anime view is positive
and statistically significant at the 1% level in all columns. That is, those who frequently
view Japanese anime are more likely to accept Japanese people in various situations in
Korean society. Furthermore, the marginal effects of Anime view range from 0.04 to 0.07,
suggesting that a one-point increase on the four-point scale increases the probability that
Koreans will accept Japanese people in daily life by 4–7%. Concerning Internet, the
coefficient is positive and statistically significant when the dependent variable is
JP_workplace or JP_neighbor. Hence, those who use the internet as their main source of
international news tend to accept Japanese people as colleagues at work or as neighbors.
Information from beyond domestic media sources is thought to provide more positive
information about Japan than domestic media, and plays a role in Koreans accepting
Japanese people. The coefficient of School is positive and statistically significant with the
exception of column (3). Hence, those with a higher level of education tend to accept
Japanese people in various situations. Education is considered to remove any negative
bias toward Japanese people. The coefficient of Employ is statistically significant and
negative in columns (1), (4), and (7); this suggests that Japanese people are considered to
be competitors by Korean employees in the labor market. Inevitably, Korean workers are
13
according to the dependent variables and is not statistically significant, with the exception
of columns (5) and (6).
In Table 4, Dummy Anime is positive and statistically significant in all columns.
Furthermore, its marginal effect ranges from 0.09 to 0.16. This can be interpreted as
implying that Koreans who have watched Japanese anime are 9–16% more likely to
accept Japanese people in daily life than those who have never watched it.
Tables 5(a) and 5(b) show the effect of Frequency of anime view after controlling for
endogenous bias. Instrumental variables are Child_12 and its square in Table 5(a) and
Child_18 and its square in Table 5(b). We begin by looking at the results of Table 5(a).
The first-stage estimation, the coefficient of Child_12, is positive and that for Child2 is
negative; both are statistically significant at the 1% level in all columns. This implies that
the presence of children encourages parents to view Japanese anime. However, this effect
decreases as the number of children increases. This is consistent with the finding of
Yamamura (2014). An overidentification test provides a method to test for exogeneity in
instrumental variables. Test statistics are not significant in any columns in Table 5(a), and
thus do not reject the null hypothesis that the instrumental variables are uncorrelated with
the error term. This suggests that the instrumental variables are valid. Concerning the
results of the second stage, Frequency of anime view shows a positive sign in all columns
in Table 5(a). Further, Frequency of anime view is statistically significant with the
exception of column (4) of Table 5(a) when JP_workplace and JP_neighbor are the
dependent variables. Conversely, Frequency of anime view is not significant in any
columns when JP_family is the dependent variable. In other words, frequent viewing of
Japanese anime leads Korean people to accept Japanese people as workplace colleagues
14
JP_workplace is between 0.19 and 0.23, which means that a one-point increase in viewing
Japanese anime on the four-point scale leads to a 19–24% increase in the probability that
Koreans will accept Japanese people as workplace colleagues. The marginal effect of
Frequency of anime view on JP_ neighbor is 0.20, which suggests that a one-point
increase in viewing Japanese anime increases the probability that Korean people will
accept Japanese people as neighbors by 20%. The effects of Frequency of anime view are
approximately four to five times larger than those estimated by the probit model presented
in Table 3. There are some respondents who are comfortable with Japanese people, even
though such feelings cannot be observed. Inevitably, this positive feeling is included in
the error term, even though various control variables are incorporated. Koreans’ positive
feelings toward Japanese people are thought to be related to watching Japanese anime.
There is a positive correlation between Frequency of anime view and the error term. Based
on this assumption, the marginal effect of Frequency of anime view obtained from the
probit model is smaller than that obtained from the IV probit model. The results shown
in Table 5(b) are similar to those shown in Table 5(a), indicating that the results shown in
Table 5(a) are robust when different instrumental variables are used.
Turning to the results shown in Table 6, Dummy Anime is positive and statistically
significant with the exception of column (1) when JP_workplace and JP_neighbor are
the dependent variables. Conversely, it is not significant when JP_family is the dependent
variable. Furthermore, its marginal effect is around 0.35 in columns (1)–(6). This can be
interpreted as implying that Koreans who have watched Japanese anime are
approximately 35% more likely to accept Japanese people as workplace colleagues or
neighbors than those who have never watched it. The marginal effect of Dummy Anime
15
(probit model). The results shown in Tables 4 and 6 are similar to those shown in Tables
3, 5(a), and 5(b). In addition, Tables A1(a)–A2 in the Appendix show results using the
linear 2SLS model, and they are consistent with those presented in Tables 3–6. All in all,
the results shown in the tables suggest that the estimation effect of watching anime on the
degree to which Koreans accept Japanese people is robust.
From the findings suggested thus far, we derive the following argument: As a whole,
the consumption of imported cultural goods improves the views held by consumers, as
trading partners, toward immigrants. Therefore, promoting the trade of cultural goods is
an effective method to accelerate efficient labor mobility between countries by improving
perceptions and views regarding trading partners.
4. Conclusions
Attitudes toward immigrants appear to be influenced not only by economic factors
but also by historical and cultural backgrounds. Does the consumption of imported
cultural goods work to change perceptions and attitudes of a trading partner toward
immigrants? Does interaction via the trade of cultural goods reduce international friction
and in turn open the labor market? In other words, does the trade of cultural goods produce
an externality to enhance international labor mobility? This point has not been sufficiently
explored thus far, although a number of studies have investigated how international trade
changes people’s subjective values and preferences (e.g., Olivier et al., 2008; Disdier,
Head et al. 2010; Maystre et al. 2014). This paper attempts to empirically deal with this
issue by examining the effect of Koreans’ viewing Japanese anime on their attitudes
toward Japanese living Korea.
16
Japanese anime, the more likely they are to accept Japanese as colleagues at work, as
neighbors, and as close relatives (by marriage). However, after controlling for
endogeneity bias using instrumental variables, the effect disappears for the acceptance of
Japanese as close relatives. In contrast, the effect of viewing anime continues to
encourage Koreans to be more tolerant toward Japanese as workplace colleagues and
neighbors.
Thus, via the consumption of imported cultural goods, Koreans feel more familiar
with Japanese and the barrier toward Japanese is lowered. However, relationships within
workplaces and/or among neighbors are weaker than those among relatives. Therefore,
the externality of cultural goods is restricted to the workplace and community. Even so,
modern cultural goods such as Japanese anime representing “Cool Japan” play a role in
strengthening ties between Korea and Japan to create an open labor market. Consequently,
the key policy implication from this paper is the importance of promoting the international
trade of modern cultural goods to reduce psychological barriers toward immigrants held
by trading partners. In doing so, the benefit of international trade will increase. What has
been thus far observed and argued suggests promising policy implications from
promoting the export of cultural goods.
However, it is worth conducting further robustness checks of the results in this paper.
For instance, if there is information about viewing American drama series, researchers
can regress the attitude variables toward Japanese people in Korea on viewing American
drama series with or without Japanese anime in the right-hand side. Further surveys
should be conducted to collect such information. Both Korea and Japan are East Asian
countries, and their people share many similarities in terms of their social and cultural
17
countries with different social and cultural backgrounds. It is thus worthwhile
investigating how international trade between Eastern and Western countries influences
people’s views about immigrants from their country’s trade partners by using
cross-country data. Further, this paper does not suggest a theoretical framework to support the
hypothesis. Therefore, to understand the mechanism behind this paper’s finding, a
18
References
Abdulloev, I. Epstein, G.S., Gang, I.N, (2014). Ethnic goods and immigrant assimilation.
IZA discussion paper 8004.
Akai, A., Constant, A., Giulietti, C. (2014) The impact of immigration on the well-being
of natives. Journal of Economic Behavior and Organization, 103, 72–92.
Belk, R.W. (1987). Material values in the comics: a content analysis of comic books
featuring themes of wealth. Journal of Consumer Research, 14(1), 26–42.
Bala, V., Van Long, N. (2005). International trade and cultural diversity with preference
selection. European Journal of Political Economy, 21(1), 143–162.
Cheng, S.W. (2006). Cultural goods creation, cultural capital formation, provision of
cultural services and cultural atmosphere accumulation. Journal of Cultural
Economics, 30(4), 263–286.
Constant, A.F., Kahanec, M., Zimmermann, K.F. (2009). Attitudes towards immigrants,
other integration barriers, and their veracity: introduction. International Journal of
Manpower,30(1–2), 5–14.
Dustmann, C., Preston, I. (2001). Attitudes to ethnic minorities, ethnic context and
location decisions. Economic Journal, 111, 353–373.
Dustmann, C., Preston, I. (2007). Racial and economic factors in attitudes to immigration.
The B.E. Journal of Economic Analysis and Policy, 7(1), 1–41.
Dustman, C., Fabbri, F., Preston, I. (2011). Racial harassment, ethic concentration, and
economic conditions. Scandinavian Journal of Economics, 113, 689–711.
Dewally, M., Ederington, L. (2006) Reputation, certification, warranties, and information
19
book market. Journal of Business, 79(2), 693–729.
Disdier, A.C., Head, K., Mayer, T. (2010). Exposure to foreign media and changes in
cultural traits: evidence from naming parents in France. Journal of International
Economics, 80, 226–238.
Disdier, A.C., Tai, S., Fontage, L., Mayer, T. (2010). Bilateral trade of cultural goods.
Review of World Economics, 145(4), 575–595.
Epstein, G.S., Gang, I.N. (2010). Migration and culture. Chapter 1 in G.S. Epstein & I.N.
Gang (eds.) Migration & Culture (Frontiers of Economics & Globalization, Volume
8), Emerald Group Publishing Limited: New York, 1–21.
Faccini, G., Mayda, A.M. (2009). Individual attitudes towards immigration: welfare state
determinants across countries. Review of Economics and Statistics, 91(2), 295–314.
Faccini, G., Mayda, A.M. (2012). Individual attitudes towards skilled migration: an
empirical analysis across countries. The World Economy,35(2), 183–196.
Faccini, G., Mayda, A.M., Mendola, M. (2013) What drives individual attitudes towards
immigration in South Africa? Review of International Economics, 21(2), 326–341.
Fertig, M., Schmidt, C. (2011). Attitudes towards foreigners and Jews in Germany:
identifying the determinants of xenophobia in a large opinion survey. Review of
Economics of Household,9(1), 99–128.
Francois, P., van Ypersele, T. (2002). On the protection of cultural goods. Journal of
International Economics, 56, 359–369.
Gang, I N., Rirvera-Batiz, F.L., Yun, M. (2013). Economic strain, education and attitudes
towards foreigners in the European union. Review of International Economics, 21(2),
177–190.
20
Economic Review, 51(4), 781–803.
Mayda, A.M. (2006). Who is against immigration? a cross-country investigation of
individual attitudes toward immigrants.Review of Economic and Statistics, 88, 510–
530.
Maystre, N., Olivier, J., Thoenig, M., Verdier, T. (2014). Product-based cultural changes:
is the village global? Journal of International Economics, 92, 212–230.
Nihon Keizai newspaper. (2013). Otaku plays a role in promoting friendly relationship
between Japan and China. December 22, 2013. Nihon Keizai Newspaper.
Olivier, J., Thoenig, M., Verdier, T. (2008). Globalization and the dynamics of cultural
identity. Journal of International Economics, 76, 35–370.
Rauch, J., Trinidade, V. (2009). Neckties in the tropics: a model of international trade and
cultural diversity. Canadian Journal of Economics, 42(3), 80–843.
Rothbart, M., John, O.P. Immigration and race; recent trends. in: B. Edmondston, and J.S.
Passel (eds), Immigration and Ethnicity: The Integration of America’s Newest
Immigrants. Washington D.C.: Urban Institute Press.
Saiz, A., Wachter, S. (2011). Immigration and the neighborhood. American Economic
Journal: Economic Policy,3, 169–188.
Wyburn, J., Roach, P. (2012). A Hedonic Analysis of American Collectable Comic-Book
Prices. Journal of Cultural Economics, 36(4), 309–326.
Yamamura, E. (2014). The effect of young children on their parents' anime viewing
habits: evidence from Japanese micro data. Journal of Cultural Economics, 38(4),
21
Table 1. Definition of variables and descriptive statistics.
Definition Mean Mini Max
JP_workplace Takes 1 if respondent accepts Japanese as colleagues at work, otherwise 0
0.80 0 1
JP_neighbor Takes 1 if respondent accepts Japanese as neighbors, otherwise 0
0.84 0 1
JP_family Takes 1 if respondent accepts Japanese as close relatives by marriage, otherwise 0
0.65 0 1
Frequency of anime view
Frequency of watching Japanese anime: Respondents were given four response options:
“1 (Not at all),” “2 (Seldom),” “3 (Sometimes),” and “4 (Often)”
1.82 1 4
Dummy Anime Takes 1 if respondent has watched Japanese anime, otherwise 0
0.49 0 1
Child_12 Number of children aged less than 12 years 0.49 0 4
Child_18 Number of children aged less than 18 years 0.80 0 4
Dummy Child_12
Takes 1 if respondent has child below 12 years old, otherwise 0
0.31 0 1
Dummy Child_13_18
Takes 1 if respondent has child between 13 and 18 years old, otherwise 0
0.23 0 1
Family member
Number of family members 3.00 1 9
TV Takes 1 if source of international news is TV, otherwise 0
0.79 0 1
Internet Takes 1 if source of international news is internet, otherwise 0
0.46 0 1
School Years of schooling 12.4 0 21
Income Total monthly household income
(1,000,000 Won)
3.69 0 73
Employ Takes 1 if respondent is currently employed,
otherwise 0
0.56 0 1
Age_29 Takes 1 if respondent is aged below 29, otherwise
0
0.19 0 1
Age30-39 Takes 1 if respondent is aged between 30 and 39,
otherwise 0.
0.24 0 1
Marry Takes 1 if respondent is currently married,
otherwise 0
0.45 0 1
Male Takes 1 if respondent is male, otherwise 0 0.65 0 1
Ideology_2
Political ideology ranges between 1(very liberal) and 5(very conservative)
22
otherwise 0
Ideology_3 Takes 1 if respondent’s political ideology is 3,
otherwise 0
0.34 0 1
Ideology_4 Takes 1 if respondent’s political ideology is 4,
otherwise 0
0.30 0 1
Ideology_5 Takes 1 if respondent’s political ideology is 5,
otherwise 0
0.05 0 1
Vote Takes 1 if respondent voted in presidential election
in 2007, otherwise 0
0.77 0 1
23
Table 2. Correlation matrix of key variables.
JP_workplace JP_neighbor JP_family Frequency
of anime view
Child12 Child18 TV Internet
JP_workplace 1.00
JP_neighbor 0.64***
(0.00)
1.00
JP_family 0.44***
(0.00) 0.47*** (0.00) 1.00 Frequency of anime view 0.18*** (0.00) 0.17*** (0.00) 0.15*** (0.00) 1.00
Child_12 0.01
(0.69) 0.01 (0.69) -0.01 (0.69) 0.13*** (0.00) 1.00
Child_18 0.04
(0.11) 0.06** (0.02) -0.0001 (0.98) 0.12*** (0.00) 0.77*** (0.00) 1.00
TV −0.01 (0.61) −0.02 (0.30) −0.03 (0.19) −0.10*** (0.00) 0.001 (0.94) 0.02 (0.50) 1.00
Internet 0.20***
(0.00) 0.19*** (0.00) 0.15*** (0.00) 0.35*** (0.00) 0.11*** (0.00) 0.11*** (0.00) -0.19*** (0.00) 1.00
24
Table 3. Estimation results of probit model.
JP_workplace JP_neighbor JP_family
(1) Full sample (2) Subsample of employees (3) Subsample of married employees (4) Full sample (5) Subsample of employees (6) Subsample of married employees (7) Full sample (8) Subsample of employees (9) Subsample of married employees Frequency of anime view 0.05*** (3.48) 0.07*** (4.03) 0.07*** (3.17) 0.04*** (3.72) 0.05*** (3.69) 0.05*** (3.02) 0.05*** (3.32) 0.07*** (3.67) 0.05** (2.37) Family member −0.01
(−1.45) −(−0.87)0.01 −(−0.350.01 )
−0.01
(−1.10) −(−0.52)0.01 0.002 (0.17)
−0.03***
(−2.92) −(−2.28)0.03** −(−1.530.02 )
TV 0.04
(1.55) 0.03 (1.15) 0.01 (0.24) 0.02 (0.89) 0.02 (0.67) −0.01 (−0.43)
0.01 (0.26)
0.02 (0.68)
−0.004 (−0.09)
Internet 0.09***
(3.52) 0.08*** (2.73) 0.08** (2.51) 0.07*** (3.56) 0.08*** (3.10) 0.08*** (2.89) 0.06** (2.10) 0.05 (1.41) 0.05 (1.17)
School 0.01***
(4.08) 0.01** (1.99) 0.01 (1.45) 0.01*** (3.74) 0.01** (2.07) 0.01* (1.72) 0.01*** (3.77) 0.01*** (2.79) 0.01** (2.00)
Income 0.03
(1.01) 0.01 (0.44) 0.03 (0.70) 0.04 (1.28) 0.03 (0.86) 0.04 (0.97) 0.05 (1.15) 0.13* (1.93) 0.15* (2.09)
Employ −0.05**
(−2.31) −0.05*** (−2.79) −0.05* (−1.92)
Single 0.01
(0.37) −0.01 (−0.24) −0.01 (−0.32) −0.10 (−1.53) 0.03 (0.54) 0.01 (0.13)
Age_29 −0.06
(−1.55) −0.12** (−2.16) −0.06 (−0.67) −0.04 (−0.95) −0.04 (−0.78) 0.02 (0.33) −0.09 (−1.60) −0.09 (−1.38) −0.14 (−1.25)
Age30-39 −0.03
(−1.31) −(−1.26)0.04 −0.04(−1.13)
−0.05**
(−2.07) −(−1.40)0.04 −(−1.310.04 )
−0.04
(−1.20) −(−1.18)0.05 −(−0.530.02 )
Marry −0.001
(−0.03)
−0.06 (−1.49)
−0.06
(−1.53) (−0.38)−0.01
−0.07* (−1.82) −0.07** (−1.96) 0.01 (0.31) −0.01 (−0.20) −0.001 (−0.02)
Male −0.01
(−0.76) −(−0.64)0.01 −(−0.38)0.01
−0.01
(−1.17) (−1.88)−0.03* −(−2.390.05** )
25
Ideology_2 0.03
(0.67)
0.08 (1.20)
0.10 (1.17)
0.01 (0.33)
−0.03
(−0.43) −(−0.13)0.01 0.05 (0.76)
−0.05
(−0.51)
−0.02 (−0.22)
Ideology_3 0.04
(0.78)
0.07 (1.10)
0.09 (1.05)
−0.04
(−0.90) −(−0.95)0.08 −(−0.53)0.05 0.01 (0.13)
−0.06 (−0.63)
−0.02 (−0.23)
Ideology_4 −0.02
(−0.48) (0.21) 0.01
0.01 (0.16)
−0.09*
(−1.83) −(−1.33)0.12 −(−0.88)0.09 −(−1.04)0.06 −(−1.650.16* )
−0.12
(−1.07)
Ideology_5 −0.02
(−0.43) −(−0.17)0.01 0.01 (0.08)
−0.05
(−0.83) −(−0.89)0.09 −(−0.45)0.04 −(−1.80)0.16* −(−1.90.26* 0)
−0.20
(−1.32)
Vote 0.03
(1.11)
0.003 (0.11)
−0.02
(−0.69) 0.01 (0.67)
0.01 (0.39)
0.001 (0.04)
0.07** (2.26)
0.07* (1.71)
−0.004
(−0.04) Wald statistics 160.0 95.7 81.6 166.4 109.4 87.6 147.0 101.1 60.7
Observations 1461 859 690 1461 859 690 1461 866 690
Note: Values without parentheses are marginal effects. Values in parentheses are z-values calculated using robust standard errors clustered by residential
area. A constant and dummies for political party support are included but the result is not reported. *, **, and *** indicate significance at the 10%, 5%, and
26
Table 4. Estimation results of probit model (alternative specification where dummy for viewing anime is used as a key variable).
JP_workplace JP_neighbor JP_family
(1)
Full sample
(2)
Subsample of
employees
(3)
Subsample of married employees
(4)
Full sample
(5)
Subsample of
employees
(6)
Subsample of married employees
(7)
Full sample
(8)
Subsample of
employees
(9)
Subsample of married employees
Dummy Anime 0.11***
(4.92)
0.16*** (5.09)
0.15*** (4.19)
0.09*** (4.27)
0.13*** (4.55)
0.10*** (3.61)
0.12*** (4.13)
0.12*** (3.32)
0.11*** (2.75) Wald statistics 170.7 108.5 89.3 175.4 125.4 94.8 152.7 101.0 66.3
Observations 1461
859 690 1461 859 690 1461 866 690
Note: Values without parentheses are marginal effects. Values in parentheses are z-values calculated using robust standard errors clustered by residential area.
All control variables used in the estimations in Table 3 are also incorporated as independent variables, although the results are not reported. *** indicate
27
Table 5(a). Estimation results of IV probit model based on subsample of unmarried people (number of children under 12 and its square are used as
instrumental variables).
JP_workplace JP_neighbor JP_family
(1) Full sample (2) Subsample of employees (3) Subsample of married employees (4) Full sample (5) Subsample of employees (6) Subsample of married employees (7) Full sample (8) Subsample of employees (9) Subsample of married employees Frequency of anime view 0.23*** (3.20) 0.19** (2.18) 0.19** (2.05) 0.15 (1.56) 0.20** (2.51) 0.20** (2.32) 0.10 (0.84) 0.11 (0.81) 0.11 (0.84) First-stage estimation Child_12 0.38*** (3.58) 0.37*** (3.29) 0.43*** (3.61) 0.39*** (3.79) 0.35*** (2.72) 0.41*** (3.06) 0.40*** (4.11) 0.36*** (3.10) 0.42*** (3.46)
Child_122 −0.14***
(−4.17) −(−3.62)0.15*** −(−3.89)0.17*** −(−4.17)0.14*** −(−3.46)0.15*** −(−3.82)0.17*** −(−3.92)0.14*** −(−3.64)0.15*** −(−3.93)0.17***
Overidentificatio n test p-value =0.08 p-value =0.69 p-value =0.62 p-value =0.06 p-value =0.30 p-value =0.25 p-value =0.21 p-value =0.69 p-value =0.78 Wald statistics 286.9 131.4 103.9 212.8 164.5 117.2 144.1 95.0 56.8
Observations 1461 859 690 1461 859 690 1461 866 690
Note: Values without parentheses are marginal effects. Values in parentheses are z-values calculated using robust standard errors clustered by residential area.
All control variables used in the estimations in Table 3 are also incorporated as independent variables, although the results are not reported. ** and ***
[image:28.842.84.736.174.400.2]28
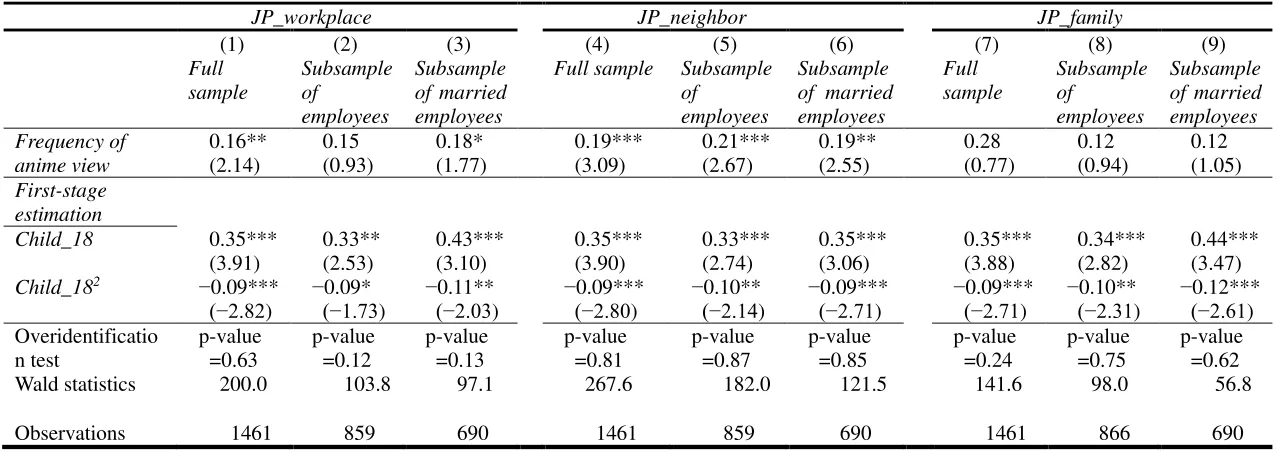
Table 5(b). Estimation results of IV probit model based on subsample of unmarried people (number of children under 18 and its square are used as
instrumental variables).
JP_workplace JP_neighbor JP_family
(1) Full sample (2) Subsample of employees (3) Subsample of married employees (4) Full sample (5) Subsample of employees (6) Subsample of married employees (7) Full sample (8) Subsample of employees (9) Subsample of married employees Frequency of anime view 0.16** (2.14) 0.15 (0.93) 0.18* (1.77) 0.19*** (3.09) 0.21*** (2.67) 0.19** (2.55) 0.28 (0.77) 0.12 (0.94) 0.12 (1.05) First-stage estimation Child_18 0.35*** (3.91) 0.33** (2.53) 0.43*** (3.10) 0.35*** (3.90) 0.33*** (2.74) 0.35*** (3.06) 0.35*** (3.88) 0.34*** (2.82) 0.44*** (3.47)
Child_182 −0.09***
(−2.82) −0.09* (−1.73) −0.11** (−2.03) −0.09*** (−2.80) −0.10** (−2.14) −0.09*** (−2.71) −0.09*** (−2.71) −0.10** (−2.31) −0.12*** (−2.61) Overidentificatio n test p-value =0.63 p-value =0.12 p-value =0.13 p-value =0.81 p-value =0.87 p-value =0.85 p-value =0.24 p-value =0.75 p-value =0.62 Wald statistics 200.0 103.8 97.1 267.6 182.0 121.5 141.6 98.0 56.8
Observations 1461 859 690 1461 859 690 1461 866 690
Note: Values without parentheses are marginal effects. Values in parentheses are z-values calculated using robust standard errors clustered by residential area.
All control variables used in the estimations in Table 3 are also incorporated as independent variables, although the results are not reported. *, **, and ***
indicate significance at the 10%, 5%, and 1% levels, respectively. The Amemiya–Lee–Newey minimum chi-square statistic is used for the overidentification
[image:29.842.82.726.121.347.2]29
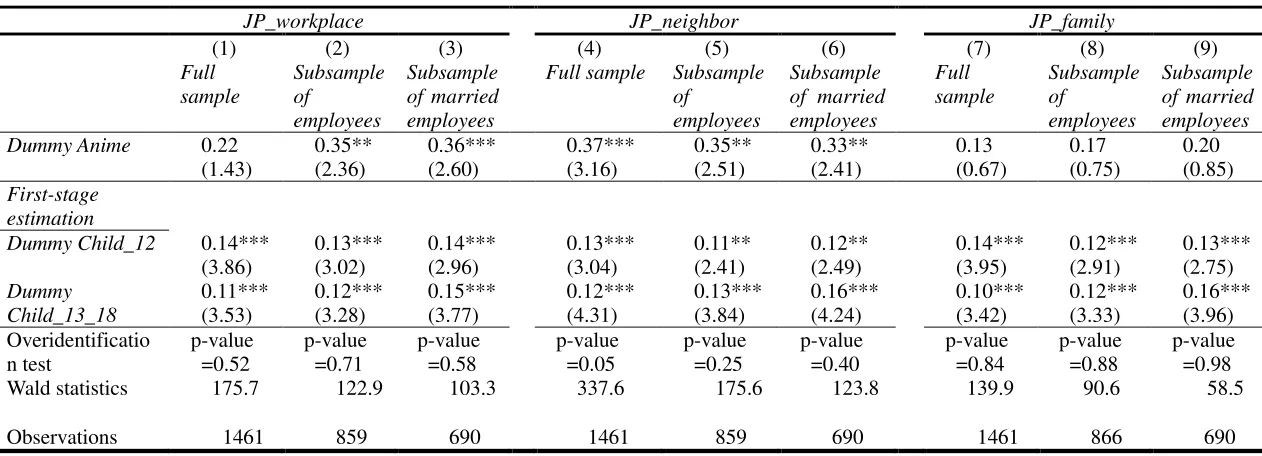
Table 6. Estimation results of IV probit model based on subsample of unmarried people (alternative specification where dummy for viewing anime is used
as a key variable: dummy for children under 12 and dummy for children between 13 and 18 are instrumental variables).
JP_workplace JP_neighbor JP_family
(1) Full sample (2) Subsample of employees (3) Subsample of married employees (4) Full sample (5) Subsample of employees (6) Subsample of married employees (7) Full sample (8) Subsample of employees (9) Subsample of married employees
Dummy Anime 0.22
(1.43) 0.35** (2.36) 0.36*** (2.60) 0.37*** (3.16) 0.35** (2.51) 0.33** (2.41) 0.13 (0.67) 0.17 (0.75) 0.20 (0.85) First-stage estimation
Dummy Child_12 0.14***
(3.86) 0.13*** (3.02) 0.14*** (2.96) 0.13*** (3.04) 0.11** (2.41) 0.12** (2.49) 0.14*** (3.95) 0.12*** (2.91) 0.13*** (2.75) Dummy Child_13_18 0.11*** (3.53) 0.12*** (3.28) 0.15*** (3.77) 0.12*** (4.31) 0.13*** (3.84) 0.16*** (4.24) 0.10*** (3.42) 0.12*** (3.33) 0.16*** (3.96) Overidentificatio n test p-value =0.52 p-value =0.71 p-value =0.58 p-value =0.05 p-value =0.25 p-value =0.40 p-value =0.84 p-value =0.88 p-value =0.98 Wald statistics 175.7 122.9 103.3 337.6 175.6 123.8 139.9 90.6 58.5
Observations 1461 859 690 1461 859 690 1461 866 690
Note: Values without parentheses are marginal effects. Values in parentheses are z-values calculated using robust standard errors clustered by residential area.
All control variables used in the estimations in Table 3 are also incorporated as independent variables, although the results are not reported. ** and ***
30
Figure 1. Distribution of frequency of viewing Japanese anime
0 0.1 0.2 0.3 0.4 0.5 0.6 0.7 0.8
1 2 3 4
F
racti
on
31
Figure 2(a). Distribution of number of children aged below 12 years old Figure 2(b). Distribution of number of children aged below 18 years old
0 0.1 0.2 0.3 0.4 0.5 0.6 0.7 0.8
0 1 2 3 4
F
racti
on
Number of children
0 0.1 0.2 0.3 0.4 0.5 0.6 0.7 0.8
0 1 2 3 4
F
racti
on
[image:32.842.99.409.89.278.2] [image:32.842.420.740.90.277.2]32
Appendix
Table A1(a). Estimation results of linear IV (2SLS) model based on subsample of unmarried people (number of children under 12 and its square are used as
instrumental variables).
JP_workplace JP_neighbor JP_family
(1) Full sample (2) Subsample of employees (3) Subsample of married employees (4) Full sample (5) Subsample of employees (6) Subsample of married employees (7) Full sample (8) Subsample of employees (9) Subsample of married employees Frequency of anime view 0.20* (1.83) 0.24* (1.74) 0.22* (1.73) 0.08 (0.89) 0.19 (1.43) 0.16 (1.31) 0.12 (1.03) 0.13 (0.83) 0.12 (0.83) Overidentificatio n test p-value =0.07 p-value =0.06 p-value =0.62 p-value =0.08 p-value =0.24 p-value =0.20 p-value =0.20 p-value =0.59 p-value =0.74 R-square 0.80 0.79 0.76 0.86 0.84 0.83 0.68 0.69 0.67
Observations 1461 859 690 1461 859 690 1461 866 690
Note: Values without parentheses are marginal effects. Values in parentheses are t values calculated using robust standard errors clustered by residential area.
All control variables used in the estimations in Table 3 are also incorporated as independent variables, although the results are not reported. ** and ***
[image:33.842.82.747.147.299.2]33
Table A1(b). Estimation results of linear IV (2SLS) model based on subsample of unmarried people (number of children under 18 and its square are used as
instrumental variables).
JP_workplace JP_neighbor JP_family
(1) Full sample (2) Subsample of employees (3) Subsample of married employees (4) Full sample (5) Subsample of employees (6) Subsample of married employees (7) Full sample (8) Subsample of employees (9) Subsample of married employees Frequency of anime view 0.17* (1.78) 0.15 (1.31) 0.18* (1.74) 0.18** (2.02) 0.22* (1.72) 0.19* (1.73) 0.09 (0.80) 0.13 (0.87) 0.12 (0.95) Overidentificatio n test p-value =0.62 p-value =0.09 p-value =0.12 p-value =0.88 p-value =0.80 p-value =0.91 p-value =0.23 p-value =0.66 p-value =0.58 R-square 0.81 0.81 0.79 0.84 0.83 0.83 0.68 0.69 0.67
Observations 1461 859 690 1461 859 690 1461 866 690
Note: Values without parentheses are marginal effects. Values in parentheses are t values calculated using robust standard errors clustered by residential area.
All control variables used in the estimations in Table 3 are also incorporated as independent variables, although the results are not reported. *, **, and ***
[image:34.842.84.737.121.273.2]34
Table A2. Estimation results of linear IV (2SLS) model based on subsample of unmarried people (alternative specification where dummy for viewing anime
is used as a key variable: dummy for children under 12 and dummy for children aged between 13 and 18 are instrumental variables).
JP_workplace JP_neighbor JP_family
(1) Full sample (2) Subsample of employees (3) Subsample of married employees (4) Full sample (5) Subsample of employees (6) Subsample of married employees (7) Full sample (8) Subsample of employees (9) Subsample of married employees Dummy of anime
view 0.24 (1.52) 0.41** (2.13) 0.42** (2.27) 0.30** (2.13) 0.33* (1.78) 0.30* (1.70) 0.15 (0.74) 0.19 (0.79) 0.22 (0.94) Overidentificatio n test p-value =0.45 p-value =0.81 p-value =0.65 p-value =0.08 p-value =0.25 p-value =0.40 p-value =0.73 p-value =0.82 p-value =0.95 R-square 0.82 0.81 0.79 0.85 0.84 0.84 0.69 0.69 0.67
Observations 1461 859 690 1461 859 690 1461 866 690
Note: Values without parentheses are marginal effects. Values in parentheses are t values calculated using robust standard errors clustered by residential area.
All control variables used in the estimations in Table 3 are also incorporated as independent variables, although the results are not reported. ** and ***