ISSN Online: 1945-3124 ISSN Print: 1945-3116
DOI: 10.4236/jsea.2017.109042 Aug. 14, 2017 765 Journal of Software Engineering and Applications
Automatic Traffic Using Image Processing
Al Hussain Akoum
Department CCNE, Lebanese University, Saida, Lebanon
Abstract
The frequent traffic jams at major intersections call for an effective manage-ment system. The paper suggests implemanage-menting a smart traffic controller us-ing real-time image processus-ing. The sequence of the camera is analyzed usus-ing different edge detection algorithms and object counting methods. Previously they used matching method that means the camera will be installed along with traffic light. It will capture the image sequence. To set an image of an empty road as a reference image, the captured images are sequentially matched using image matching; but in my paper, we used filtering method, which filtered the image and released all waste objects and only showed the cars, and after it well showed the number of cars in image. My paper is software that takes a picture or video. It has been customized to be used in the future to control the traffic light sign by giving each sign sufficient time, depending on the number of cars on each direction.
Keywords
Automatic Traffic, Computer Vision, Image Processing, Edge Detection
1. Introduction
Object recognition technology in the field of computer vision to find the objects in the image or video sequences and selects them. Humans realize many things in images with little effort, despite the fact that the image of objects may vary somewhat in different views, in many different sizes and scales or even when they are translated or rotated. Objects can be recognized even when they are partially obstructed from the point of view.
In modern life, we have to face with many problems, one of which is traffic congestion becoming more dangerous day by day.
As a result of the increase in vehicle traffic, many problems emerged, for ex-ample, traffic accidents, traffic congestion and so on. Traffic congestion was a How to cite this paper: Akoum, A.H.
(2017) Automatic Traffic Using Image Pro- cessing. Journal of Software Engineering and Applications, 10, 765-776.
https://doi.org/10.4236/jsea.2017.109042
Received: July 3, 2017 Accepted: August 11, 2017 Published: August 14, 2017 Copyright © 2017 by authors and Scientific Research Publishing Inc. This work is licensed under the Creative Commons Attribution International License (CC BY 4.0).
DOI: 10.4236/jsea.2017.109042 766 Journal of Software Engineering and Applications very difficult problem. As a result, many investigators have paid attention to ITS (Intelligent Transportation System) [1], such as predicting traffic flow based on traffic monitoring at the traffic junctions to detect bottlenecks [2]. This task re-mains a challenge for computer vision systems. Several approaches to this task have been implemented over many decades [3][4].
There are many methods of detecting vehicles on road such as motion detec-tion, installing lasers on both sides of the road [5] etc., which is tedious and in-volves a large number of hardwares. This method uses image processing tech-niques to count the number of vehicles on road and estimate the density. The number of vehicles found can be used for surveying or controlling the traffic signal. This is one of the best modern methods that countries are seeking to in-troduce into the traffic system. It organizes the traffic in a smart way, in this way you can organize the traffic without needing for a person to do it.
In the previous paper, most of them used matching technique, by taking main frame and then made subtraction and approach with the new frame [6].
But now in my paper, we will discuss about smart traffic control by using im-age processing to count vehicles. Vehicle detection and counting are important in calculating traffic congestion on highways. The main objective of detecting cars and counting in a video or image traffic paper is to develop a methodology for automatic detection of vehicles and count them on highways. Our method does not use background, it uses a filter that we detect and count the cars, takes a video or an image and makes some processing to finally give the number of cars.
2. Methodology
There are many methods of detecting vehicles on road such as motion detection, installing lasers on both sides of the road [7], etc., which is tedious and involves large number of hardware. This method uses image processing techniques to count the number of vehicles on road and estimate the density. The number of vehicles found can be used for surveying or controlling the traffic signal. Our methodology is based on two parts, vehicle detection using video and vehicle detection using image processing.
2.1. Vehicle Detection Using Video
Many techniques have been developed in Video Processing during the last four to five decades.
One of them is matching technique [3] [8], it take the previous image and current image and then make subtraction between that two image and according to the difference it well get the percentage of congestion [9].
But now we use filter technique that can give accuracy result up to 90%.
2.1.1. Architecture Design
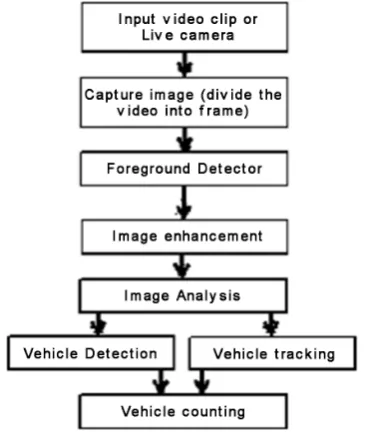
DOI: 10.4236/jsea.2017.109042 767 Journal of Software Engineering and Applications Figure 1. Overview of vehicle detection and counting system.
The video is divided into frames, and is taken as the input frames. They are entering into foreground method to eliminate the background and many roles [10]. If a vehicle is present in the input frame, it will be retained. The detected vehicle is thus tracked by various techniques, namely, blob analysis method.
2.1.2. Block Diagram
The Block diagram below gives an overview of how the vehicle is detected using image processing. Various boxes in Block diagram are explained below:
1) Capturing Image
We can take the capture image from live camera that can take every 10 sec a capture image. But in my paper we will take the video and divide it into frames and take every few second a frame Figure 2.
If we use the camera we should install it in a fixed place so it does not vibrate. 2) Foreground Detector
Foreground Detector is considered as the most important function in this code; it plays a big role in the filter and detects the ground.
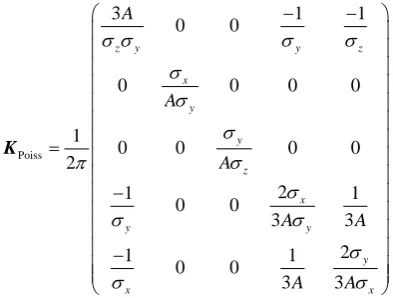
Foreground Detector detect foreground using Gaussian Mixture Models (GM- M) Figure 3.
DOI: 10.4236/jsea.2017.109042 768 Journal of Software Engineering and Applications Figure 2. Original frame taken from video.
Figure 3. GMM matrix.
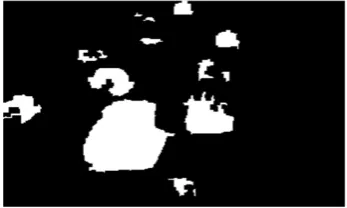
either white (logical 1) if the pixel is equal or greater that the level or black (log-ical 0) otherwise. Specified level should belong to the range [0, 1].
3) Image Enhancement
Image enhancement is the process of adjusting digital images so that the re-sults are more suitable for display or further analysis. For example, we can elim-inate noise, which will make it easier to identify the object.
Image enhancement are same used in image detecting and video detecting ex-cept in image rode process are not use.
First step is removing small connected components and objects from binary image by using function specified for this process. Those objects have fewer pix-els than the specified threshold Example: if we put the threshold is equal to 10 PIXEL then the object has size below 10 will remove. Removing the noise in the image is one of the most important and most difficult of the pre-handling tech-niques; but after that it will make the work easier.
Second step is by make dilate process it will enlarge/smooth the white areas and fill in black areas near borders/perimeters. Dilate process take two parame-ters first the image in stage before it and the other is defined by another function by creates a flat structuring element with the specified neighborhood it has 2 pa-rameters first for define the type of shape want to draw it and other is a size of
Poiss
3 1 1
0 0
0 0 0 0
1
0 0 0 0
2 2 1 1 0 0 3 3 2 1 1 0 0 3 3
z y y z
x y y z x y y y x x A A A A A A A
σ σ σ σ
[image:4.595.275.472.254.403.2]DOI: 10.4236/jsea.2017.109042 769 Journal of Software Engineering and Applications matrix containing 1’s and 0’s; the location of the 1’s defines the neighborhood for the morphological operation. The center (or origin) of matrix is its center element. (Note: this function is also used when make rode to the pic.)
Third step is by make rode process it will enlarge the black areas and eat away at the white areas Figure 4.
4) Vehicle Detection
Moving vehicle detection is in the video analysis. It can be used in many re-gions such as video surveillance, traffic monitoring and people tracking. There are many motion segmentation techniques, like frame difference. Frame differ-ence method has less computational complexity, and it is easy to implement; its difference between the current frame and the reference frame is above the thre-shold is considered as moving vehicle.
Another method Optical flow method can detect the moving vehicle even when the camera moves, but it needs more time for its computational complexi-ty, and it is very sensitive to the noise [5].
These two methods have Disadvantage:
Frame difference cannot detect the exact contour of the moving vehicle; Optical flow method is sensitive to the noise.
In my paper we use a different method from the two others above. My method is by use filter only that makes at every new frame a new picture, and then the system detects all new entering vehicles. This method gives result with an error up to 10%.
5) Vehicle Tracking
Vehicle tracking involves continuously identifying the detected vehicle in video sequence and is done by specifically marking the boundary around the de-tected vehicle [11]. Vehicle tracking is a challenging problem. Difficulties in tracking vehicles can arise due to abrupt vehicle motion, changing appearance patterns of the vehicle, vehicle-to-vehicle.
In my paper we use also from Foreground Detector Blob Analysis function. This function detects the vehicles and then from bounding box we get the size of the detected vehicles. After that we draw a rectangle around the detected vehicle Figure 5.
6) Counting Vehicle
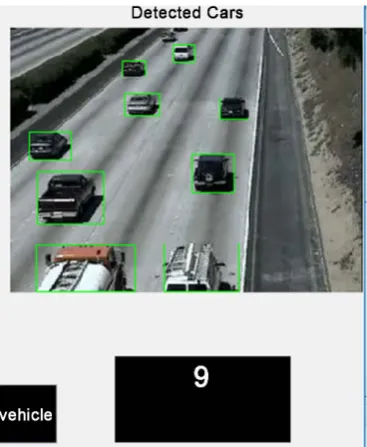
[image:5.595.291.465.603.707.2]It’s considered as the last stage in my paper, it gives the number of cars ac-cording to the number of boxes detected around the cars.
DOI: 10.4236/jsea.2017.109042 770 Journal of Software Engineering and Applications Figure 5. Tracking detected car.
Some previous paper make a line Figure 6, that counts cars when it cut it or Pass it; or they create a certain area Figure 7 that count the cars when the area is fill.
But these two methods have many disadvantages:
If two cars cut at the same time the line they can be considered as a single car and thus it counts one car;
If one car crossed two areas half in an area and second half in another area, it will be considered as two cars.
Thus my method Figure 8 will consider the best for counting cars.
2.1.3. Algorithm Flowchart
2.1.4. Experiments of the System
DOI: 10.4236/jsea.2017.109042 771 Journal of Software Engineering and Applications Figure 6. Line method.
Figure 7. Area method.
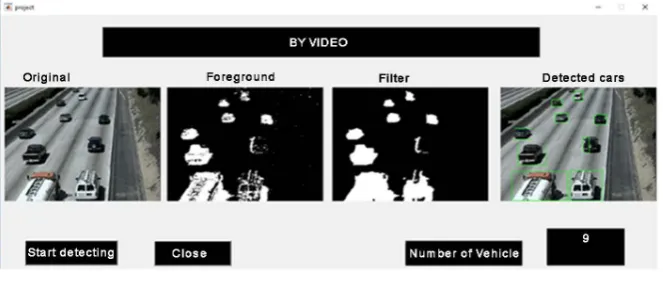
[image:7.595.287.471.479.703.2]DOI: 10.4236/jsea.2017.109042 772 Journal of Software Engineering and Applications Graphical user interface is the browser; I have already spoken that in my pa-peris consist from two parts, in Figure 9 it is the first interface observed, then we can choose between two methods: first by Video and other by Image. We press the video button that call another code and open a new browse.
After pressing the video button Figure 9 it opens the below browse. First it loads four images, when we press Start Detecting button, the system take a frame from the video and apply the first method on it. These interfaces are including edit text, push button and Axes.
In Figure 10, by using detection, tracking and counting methods, various re-sults are obtained. Video sequence taken containing moving cars, these videos are processed to get a detected and extracted object. Above snapshot shows the results obtained in each step of the process. The output of foreground is a binary vehicle, then according to the binary region detected a tracking method create box around it.
Initially count register is set to zero, when any moving vehicles are tracked than count register is incremented. At every frame the code again make process to detect new vehicle. Finally we get number of car from the tracking and con-vert it to string, so that we can display them in the edit text.
2.2. Vehicle Detecting Using Image
Another methods used in my paper is by using image processing.
Image processing is processing of images using mathematical operations by using any form of signal processing for which the input is an image. The output of image processing may be either an image or a set of characteristics or
[image:8.595.208.540.571.713.2]Figure 9. Graphical user interface start system.
DOI: 10.4236/jsea.2017.109042 773 Journal of Software Engineering and Applications parameters related to the image. Image processing is used to detect object but in my paper especially detect vehicles.
2.2.1. Block Diagram
2.2.2. Canny Edge Detection Technique
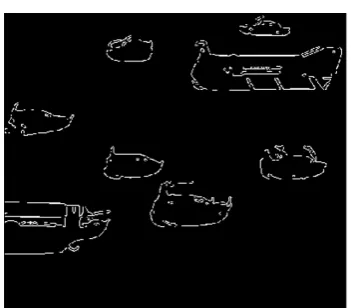
Canny proposed a filter determined analytically from 3 criterias: 1) Ensure a proper detection: a strong response even at low contours, 2) Guarantee a good location,
3) Ensure that for a contour, there will be only one detection (avoid the effects of rebounds due, for example, truncation filters).
[image:9.595.277.467.135.368.2] [image:9.595.290.466.539.693.2]These three criteria’s are expressed in the joint optimization of three func-tionals that define the optimal linear filter for the vehicle detection in an image Figure 11.
( )
Edge Gradient G_ = Gx + Gy (1)
DOI: 10.4236/jsea.2017.109042 774 Journal of Software Engineering and Applications 2.2.3. Vehicle Tracking
Vehicle tracking in image is not same as video, rather it is difficult to tracking vehicle.
We use some process and function to tracking cars; first we start by bring in-formation about every region and bring a property for each connected compo-nent in the binary image BW, which must be a logical array, in my paper we take these properties Eccentricity, Area and Bounding Box.
• Area returns a scalar that specifies the actual number of pixels in the region. • Eccentricity is the ratio of the distance between the foci of the ellipse and its
major axis length. The value is between 0 and 1.
Bounding Box Returns the smallest rectangle containing the region, specified as a 1-by-Q*2 vector, where Q is the number of image dimensions Figure 12.
2.2.4. Flow Chart
3. Conclusions
DOI: 10.4236/jsea.2017.109042 775 Journal of Software Engineering and Applications Figure 12. Tracking vehicle and count them.
density, and we can use it to control the traffic. Several future enhancements can be made for the system of detection, tracking and counting of moving vehicle can be extended to real-time live video feeds. Apart from the detection and ex-traction, process of recognition can also be done. By using recognition tech-niques, the vehicle in question can be classified. I achieved the goal, which I proposed, the overall system worked successfully, and the giving result has ac-curacy up to 90%.
This paper can be used in future for controlling street sign; this project has been completed specifically for this task. We can use it in crossroads; that in each direction takes the plats number of waiting vehicles and according to that, the system recognizes the plats number and can control the vehicle.
References
[1] Shi, Y.Q. and Yang, X.G. (2013) The Public Transportation System of High Quality in Taiwan. 2013 IEEE Eleventh International Symposium on Autonomous Decen-tralized Systems (ISADS), Mexico City, 6-8 March 2013, 1-6.
https://doi.org/10.1109/ISADS.2013.6513426
[2] Tarnoff, P.J., Bullock, D.M., Young, S.E., et al. (2009) Continuing Evolution of Tra-vel Time Data Information Collection and Processing. Transportation Research Board Annual Meeting, Washington, 11-15 January 2009, Paper #09-2030.
[3] Prem Kumar, V., Barath, V. and Prashanth, K. (2013) Object Counting and Density Calculation Using MATLAB.
[4] Lillywhite, K., Lee, D.J., Tippetts, B. and Archibald, J. (2013) A Feature Construc-tion Method for General Object RecogniConstruc-tion. Pattern Recognition, 46, 3300. https://doi.org/10.1016/j.patcog.2013.06.002
[5] Gamer, J.E., Lee, C.E. and Huang, L.R. (1990) Center for Transportation Research, the University of Texas at Austin. Infrared Detectors for Counting, Classifying, and Weighing Vehicles, 3-10-88/0-1162.
Interna-DOI: 10.4236/jsea.2017.109042 776 Journal of Software Engineering and Applications tional Conference on Image, Vision and Computing,Iran, V50.11.
[7] Pandit, V., Doshi, J., Mehta, D., Mhatre, A. and Janardhan, A. (2014) Smart Traffic Control System Using Image Processing. International Journal of Emerging Trends & Technology in Computer Science, 3, 5902-5906.
[8] Akoum, A., Daya, B. and Chauvet, P. (2010) Two Neural Networks for License Number Plates Recognition. Journal of Theoretical and Applied Information Tech-nology, 12, 25-32.
[9] Pancharatnam, M. and Sonnadara, D.U.J. (2010) Vehicle Counting and Classifica-tion from a Traffic Scene. The 26th National IT Conference, Colombo, Sri Lanka, 72- 78.
[10] Linganagouda, R., Raju, P. and Patil, A. (2016) Automatic Intelligent Traffic Con-trol System. International Journal of Advanced Research in Electrical, Electronics and Instrumentation Engineering, 5, 5902-5906.
[11] Fleet, D.J. and Weiss, Y. (2005) Toronto, Fleet Research Optical Flow Estimation, Flow Chapter 05.
http://www.cs.toronto.edu/~fleet/research/Papers/flowChapter05.pdf
Submit or recommend next manuscript to SCIRP and we will provide best service for you:
Accepting pre-submission inquiries through Email, Facebook, LinkedIn, Twitter, etc. A wide selection of journals (inclusive of 9 subjects, more than 200 journals)
Providing 24-hour high-quality service User-friendly online submission system Fair and swift peer-review system
Efficient typesetting and proofreading procedure
Display of the result of downloads and visits, as well as the number of cited articles Maximum dissemination of your research work