R
ESEARCHA
RTICLEProteomic screening of glucose-responsive and glucose
non-responsive MIN-6 beta cells reveals differential
expression of proteins involved in protein folding,
secretion and oxidative stress
Paul Dowling
1*, Lorraine O’Driscoll
1*, Finbarr O’Sullivan
1, Andrew Dowd
1,
Michael Henry
1, Per Bendix Jeppesen
2, Paula Meleady
1**and Martin Clynes
1**1
National Institute for Cellular Biotechnology, Dublin City University, Dublin, Ireland 2
Department of Endocrinology and Metabolism C, Aarhus University Hospital, Aarhus Sygehus THG, Aarhus, Denmark
The glucose-sensitive insulin-secretion (GSIS) phenotype is relatively unstable in long-term cul-ture of beta cells. The purpose of this study was to investigate relative changes in the proteome between glucose-responsive (low passage) and glucose non-responsive (high passage) murine MIN-6 pancreatic beta cells. The 2D-DIGE and subsequent DeCyder analysis detected 3351 pro-tein spots in the pH range of 4–7. Comparing MIN-6(H) to MIN-6(L) and using a threshold of 1.2-fold, the number of proteins with a decrease in expression level was 152 (4.5%), similar was 3140 (93.7%) and increased 59 (1.8%). From the differentially expressed proteins identified in this study, groups of proteins associated with the endoplasmic reticulum (ER) and proteins involved in oxidative stress were found to be significantly decreased in the high-passage (H pas-sage) cells. These proteins included endoplasmic reticulum protein 29 (ERp29); 78-kDa glucose-related protein, (GRP78); 94-kDa glucose-glucose-related protein (GRP94); protein disulphide isomerase; carbonyl reductase 3; peroxidoxin 4 and superoxide dismutase 1. These results suggest that non-GSIS MIN-6 cells do not have the same ability/capacity of glucose-responsive MIN-6 cells to successfully fold, modify or secrete proteins and counteract the problems associated with oxida-tive stress.
Received: April 20, 2006 Revised: August 28, 2006 Accepted: September 21, 2006
Keywords:
DIGE / Endoplasmic reticulum / Glucose-Sensitive Insulin Secretion / MIN-6 beta cells / Oxidative stress
1
Introduction
Diabetes mellitus is a disabling disease that currently affects at least 170 million people worldwide and the incidence is growing at an alarming rate [1, 2]. Cell replacement therapies are potential alternatives to the insulin injections currently employed to control blood glucose in diabetes, and it has been demonstrated that this condition may be cured, at least
Correspondence: Dr. Paul Dowling, National Institute for Cellular
Biotechnology, Dublin City University, Glasnevin, Dublin 9, Ire-land
E-mail: [email protected] Fax: +353-1-700-5484
Abbreviations: ERp29, 29-kDa ER protein; GSIS,
glucose-sensi-tive insulin-secretion; GRP, glucose-related protein; H passage, high passage; L passage, low passage; LSCM, laser scanning confocal microscopy; PDI, protein disulphide isomerase; RNS,
on a temporary basis, by transplantation of pancreatic islets isolated from donor pancreas [3]. However, the shortage of human islet cells represents a limitation for large-scale use of islet transplantation to cure patients with diabetes. Alter-native sources of beta cells with a suitably stable phenotype have yet to be defined [4]. A fundamental characteristic of suitable replacement cells is their ability to secrete mature insulin in response to physiological changes in blood levels of glucose and other nutrients (glucose-sensitive insulin secretion, GSIS). Unfortunately, studies of such cells by us [5] and others have indicated that this necessary regulated secretion is lost in beta cell lines such as MIN-6 with passaging of these cells in culture. A better understanding of the complex nature of GSIS is necessary to allow the pre-vention or correction of such problems in the future.
Beta cells are specialized for the synthesis of high levels of insulin; the correct folding of proinsulin in the ER is essential for the efficient production of insulin. Molecular chaperones are a specialized subset of proteins whose func-tion is to assist other proteins in achieving proper folding in the ER. Many chaperones are heat shock proteins, that is, proteins expressed in response to elevated temperatures or other cellular stresses, and include 78-kDa glucose-regulated protein (GRP78), GRP58, GRP94, protein disulphide iso-merase (PDI), calreticulin, 29-kDa ER protein (ERp29). Altered expression levels of several proteins including GRP78, GRP94 and PDI have been shown to be associated with the pathophysiology of diabetes [6–11].
Oxidative stress, defined as a persistent imbalance be-tween the production of highly reactive oxygen species (ROS) and/or reactive nitrogen species (RNS) and antioxidant defences is likely to be involved in progression of pancreatic beta cell dysfunction. In healthy beta cells, a balance of gen-erating and neutralizing ROS and RNS establishes the redox homeostasis, which is important for normal cell function. Examples of ROS include charged species such as super-oxide and the hydroxyl radical and uncharged species such as hydrogen peroxide. Beta cells are sensitive to ROS and RNS because they are low in free-radical quenching (antioxidant) enzymes such as catalase, glutathione peroxidase, and superoxide dismutase and this has also been shown to be greatly involved in the pathophysiology of diabetes [12, 13].
The aim of this study was to examine differential regula-tion of the proteome associated with continuous culture of MIN-6 cells and corresponding loss of GSIS phenotype to enable future development of potential methods whereby relevant beta cell functions could be preserved in long-term culture [14–16].
2
Materials and methods
2.1 MIN-6 culture
MIN-6 cells (generously donated by Dr. Yamamoto, Kuma-moto University school of Medicine, Japan) were grown in
DMEM containing 20% heat-inactivated FCS and were cul-tured at 377C with 5% CO2. Routine sterility checks, includ-ing screeninclud-ing for Mycoplasma, indicated that the cells were clear of contamination. MIN-6 (H passage) at passage 40 cells was established by sub-culturing MIN-6 (L passage) cells from passage 18, as previously described [5].
2.2 GSIS analysis of MIN-6 cells
MIN-6 cells were seeded at 26105cells/well in a 24-well plate, and were allowed to grow for 72 h prior to the GSIS assay. Following this, 16KRB (Krebs-Ringer bicarbonate) buffer was prepared from an aliquot of frozen 106stock (36.525 g NaCl, 2.2 g KCl, 0.941g CaCl2 + 2H2O, 1.22 g MgCl2 + 6H2O, 29.8g HEPES dissolved in 500 mL H2O). BSA was added to a final concentration of 0.1%, and the KRB-BSA was pH-adjusted to 7.36 at 197C with 1 mol/L NaOH. This solution was incubated for 30 min at 377C and 5% CO2. Glucose concentrations of 0, 3.3, 10, 16.7, and 26.7 mmol/L were prepared in the conditioned 16KRB and were subsequently placed at 377C and 5% CO2for 30 min. MIN-6 cells to be analyzed were rinsed (twice) in 16KRB and were equilibrated at 3.3 mmol/L glucose for 30 min at 377C. After equilibration, the glucose-containing stimulation media were added (1 mL/well), incubated at 377C and 5% CO2for 60 min. The GSIS assay was then terminated by placing the plate on ice. Conditioned medium (500mL) was removed from each well, placed in an ice-cold Eppendorf tube, centrifuged at 2500 rpm for 5 min and 200mL of the supernatant was removed for analysis by (pro)insulin ELISA (Mercodia, 10-1124-10) following the manufacturer’s instructions.
2.3 Immunofluorescence
2.4 Sample preparation and protein labelling
Cells at approximately 80% confluence were washed twice in PBS, twice in sucrose buffer before being lysed in buffer containing (4% w/v CHAPS, 7 M Urea, 2 M thiourea, 10 mM Tris-HCl, 5 mM magnesium acetate pH 8.5), and then homogenized by passing through a 25-gauge needle six times. Insoluble material was removed by centrifugation at 14 000 rpm for 20 min at 107C. Protein concentration was determined using the BSA protein assay kit (Bio-Rad).
Cell lysates were labelled with N-hydroxy succinimidyl ester-derivatives of the cyanine dyes Cy2, Cy3, and Cy5 fol-lowing the protocol described previously. Typically, 50mg of lysate was minimally labelled with 200 pmol of either Cy3 or Cy5 for comparison on the same 2-D gel. Labelling reactions were performed on ice in the dark for 30 min and then quenched with a 50-fold molar excess of free lysine to dye for 10 min on ice. A pool containing equal amounts of all sam-ples was also prepared and labelled with Cy2 to be used as a standard on all gels to aid image matching and cross-gel sta-tistical analysis. The Cy3 and Cy5 labelling reactions (50mg of each) from each lysate were mixed and run on the same gels with an equal amount (50mg) of Cy2-labeled standard [17].
2.5 Protein separation by 2-DE and gel imaging
Immobilized 24-cm linear pH gradient (IPG) strips, pH 4–7, were rehydrated in rehydration buffer (7 M urea, 2 M thiou-rea, 4% CHAPS, 0.5% IPG buffer, 50 mM DTT) overnight, according to the manufacturers guidelines. IEF was per-formed using an IPGphor apparatus (GE Healthcare) for 40 kV h at 207C with resistance set at 50 mA. Strips were equilibrated for 20 min in 50 mM Tris-HCl, pH 8.8, 6 M urea, 30% v/v glycerol, 1% w/v SDS containing 65 mM DTT and then for 20 min in the same buffer containing 240 mM iodoacetamide. Equilibrated IPG strips were transferred onto 18620-cm 12.5% uniform polyacrylamide gels poured be-tween low fluorescence glass plates. Strips were overlaid with 0.5% w/v low melting point agarose in running buffer con-taining bromophenol blue. Gels were run using the Ettan Dalt 6 apparatus (GE Healthcare) at 2.5 W/gel for 30 min and then 100 W total at 107C until the dye front had run off the bottom of the gels. All the images were collected on a Typhoon 9400 Variable Mode Imager (GE Healthcare). Sta-tistics and quantitation of protein expression were carried out in DeCyder software (GE Healthcare).
2.6 Spot digestion and MALDI-TOF analysis
Excision of protein spots, trypsin digestion, and protein identification by MS analysis using an Ettan MALDI-TOF Pro instrument from Amersham Biosciences was performed according to an established methodology [18]. Preparative gels containing 300mg of protein were fixed in 30% v/v methanol, 7.5% v/v acetic acid overnight and washed in water, and total protein was detected by post-staining with
SyproRuby dye (Molecular Probes) for 3 h at room tempera-ture. Excess dye was removed by washing twice in water, and gels were imaged using a Typhoon 9400 Variable Mode Im-ager (GE Healthcare) at the appropriate excitation and emis-sion wavelengths for the stain. The subsequent gel image was imported into the BVA module of DeCyder software and was matched to images generated from DIGE analysis. Spots of interest were selected and confirmed using this software for subsequent picking using an Ettan Spot Picker. Gel plugs were placed into a presilconized 1.5-mL plastic tube for destaining, desalting and washing steps. The remaining liquid above the gel plugs was removed and sufficient ACN was added in order to cover the gel plugs. Following shrink-age of the gel plugs, ACN was removed and the protein-con-taining gel pieces were rehydrated for 5 min with a minimal volume of 100 mM ammonium bicarbonate. An equal vol-ume of ACN was added and after 15 min of incubation the solution was removed from the gel plugs and the samples were dried for 30 min using a vacuum centrifuge. Individual gel pieces were then rehydrated in digestion buffer (12.5 ng trypsin perml of 10% ACN, 40 mM ammonium bicarbonate) to cover the gel pieces. More digestion buffer was added if all the initial volume had been absorbed by the gel pieces. Exhaustive digestion was carried out overnight at 377C. After digestion, the samples were centrifuged at 12 0006g for 10 min using a bench top centrifuge. The supernatant was carefully removed from each sample and placed into clean and silconized plastic tubes. Samples were stored at2807C until analysed by MS. For spectrometric analysis, mixtures of tryptic peptides from individual samples were desalted using Millipore C-18 Zip-Tips (Millipore) and eluted onto the sam-ple plate with the matrix solution (5 mg/mL CHCA in 50% ACN/0.1% TFA v/v). Mass spectra were recorded using the MALDI TOF instrument operating in the positive reflector mode at the following parameters: accelerating voltage 20 kV; and pulsed extraction: on (focus mass 2500). Internal and external calibration was performed using trypsin auto-lysis peaks at m/z 842.50, m/z 2211.104 and Pep4 mix, respectively. The mass spectra were analysed using MALDI evaluation software (GE Healthcare), and protein identifica-tion was achieved with the PMF Pro-Found search engine.
2.7 Statistical analysis
Two-sided, Student’s t-tests were used to analyze differences in protein levels between MIN-6(L) cell lysates and MIN-6(H) cell lysates. A p-value of less than 0.01 was considered statis-tically significant.
3
Results
3.1 Morphology of MIN-6 (L) and (H)
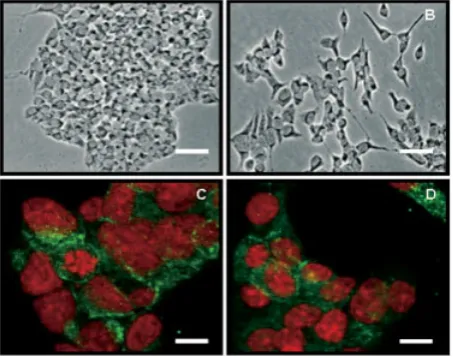
mi-croscopy. This contrast-enhancing optical technique used to produce high-contrast images of transparent specimens, was performed at 106, 206and 406magnification by imagin-ing the livimagin-ing, unfixed cells usimagin-ing a Nikon Optiphot micro-scope with phase contrast rings. Phase contrast light mi-croscopy indicates that MIN-6(L) cells that are glucose-responsive tend to grow closely together, forming discrete colonies (Fig. 1A), whereas MIN-6(H) cells, shown in (Fig. 1B), which have lost their glucose-responsiveness with culturing, appear to be more disperse, stretched cells.
3.2 Immunofluorescence
Laser scanning confocal microscopy (LSCM) analysis of (Fig. 1C) MIN-6(L) and (Fig. 1D) MIN6-(H) cells indicates insu-lin (green staining) to be located in cytoplasmic granules. The numbers and localisation of insulin granules are apparently not significantly different between these two cell populations. Nuclei were stained with propidium iodide (red staining).
3.3 GSIS from MIN-6 H passage and L passage cells
[image:4.595.312.539.75.245.2]As shown in Fig. 2, MIN-6 (L) cells secrete insulin in a glu-cose-regulated manner, with an approximately 5.5-fold increase in secreted product between 3.3 and 26.7 mM glu-cose. In contrast to this, MIN6 (H) cells do not show a func-tional GSIS response, i.e. the basal secretion of insulin from these cells is not influenced by the glucose content of their environment.
Figure 1. Phase contrast light microscopy indicates that MIN-6(L)
[image:4.595.57.284.423.602.2]cells, which are glucose-responsive tend to grow closely togeth-er, forming discrete colonies (A), whereas MIN-6(H) cells, shown in (B), which have lost their glucose-responsiveness with cultur-ing, appear to be more disperse, stretched cells. Scale bar 25mm. LSCM analysis of (C) MIN-6(L) and (D) MIN6-(H) cells indicates insulin (green staining) to be located in cytoplasmic granules. The numbers and localisation of insulin granules are apparently not significantly different between these two cell populations. Nuclei were stained with propidium iodide (red staining). Scale bar 10mm.
Figure 2. MIN-6(L) cells secrete (pro)insulin in a
glucose-regu-lated manner (hashed bars). This reguglucose-regu-lated secretion is no longer apparent following long-term culture/passaging of MIN-6(H) cells (black bars). Results represent means6SD from three experi-ments.
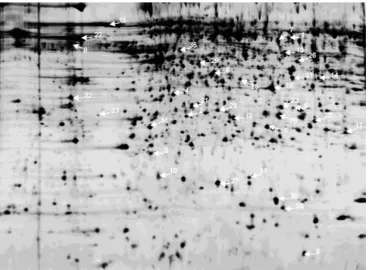
3.4 Effects of continuous passaging of MIN-6 cells on protein expression patterns using 2D-DIGE (IEF pH range 4-7)
Fifty micrograms of protein from each sample was labelled with Cy2, Cy3, or Cy5. Eight samples each from MIN-6(L) and MIN-6(H) (experimental design included independent biological samples/biological replicates) were labelled with Cy3 and Cy5, respectively. All 16 samples employed in the experiment were used in the Cy2-labelled internal pooled standard. Samples were combined and separated by 2-DE. For DeCyder image analysis, the differential in-gel analysis mode of DeCyder was first used to merge the Cy2, Cy3, and Cy5 images for each gel and to detect spot boundaries for the calculation of normalized spot volumes/protein abundance. At this stage, features resulting from non-protein sources, namely dust particles and scratches were filtered out. The analysis was used to rapidly calculate abundance differences between samples run on the same gel. The biological varia-tion analysis mode of DeCyder was then used to match all pair wise image comparisons from difference in-gel analysis for a comparative cross-gel statistical analysis. Operator intervention was required at this point to set landmarks on gels for more accurate cross-gel image superimposition. Comparison of normalized Cy3 and Cy5 spot volumes with the corresponding Cy2 standard spot volumes within each gel gave a standardized abundance. This value was compared across all gels for each matched spot and a statistical analysis was performed.
significant number of proteins are differentially expressed between MIN-6(H) cell lysates and MIN-6(L) cell lysates. The migration patterns and exact location of the identified pro-teins that were found to be differentially expressed are shown (Fig. 3).
The 35 differentially expressed proteins passed certain criteria for inclusion in the list, including appearing in all gels, a p-value of less than 0.01 and for protein identification an expectation value of 0.00 (Table 1). An expectation value of zero denotes a perfect match; an expectation value of 0.01 indicates a 1% chance that the identification is random. All reported identifications in this study have an expectation value of 0.00. The 35 differentially expressed proteins identi-fied were found to have a broad range of functions, including chaperone activity, DNA binding, signal transduction, extra-cellular structure, growth factors, cell motility and metabo-lism/catabolism. From the data acquired, it is clear that the majority of proteins identified in this study is involved in chaperone activities and in metabolism/catabolism (Fig. 4).
Four differentially expressed proteins associated with the ER and specifically involved in chaperone activity, namely GRP94, GRP78, PDI and ERp29 were identified. The abun-dance of all four proteins was found to be significantly decreased in MIN-6(H) compared to MIN-6(L).
GRP94 (2.73-fold decrease) is a resident protein of the ER and is induced by the accumulation of unfolded proteins. The GRP78/BiP (2.91-fold decrease) belongs to the family of
~70-kDa heat shock proteins (HSP70) and is associated with newly synthesised proteins. PDI involved in disulphide-bond formation and isomerization, as well as the reduction of di-sulphide bonds in proteins was found to be 2.44 decreased in H passage compared to L passage cells. A recently characterized protein, ERp29 (2.34-fold decrease) is closely related to these chaperone proteins and appears to be up-regulated during ER stress conditions. This soluble protein is localized to the lumen of the ER in all mammalian cells (Table 1 and Fig. 5).
The majority of proteins identified was found to be involved in metabolism/catabolism. Of these proteins car-bonyl reductase 3, peroxidoxin 4 and superoxide dismutase are known to have similar functions as antioxidant enzymes and protecting cells from free radical-mediated damage. Carbonyl reductase plays a unique role in the detoxification of reactive aldehydes derived from lipid peroxidation and was found to display a 3.54-fold decrease in H passage cells. Per-oxiredoxin 4 (2.77-fold decrease) represents a member of a recently discovered family of antioxidant proteins. Super-oxide dismutase 1 (1.97-fold decrease) is a very well docu-mented antioxidant that catalyses the conversion of super-oxide radicals to molecular oxygen. Their function is to destroy the radicals that are normally produced within cells and are toxic to biological systems (Table 1 and Fig. 5).
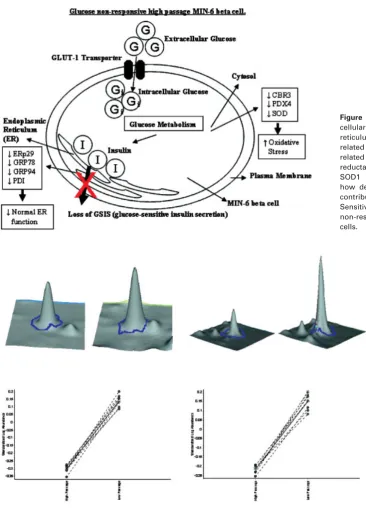
[image:5.595.58.428.411.681.2]Analysis of the protein expression using DeCyder soft-ware provided 3-D simulation of the protein spots, allowing an objective view for the comparison of spot intensity
Figure 4. Pie chart displaying the
func-tions of the 35 differentially expressed proteins in 6(H) cells versus MIN-6(L) cells.
Table 1. Table showing identification, average ratio, t-test scores, theoretical molecular weight (Mw), theoretical pI, % coverage and
expectation values for each of the 35 differentially expressed proteins in MIN-6(H) cells versus MIN-6(L) cells
Spot number
Name t-test Av.
ratio
Theoreti-cal pI
Theoreti-cal Mw
% Coverage
Expecta-tion value
1 3-Phosphoglycerate dehydrogenase 0,00087 2,65 6,1 57370 15,80% 0 2 6-Phosphogluconolactonase 0,00019 21,31 5,6 27460 26,80% 0 3 6-*Yruvoyl-tetrahydropterin synthase/dimerization cofactor 4,90E-07 21,75 6,28 12035 29% 0 4 Annexin A4 0,00032 1,99 5,4 36200 43,90% 0 5 Bisphosphate 3’-nucleotidase 1 0,0047 21,24 5,5 33520 44,50% 0 6 Carbonyl reductase 3 3,40E-07 23,56 6,2 31330 18,80% 0 7 Chaperonin subunit 2 (beta) 0,0051 1,22 6 57800 38,70% 0 8 Chromatin assembly factor 1 subunit C (CAF-1 subunit) 2,40E-08 1,85 4,95 52914 37,40% 0 9 Protein 1 homolog gamma (HP1 gamma) 1,10E-07 2,41 5,13 21013 29,50% 0 10 Chromogranin A precursor (CgA) 3,00E-07 2,47 4,65 18571 41,60% 0 11 Deoxyuridine triphosphatase 4,00E-07 1,41 5,7 17540 44,40% 0 12 Endoplasmic reticulum protein ERp29 precursor 8,90E-12 22,34 5,9 28862 30,50% 0 13 Enolase 1, alpha non-neuron 2,10E-05 21,53 6,4 47450 22,40% 0 14 Galactose-4-epimerase, UDP 0,00018 22,86 6,3 38550 19,50% 0 15 Heat shock 70-kDa protein 5 (glucose-regulated protein) 9,30E-07 22,91 5 72520 40,60% 0 16 High mobility group box 1 (Amphoterin) 8,20E-10 2,18 6,15 28573 24,70% 0 17 Hypoxanthine guanine phosphoribosyl transferase 6,60E-05 21,75 6,21 24756 30,60% 0 18 Malate dehydrogenase, cytoplasmic 5,50E-06 21,61 6,2 36630 20,10% 0 19 Peroxiredoxin 4 1,10E-13 22,77 6,67 31261 35,00% 0 20 Phosphoglycerate mutase 1 2,00E-06 2,95 6,7 28930 33,90% 0 21 Prohibitin 7,30E-05 1,31 5,6 29860 20,20% 0 22 Prolyl 4-hydrolase, beta polypeptide;protein disulfide isomerase 1,40E-07 22,44 4,8 57440 40,90% 0 23 Proteasome (prosome, macropain) subunit, alpha type 1 0,00018 21,29 6 29810 32,50% 0 24 Proteasome (prosome, macropain) 28 subunit 0,00015 21,33 5,5 28790 25,40% 0 25 Protein phosphatase 1, catalytic subunit, beta 0,0019 1,25 5,8 37970 33,50% 0 26 S-adenosylhomocysteine hydrolase 2,60E-06 1,45 6 48170 18,80% 0 27 Stathmin 1 3,50E-05 1,57 5,76 17205 47,70% 0 28 Stromal cell -derived growth factor 4,00E-10 22,28 6,3 18080 28,00% 0 29 Succinyl-CoA ligase [GDP-forming] beta chain 9,80E-05 22,59 5,8 44040 15,10% 0 30 Superoxide dismutase 1, soluble 2,50E-08 21,97 6 16100 44,00% 0 31 Transaldolase 1 0,0048 1,5 6,6 37540 31,80% 0 32 Tropomyosin alpha 3 chain 3,40E-06 1,53 4,7 32900 21,80% 0 33 Ubiquitin thiolesterase 1,70E-10 2,98 5,14 25164 37,40% 0 34 Ubiquinol-cytochrome-c-reductase complex core protein 1 2,80E-07 1,6 5,8 53440 26,90% 0 35 Glucose Regulated Protein 94 1,60E-06 22,73 4,7 92041 16,80% 0
between the two images and statistical information. Statistical analysis and 3-D images were generated in the BVA module of DeCyder software. Representative
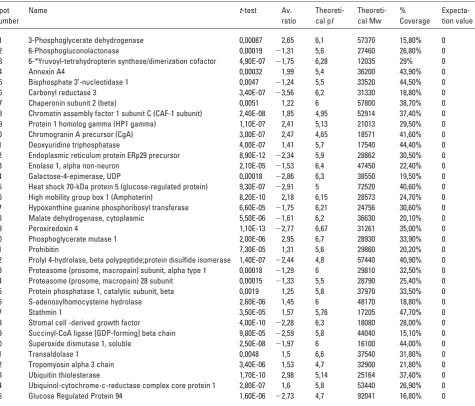
[image:6.595.62.538.254.660.2]Figure 5. Diagram showing the
sub-cellular location for ERp29 (endoplasmic reticulum protein 29), GRP78 related protein 78), GRP94 (glucose-related protein 94), PDI, CBR3 (carbonyl reductase 3), PRDX4 (peroxidoxin 4), SOD1 (superoxide dismutase 1) and how decreased expression levels may contribute to a loss of GSIS (Glucose-Sensitive Insulin Secretion) in glucose non-responsive H passage MIN-6 beta cells.
Figure 6. Statistical analysis and 3-D images for peroxidoxin-4 and endoplasmic reticulum protein
(ERp29). Statistical analysis and 3-D images were generated in the BVA module of DeCyder software.
4
Discussion
As a possible alternative to – and improvement on – the existing therapies available for insulin-dependent dia-betes, cultured beta cells offer enormous potential. How-ever, for such cells to be considered an appropriate source of transplantable tissue, it is of fundamental importance
that their secretion of insulin occurs in a regulated man-ner, in response to physiological changes in blood glucose levels.
under-standing, through proteomic analysis, of the complex pro-cesses involved in the loss of GSIS, found with passaging/ extended time in culture, may allow a greater insight into the mechanisms involved. The main techniques used in this study were 2D-DIGE and subsequent MS. The use of bio-logical replicates from separately cultured cells allowed the application of stringent statistical analysis to generate a list of proteins displaying differential expression between H pas-sage (glucose non-responsive; MIN-6(H)) and L paspas-sage (glucose responsive; MIN-6(L)) MIN-6 cells.
In our previous study of MIN-6 cells at passages 17 to 22, we established that MIN-6 is reproducibly glucose-respon-sive, secreting insulin in response to increased glucose levels. Following sub-culturing and continuous analysis of glucose-responsiveness at increasing passage numbers, we established that this response is completely lost by passage 40. Biological replicates selected for analysis in this study were, therefore, p18 (MIN-6(L); L passage; glucose-respon-sive) and p40 (MIN-6(H); high passage; glucose non-respon-sive) cells [5].
Contradictory results in recent times have been reported on the GSIS response of the murine beta-like cell line, MIN-6. Some studies have reported the maintenance of GSIS while others have documented the loss of this response with increasing passage numbers and time in culture [5, 14, 19– 21]. Here, we report that L passage (passage 18) MIN-6 cells respond to changes in glucose concentration, producing an approximately 5.5-fold GSIS in response to 26.7 mmol/L, compared to 3.3 mmol/L, glucose. After continuous culture to passage 40, this GSIS was no longer present. Beta cells play a central role in glucose homeostasis; therefore, beta cell loss or dysfunction leads to the development of diabetes.
Using LSCM analysis we observed that the presence of granules in similar numbers in the GSIS of both H and L passage MIN-6 cells suggests that the observed change in GSIS is not related to a deficiency in insulin capability. Phase contrast light microscopy indicates that MIN-6(L) cells that are glucose-responsive tend to grow closely together and form discrete colonies whereas MIN-6(H) cells, which have lost their glucose-responsiveness with culturing, appear to be more dispersed, stretched cells.
One of the characteristic features of beta cells is a highly developed ER, which is essential for proper insulin folding, packaging and secretion [22].The ER is one of the most important organelles, serving several important functions, including PTM, folding and assembly of newly synthesized secretory proteins (hormones, antibodies, pancreatic enzymes, etc.), and as a cellular calcium store. For proper functioning, a protein folds in a characteristic 3-D structure and may form a multimeric protein complex. The ER pro-vides an environment perfectly suited for the folding and assembly of proteins. Efficient and rapid protein folding is assisted by molecular chaperones, folding factors and folding sensors. Molecular chaperones are proteins and protein complexes that bind to misfolded or unfolded polypeptide chains and affect the subsequent folding processes of these
chains. Chaperones are found in all types of cells and cellular compartments, and have a wide range of binding specifi-cities and functional roles.
One of the most significant findings of the study reported here was the differential expression of major proteins asso-ciated with the ER, namely ERp29-, GRP78, GRP94- and PDI, all of which have very similar or complementary func-tions at the ER, especially in protein folding, disulphide bond formation, PTM and protein secretion.
ERp29, characterised initially in 1997 [23], is a major resident of the ER that seemingly plays an important role in most animal cells [24, 25]. The expression of ERp29 reaches its highest levels in secretory cells; seems to play an impor-tant role in protein folding; consists of two domains of which the N-terminal domain of ERp29 resembles the thioredoxin module of PDI [26]; and has been shown to associate with GRP78 and GRP94 [27]. Recently, Morand et al. [11] profiled hepatic ER-associated proteins from control and fructose-fed (insulin-resistant) hamsters using 2-DE and MS and found ERp29 to be 4.5-fold down-regulated in fructose-fed hamster livers. In our study, we found ERp29 to be significantly decreased in MIN-6(H) cells compared to MIN-6(L) cells that maintain their GSIS.
homeostasis. Together with ERp29, GRP78 and GRP94, PDI is an intrinsic member of the ER with numerous dedicated functions and characteristics.
The correct arrangement of disulphide bonds is impor-tant for the proper stability and function of many proteins. PDI is the enzyme responsible for catalyzing efficient for-mation of native disulphide pairings in eukaryotic cells. PDI is an ER-resident protein that catalyzes the oxidation of dithiols and the reduction and isomerization of disulphide bonds in secretory proteins. Of importance to diabetes is that PDI is now regarded as an insulin-regulated gene [40, 41]. The loss of GSIS associated with H passage MIN-6 beta cells coincides with a significant decrease in the abundance levels of PDI. DIGE analysis of cell lysates from MIN-6 glucose responsive and glucose non-responsive beta cells reveals a 2.44-fold decrease in PDI in the glucose non-responsive phenotype.
Several models of diabetes have displayed a link to the ER proteins identified in this study, namely ERp29, GRP78, GRP94 and PDI. All these proteins have very similar or complementary functions at the ER, especially with respect to protein folding, bond formation, PTM and protein secre-tion. From the data presented here, continuous culture of MIN-6 cells results in the appearance of phenotypic changes. Most notably, deviation from characteristic MIN-6 morphol-ogy, growth patterns, loss of GSIS and a significant reduction in the expression levels in ERp29, GRP78, GRP94 and PDI. Therefore, it seems that the inability of the glucose non-responsive phenotype to secrete insulin in response to ap-propriate stimuli is intrinsically linked with the differential regulation of the ER proteins in question.
Oxidative stress, defined as a persistent imbalance be-tween the production of highly reactive molecular species (chiefly oxygen and nitrogen) and antioxidant defences is likely involved in progression of pancreatic beta cell dys-function and is possibly caused by low levels of antioxidant enzyme expressions, therefore making pancreatic beta cells more vulnerable. Oxidative stress results from increased content of ROS and/or RNS. Superoxide anions and the hy-droxyl radical are examples of charged ROS, with hydrogen peroxide (H2O2) being an example of an uncharged species [42]. Maechler et al. [13] showed that oxygen stress generated by short exposure of beta cell preparations to H2O2increases production of p21 and decreases insulin mRNA, cytosolic ATP, and calcium flux in cytosol and mitochondria, and causes apoptosis. They showed as well that the mitochondria is a primary targets for hydrogen peroxide (H2O2) damage, which will eventually interrupt the transduction of signals normally coupling glucose metabolism to insulin secretion.
Beta cells are sensitive to ROS and RNS because they are low in free radical quenching (antioxidant) enzymes such as catalase, glutathione peroxidase, and superoxide dismutase [43]. In this study, we found that the expression levels of car-bonyl reductase 3, superoxide dismutase 1 and peroxiredoxin 4 to be significantly decreased in MIN-6(H) compared to MIN-6(L) cells, which was associated with the loss of GSIS.
The decrease in abundance levels of these already low expressed antioxidant enzymes suggests that the H passage MIN-6 cells have little ability to counteract the damaging affect of free radicals and that this may have an impact on insulin secretion. Tiedge et al. [12] showed that the effects of stable overexpression of glutathione peroxidase (Gpx), cata-lase (Cat), or Cu/Zn superoxide dismutase (SOD) can protect insulin-producing RINm5F cells against oxidative damage. In addition, the adenovirus-mediated catalase gene transfer was also shown to reduce oxidant stress in human, porcine and rat pancreatic islets [44].
From the data presented here, it is clear that loss of GSIS is associated with a reduction in expression levels of free-radical quenching (antioxidant) enzymes such as carbonyl reductase 3, superoxide dismutase 1 and peroxiredoxin 4. Recently, it was shown that chronic high glucose culture caused impairment in glucose-sensitive insulin secretion in DBA/2 islets, which have a genetic predisposition to failure, and this may be the result of oxidative stress [45].
To conclude, we have identified 35 proteins differentially expressed between glucose-responsive and glucose non-responsive MIN-6 beta cells. Proteins associated with ER functioning and oxidative stress were found to be particularly affected. The results shown in this study suggest that shorter culture times and a greater understanding of the protein expression changes associated with the loss of GSIS in H passage MIN-6 beta cells will contribute to the ultimate goal of developing cell-based transplantation therapy for insulin-dependent diabetes.
This work was supported by the PRTLI Cycle 3 Programme of the Irish Higher Education Authority.
5
References
[1] Zimmet, P., Alberti, K. G., Shaw, J., Nature 2001, 414, 782– 787.
[2] Gale, A. E. M., Diabetologia 2005, 48, 2445-2450.
[3] Shapiro, A. M., Lakey, J. R., Ryan, E. A., Korbutt, G. S. et al., N. Engl. J. Med. 2000, 343, 230-238.
[4] Scharfmann, R., Eur. J. Clin. Invest. 2003, 33, 595-600. [5] O’Driscoll, L., Gammell, P., Clynes, M., Transplant. Proc.
2004, 36, 1159-1162.
[6] Wang, J., Takeuchi, T., Tanaka, S., Kubo, S. K. et al., J. Clin. Invest. 1999, 103, 27-37.
[7] Sitia, R., Braakman, I., Nature 2003, 426, 891-894.
[8] Nozaki, J., Kubota, H., Yoshida, H., Naitoh, M. et al., Genes Cells 2004, 9, 261-270.
[9] Lan, H., Rabaglia, M. E., Schueler, K. L., Mata, C. et al., Dia-betes 2004, 53, 240-244.
[10] Nardai, G., Stadler, K., Papp, E., Korcsmaros, T. et al., Bio-chem. Biophys. Res. Commun. 2005, 334, 787-795.
[12] Tiedge, M., Lortz, S., Drinkgern, J., Lenzen, S., Diabetes 1997, 46, 1733 –1742.
[13] Maechler, P., Jornot, L., Wollheim, C. B., J. Biol. Chem. 1999, 274, 27905–27913.
[14] Miyazaki, J., Araki, K., Yamato, E., Ikegami, H. et al., Endo-crinology 1990, 127, 126-132.
[15] Lilla, V., Webb, G., Rickenbach, K., Maturana, A. et al., Endo-crinology 2003, 144, 1368-1379.
[16] Zhang, B., Hosaka, M., Sawada, Y., Torii, S. et al., Diabetes 2003, 52, 2720-2730.
[17] Alban, A., David, S. O., Björkesten, L., Andersson, C. et al., Proteomics 2003, 3, 36-44.
[18] Westermeier, R., Naven, T., Practical Proteomics, Wiley-VCH-Verlag, Weinheim, Germany 2002.
[19] Kayo, T., Sawada, Y., Suzuki, Y., Suda, M. et al., J. Biol. Chem. 1996, 271, 10731-10737.
[20] Ishihara, H., Asano, T., Tsukuda, K., Katagiri, H. et al., Am. J. Physiol. 1995, 269, 897-902.
[21] Kinoshita, N., Echigo, Y., Shinohara, S., Gu, Y. J. et al., Cell Transplant. 2001, 10, 473–477.
[22] Oyadomari, S., Araki, E., Mori, M., Apoptosis 2002, 7, 335-345.
[23] Demmer, J., Zhou, C. M., Hubbard, M. J., FEBS Lett. 1997, 402, 145-150.
[24] Hubbard, M. J., Proteomics 2002, 2, 1069-1078.
[25] Hermann, V. M., Cutfield, J. F., Hubbard, M. J., J. Biol. Chem. 2005, 280, 13529-13537.
[26] Knoblach, B., Keller, B. O., Groenendyk, J., Aldred, S. et al., Mol. Cell. Proteomics 2003, 2, 1104-1119.
[27] Sargsyan, E., Baryshev, M., Szekely, L., Sharipo, A., Mkrtchian, S., J. Biol. Chem. 2002, 277, 17009-17015. [28] Ahmed, M., Forsberg, J., Bergsten, P., J. Proteome Res.
2005, 4, 931-940.
[29] Bole, D. G., Hendershot, L. M., Kearney, J. F., J. Cell. Biol. 1986, 102, 1558-1566.
[30] Haas, I. G., Wabl, M., Nature 1983, 306, 387-389. [31] Pelham, H. R., Cell 1986, 46, 959-961.
[32] Johnson, A. E., van Waes, M. A., Rev. Cell. Dev. Biol. 1999, 15, 799-842.
[33] Rapoport, T. A., Matlack, K. E. S., Plath, K., Misselwitz, B., Staeck, O., J. Biol. Chem. 1999, 380, 1143-1150.
[34] Melnick, J., Aviel, S., Argon, Y., J. Biol. Chem. 1992, 267, 21303-21306.
[35] Melnick, J., Dul, J. L., Argon, Y., Nature 1994, 370, 373-375. [36] Yoshioka, M., Kayo, T., Ikeda, T., Koizumi, A., Diabetes 1997,
46, 887-894.
[37] Kozutsumi, Y., Segal, M., Normington, K., Gething, M. J., Sambrook, J., Nature 1988, 332, 462-464.
[38] Dorner, A. J., Wasley, L. C., Kaufman, R. J., J. Biol. Chem. 1989, 264, 20602-20607.
[39] Lee, A. S., Curr. Opin. Cell. Biol. 1992, 4, 267-273.
[40] Nieto, A., Mira, E., Castano, J. G., Biochem. J. 1990, 267, 317-323.
[41] O’Brien, R. M., Granner, D. K., Physiol. Rev. 1996, 76, 1109-1161.
[42] Rosen, P., Nawroth, P. P., King, G., Moller, W. et al., Diabetes Metab. Res. Rev. 2001, 17, 189–212.
[43] Tiedge, M., Lortz, S., Munday, R., Lenzen, S., Diabetes 1998, 47, 1578–1585.
[44] Benhamou, P. Y., Moriscot, C., Richard, M. J., Beatrix, O. et al., Diabetologia 1998, 41, 1093–1100.