Forfás R&D Surveys
The Science Budget 2006/2007
The First Findings
Table of Contents
Introduction ... 3
Strategy for Science Technology and Innovation……… 4
Executive Summary ... 5
Chapter 1: Science and Technology (S&T) Budget ... 9
1.1 Total Science Budget ... 9
1.2 Trends in State S&T expenditure ...10
1.3 Trends in categories of State S&T expenditure ...11
1.4 S&T intensity (spending relative to economic activity) ...12
Chapter 2: Focus on State funding of research and development (R&D) ...14
2.1 Types of R&D indicators...14
2.2 Government budget spending on R&D ...15
2.3 State spending on R&D ...16
2.4 Programmes classified by area of research ...18
2.5 GBAORD as a percentage of GNP and international comparisons...19
Chapter 3: Performance of research and development (R&D) in the public sector ...22
3.1 Total expenditure on R&D performed in the government sector...22
3.2 Types of research ...24
3.3 Fields of science...25
Chapter 4: Human resources dedicated to publicly-performedresearch and development (R&D) ...26
4.1 R&D personnel ...26
4.2 Gender and qualifications of State sector research staff...27
4.3 R&D staff by fields of science ...28
Appendix 1 - Methodology...29
Appendix 2 - Government departments and agencies included in the 2007 Science Budget...30
Appendix 3 - Definitions of R&D and S&T activities...32
Appendix 4 - Acronyms ...34
Appendix 5 - International tables...35
Appendix 6 - Questonnaire...37
List of Charts
Figure 1: Total Science Budget (2007) ... 9
Figure 2: Total science and technology spending by the state sector, (1997-2007current and constant prices)...10
Figure 3: Total science and technology spending by activity, (2002-2007) - €m. current prices ...11
Figure 4: Share of science and technology spending by category, (2007) % total ...12
Figure 5: Total science and technology expenditure as a percentage of GNP (1997-2007)...13
Figure 6: Annual growth rates of science and technology spending and nominal GNP (1997-2007)...13
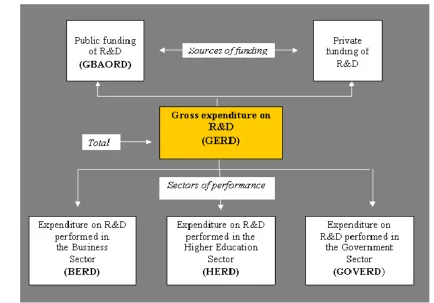
Figure 7 R&D funding and performance system ...14
Figure 8: GBAORD trend in current prices, (1997-2007) € millions ...15
Figure 9: GBAORD trend and GBAORD as a percentage of GNP (1997-2007) ...19
Figure 10: International comparison of civil GBAORD as a percentage of GDP ...21
Figure 11: Average annual growth rate of civil GBAORD for selected countries (2002–2006) ...21
Figure 12: GOVERD as a percentage of GNP and GOVERD trend (1997-2007)...22
Figure 13: Major State research and development performers (2007)...23
Figure 14: Total research and development personnel by occupation in headcount terms (2005-2007) ...26
Figure 15: Total R&D personnel by occupation in FTEs (2007) ...27
Figure 16: Researchers by gender and qualification (2007)...27
Figure 17: Researchers classified by gender and field of science FTE (2007)...28
List of Tables
Table 1: Government departments and agencies funding R&D activities (2007)...16Table 2: GBAORD classifications for Ireland (2007) ...18
Table 3: Civil GABORD relative comparisons (1997 and 2007) as a percentage of economic activity (GDP/GNP)...20
Table 4: GOVERD as a percentage of GDP (2002 and 2007 or latest available data) ...23
Table 5: GOVERD by type of research (2007) ...24
Table 6: Field of science classified by type of research, (2007) ...25
Table 7: Total male/female (FTE) and as % of total by field of science (2007) ...28
Appendix Tables
Table 1: Government departments/agencies and offices funding S&T activities, 2007...30Table 2: International comparison of GOVERD as a percentage of GDP, 2002 and 2007 ...35
Introduction
Investment in science and technology (S&T), and in particular, research and development (R&D), is a vital part of Ireland’s plan to become a more knowledge-driven economy. Continued investments in these key areas will be crucial to maintaining future economic stability, and improving Ireland’s competitiveness position on the international stage, through higher productivity and sustaining high levels of future employment.
Forfás monitors the funding and performance of State S&T and R&D under mandate from Government legislation. As part of this process, each year it carries out the Science Budget survey which aims to
capture key performance metrics within the State sector. Data and analysis from this survey helps to assess the progress being made in the economic aim to be a more knowledge driven-economy as set out in the recent Strategy for Science, Technology and Innovation (SSTI).
This publication presents findings from the 2007 Science Budget survey, with final data for 2006 and estimates for 2007. Key metrics analysed in this reports include overall S&T spending, Government Budget Appropriations and Outlays on Research and Development (GBAORD), Government Expenditure on State performed Research and Development, (GOVERD) and finally R&D human resource indicators.
The findings from this survey complement the findings from the other R&D performance surveys conducted by Forfás. These include the Business Expenditure R&D survey (BERD), the Higher Education R&D performed survey (HERD) and the hospital performed R&D survey. The total performance of R&D in the State is then added to create the Gross Expenditure on R&D (GERD) metric.
More detailed methodology is presented in Appendix 1. The survey is carried out using the definitions, rules and guidelines set out in the OECD Frascati Manual. This allows for a common dataset to be collected across all OECD and EU countries which facilitates better international comparisons and benchmarking. Data on GBAORD, GOVERD and Human Resources is also prepared under European statistical legislation.
Forfás would like to thank the many respondents to this survey who have taken time to gather information and complete the data requests for this key area of Government policy.
Strategy for Science, Technology and Innovation
The Strategy for Science, Technology and Innovation1 (SSTI), was launched in 2006 by the Department of Enterprise, Trade and Employment to facilitate the continuing transition to a strong knowledge intensive economy. It is a targeted seven year plan to promote and increase S&T activities in Ireland which will help lay a strong foundation from which future economic growth can develop. It commits to spending over €8.2 billion of exchequer funds to 2013 on S&T activities with a particular focus on R&D. The vision set out in the strategy is that “Ireland by 2013 will be internationally renowned for the excellence of its research, and will be to the forefront in generating and using new knowledge for economic and social progress, within an innovation driven culture”. Data from the Science Budget survey, alongside other R&D surveys, will be used to monitor and evaluate progress being made toward these goals. Some of the main policy objectives set out in the SSTI include:
Increased participation in the sciences by young people by taking action as early as primary school to foster interest in the sciences;
Increase in the number of people qualifying in science, technology and engineering disciplines including numbers qualifying at advanced level (PhD);
Building a sustainable, world class research system across the spectrum of humanities, physical and social sciences in the universities and institutes of technology by supporting excellent science whether it be “frontier research” or more applied research;
Upgrading the physical infrastructure and facilities available to support research in the public system;
Creating a transformation in the quality and quantity of research undertaken by the enterprise sector (indigenous and multinational) such that enterprise R&D will continue to account for at least two-thirds of R&D undertaken nationally (a target associated with the Lisbon Strategy)
Increasing the output of economically relevant knowledge and know-how from the higher education sector and other public research institutions and putting in place mechanisms to facilitate stronger industry-academic collaboration and interaction;
Increased participation in trans-national research activity and raising the visibility of Irish science abroad;
Greater exploitation of all-island synergies in STI policy.
1 Strategy for Science, Technology and Innovation 2006-2013 Department of Enterprise, Trade and Employment
Executive Summary
The total Science Budget allocation for 2007 will rise to an estimated €2.51 billion in 2007. This
represented a significant increase from the confirmed €2.22 billion outturn for State S&T spending in 2006.
Total science and technology spending by the State sector (1997-2007, current and constant prices)
2.51 2.51
2.22 2.06
2.06 1.88 1.78 1.68
1.36 1.16 1.12
0.93 1.33
1.57 1.59 1.77
2.08 2.11 2.15
2.31 2.24 2.33
0.50 1.00 1.50 2.00 2.50 3.00
1997 1998 1999 2000 2001 2002 2003 2004 2005 2006 2007
Current Constant
Growth in S&T spending in current prices, will therefore accelerate to 13% in 2007 from the 8% S&T spending gains recorded in 2006. Over the last decade average annual growth in S&T spending was 10.5%. In real terms, expenditure on S&T activities increased by 7.1% in 2007. This represented a quickening in the pace of real growth from the 3.9% rise recorded in the previous year.
Of the total €2.51 billion allocated for S&T activities in 2007, the largest amount will be spent on S&T education and training. This category will account for €1.15 billion of total S&T spending in 2007 (45.9%). Spending in this area of S&T will rise by 8.7% this year.
Total science and technology expenditure by activity - 2002 - 2007 (current prices)
1152
907
96 231
123
0 200 400 600 800 1000 1200
2002 2003 2004 2005 2006 2007
Education and Training Research and Development
Other S&T activities Technical Services
Increased spending on R&D activities will climb to €906.7 million in 2007, an increase of 16.1% compared to the 2006 outturn. The share of R&D spending in total S&T expenditure will rise to 36.2% in 2007, well ahead of the 24% share in 2001.
The spending intensity ratio will rise as the spending growth of S&T – 13.5%, will outpace the slower and estimated 7.1% rise in nominal GNP. The intensity ratio on S&T activities will rise from a low in 2006 of 1.49% of GNP to an expected high of 1.57% in 2007.
Total science and technology expenditure as a % of GNP (1997-2007) 1.56% 1.64% 1.53% 1.71% 1.68% 1.59% 1.65% 1.50% 1.51% 1.49% 1.57% 1.40% 1.45% 1.50% 1.55% 1.60% 1.65% 1.70% 1.75%
1997 1998 1999 2000 2001 2002 2003 2004 2005 2006 2007
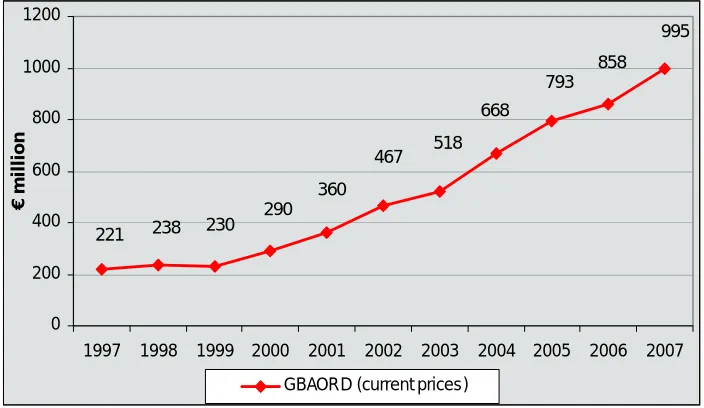
The internationally recognised indicator for benchmarking State fundingof R&D is GBAORD. GBAORD, as defined in the OECD Frascati Manual, includes all exchequer and EU funding for R&D projects and also R&D spending on the arts and humanities. R&D spending by the government has more than quadrupled from €221 million in 1997 to nearly €1 billion in 2007. The average growth rate in GBAORD in the last 10 years has been 16%, among the top performances across OECD countries. GBAORD as a % of GNP has increased from 0.37% in 1997 to 0.62%.
GBAORD trend and GBAORD as a % of GNP 1997-2007
0.35% 0.62% 0.58% 0.58% 0.53% 0.44% 0.44% 0.37% 0.33% 0.30% 0.37% 290 360 467 518 668 793 858 995 230 221 238 0.0% 1.0% 2.0% 3.0%
1997 1998 1999 2000 2001 2002 2003 2004 2005 2006 2007 0 200 400 600 800 1000
Looking at medium term trends for civil GBAORD (excluding defence R&D), the graph below shows that the Irish performance over the period 2002 to 2006/7 has seen one of the strongest growth rates across the OECD. At 16.3% Ireland will rank second out of 15 countries for the highest average annual growth rate of civil GBAORD from 2002 to 2007. This is down slightly on the 2006 figure of 16.6%, but clearly remains at the top end of the table. The civil GBAORD average growth rate in Germany and France was just 1.0% and 0.8% respectively.
Average annual growth rates of civil GBAORD for selecte countries (2002-2006) 0.8% 1.0% 2.7% 3.6% 4.3% 4.9% 5.4% 6.5% 6.8% 8.4% 9.2% 10.1% 11.9% 16.3% 18.1%
0.0% 5.0% 10.0% 15.0% 20.0% 25.0% 30.0%
France Germany United Kingdom United States Finland Austria Denmark Australia Portugal Czech Republic Korea Spain Greece Ireland Luxembourg
Total expenditure on R&D performed in the State sector (GOVERD) (excluding higher education
expenditure) is expected to total €140.4 million in 2007. This represents a substantial 17.4% increase in current prices over the actual outturn reported for 2006. In real terms and excluding inflationary effects R&D performed in the State sector is estimated also to increase by 11% between 2006 and 2007. GOVERD as a percentage of GNP is therefore expected to rise to 0.09% in 2007 after a drop to 0.08% in 2006.
GOVERD trend and GOVERD as a % of GNP (1997-2007)
140.4 119.7 127.4 138.4 127.4 125.3 104.1 95.6 63.9 70.0 65.4 0.00% 0.10% 0.20% 0.30%
1997 1998 1999 2000 2001 2002 2003 2004 2005 2006 2007 0 20 40 60 80 100 120 140 160 € m ill ion
In 2007 1,344 R&D personnel will be employed by the government sector in headcount terms. In full–time equivalent terms 1,256 R&D active staff will be employed in the State sector in 2007. There are now 381 PhD qualified researchers, compared with 276 in 2005. The number of non PhD qualified researchers has fallen from 181 in 2005 to 157 by 2007. Total support staff and technicians have also been reduced, though the numbers are not significant.
Total R&D personnel by occupation in the State R&D sector 2005-2007 (headcount)
0 100 200 300 400 500 600
Researchers with PhD
Researchers without PhD
Technicians Other Support Staff
Chapter 1:
Science and Technology Budget
This chapter provides details of the total spending allocated for science and technology (S&T) activities by State institutions. In the latest Science Budget, government departments, offices and agencies were asked to record their confirmed total spending on S&T activities for 2006, and also to provide data for allocated spending on S&T activities in 2007. Institutions were also asked to break this spending on S&T activities into 5 key performance areas. The definitions used to classify S&T activities into these categories are listed in Appendix 3.
1 Research and development (R&D) 2 Technical services for S&T 3 Education and training for S&T 4 Technology transfer
5 Other S&T activities unclassified
1.1 Total Science Budget
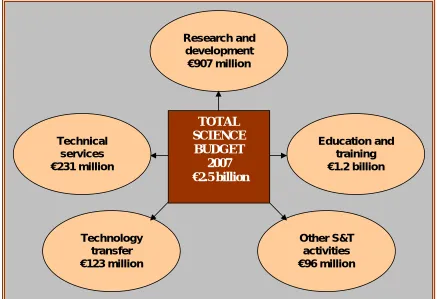
The total Science Budget allocation for 2007 is expected to rise to an estimated €2.51 billion. This
[image:10.595.90.527.453.752.2]represented a significant increase from the confirmed €2.22 billion outturn for State S&T spending in 2006.
Figure 1: Total Science Budget (2007)
Technology transfer €123 million
Other S&T activities €96 million Technical
services €231 million
Education and training €1.2 billion Research and
development €907 million
TOTAL
SCIENCE
Figure 1 shows how the €2.51 billion state S&T spending is distributed amongst the key performance areas for 2007. Spending on education and training for S&T at €1.2 billion in 2007 continues to represent the largest part of the total Science Budget. The next largest spending component of the total Science Budget is for key R&D activities which will total €907 million in 2007. Spending on S&T technical services will be €231 million in 2007 alongside State expenditure of €123 million on technology transfer programmes.
1.2 Trends in State science and technology expenditure
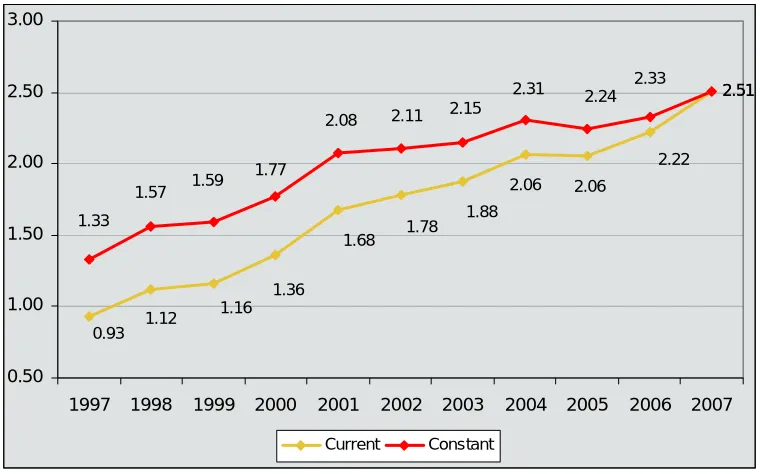
[image:11.595.109.489.341.578.2]State spending on S&T activities has posted strong gains in the last decade. Figure 2 shows that S&T spending has increased from €930 million in 1997 to an estimated €2.51 billion in 2007. The graph also shows expenditure on S&T in real terms which strips out the effects of inflation (as measured by the consumer price index).
Figure 2: Total science and technology spending by the State sector, (1997-2007 current and constant prices)
2.51 2.51
2.22
2.06 2.06
1.88 1.78 1.68
1.36 1.16 1.12
0.93 1.33
1.57 1.59 1.77
2.08 2.11 2.15
2.31 2.24 2.33
0.50 1.00 1.50 2.00 2.50 3.00
1997 1998 1999 2000 2001 2002 2003 2004 2005 2006 2007
Current Constant
State spending on S&T grew strongly between 2006 and 2007. Allocated S&T funding by State departments, offices and agencies is estimated to climb by 13% in the year to stand at €2.51 billion. Growth in S&T spending will therefore accelerate from the 8% recorded S&T spending gains in 2006. Over the last decade average annual growth in S&T spending was 10.5%.
1.3 Trends in categories of State science and technology expenditure
Of the total €2.51 billion allocated for spending on S&T activities in 2007, the largest category of spending will be for education and training in S&T. This category will account for €1.15 billion of total S&T
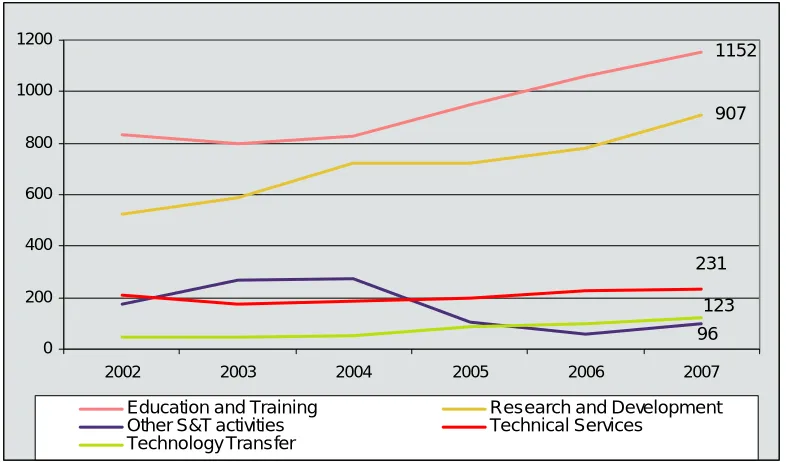
[image:12.595.103.496.212.443.2]estimated spending in 2007 (45.9%) as is illustrated in Figure 3. Spending in these areas of S&T will rise by 8.7% over the year.
Figure 3: Total science and technology spending by activity, (2002-2007) - €m. current prices
1152
907
96 231
123
0 200 400 600 800 1000 1200
2002 2003 2004 2005 2006 2007
Education and Training Research and Development
Other S&T activities Technical Services
Technology Transfer
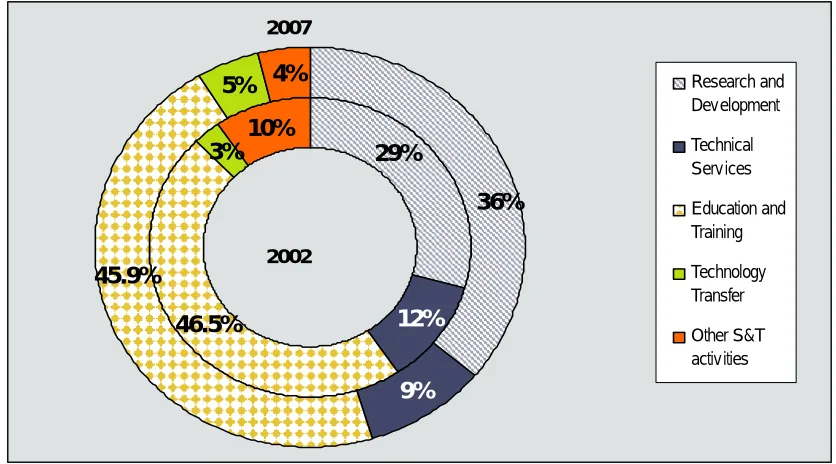
The next largest category of S&T spending by State institutions is for R&D. Increased spending on R&D activities is one of the key objectives of the recently published government SSTI. Spending on R&D by State bodies is expected to climb to €906.7 million in 2007, an increase of 16.1% compared to the 2006 outturn. As a result the share of R&D spending in total S&T expenditure will rise to 36.2% in 2007, well ahead of the 29% share in 2002 (Figure 4). Rapid growth in R&D spending in the period 2000-2007 will outpace spending growth in other S&T categories. More detailed information on R&D is presented in the next chapter.
All other categories of S&T expenditure also saw increases in the period 2006-2007. Expenditure on the third largest category of S&T spending - S&T technical services, is expected to increase by 0.7% over the period 2006/2007. As a result of this weaker spending growth the share of S&T technical services spending as a proportion of total S&T spending will fall from 10.3% in 2006 to 9.2% in 2007.
Figure 4: Share of science and technology spending by category, % total, (2007)
3% 10%
46.5% 12%
29% 4%
5%
45.9%
36%
9%
Research and Development Technical Services Education and Training Technology Transfer Other S&T activities
2007
2002
Detailed spending data per S&T category at institution and programme level is presented in Appendix 7. A summary of the largest increases between 2006 and 2007 across the institutions is as follows:
Higher Education Authority +€103m (Increased R&D and technology transfer funding) Department of Education and Science +€65m (Increased education and training and R&D funding) Office of Public Works +€32m (Increased funding for S&T buildings)
Sustainable Energy Ireland +€32m (Increased technology transfer and R&D funding) Science Foundation Ireland +€16m (Increased R&D funding)
Teagasc +€15m (Increased R&D and technology transfer funding) Enterprise Ireland +€14m (Increased R&D and technology transfer funding)
Figure 5: Total science and technology expenditure as a percentage of GNP, (1997-2007)
1.56% 1.64%
1.53% 1.71%
1.68%
1.59% 1.65%
1.50%
1.51%
1.49% 1.57%
1.40% 1.45% 1.50% 1.55% 1.60% 1.65% 1.70% 1.75%
1997 1998 1999 2000 2001 2002 2003 2004 2005 2006 2007
At the beginning and end of the period, the overall spending intensity of S&T activities, has remained constant at 1.57% of GNP. Between 1999 and 2001 the intensity ratio swung between a low of 1.5% of GNP and a high of 1.71% of GNP. The strongest years for increases in S&T spending growth in the last decade were 2000 and 2001, with spending growth expected to re-accelerate once more in 2006 and 2007. At these times overall spending growth was boosted across all S&T categories. In the period 2004 to 2006, despite strong increases in the education and training and R&D categories, overall spending growth was constrained somewhat by the slowdown in S&T spending, in the other S&T activity categories.
Figure 6: Annual growth rates of science and technology spending and nominal GNP, (1997-2007)
-5% 0% 5% 10% 15% 20% 25%
1997 1998 1999 2000 2001 2002 2003 2004 2005 2006 2007
[image:14.595.109.496.533.780.2]Chapter 2: Focus on State funding of research and development
This chapter deals with what is often considered the most important aspect of the total Science Budget spending programme – R&D. It is widely acknowledged that a country’s investment in R&D will assist in its transition to a knowledge based economy and facilitate economic growth. This should help to ensure long term economic success, by enabling Ireland to compete effectively with other established and emerging knowledge economies. This chapter also focuses on the performance of R&D expenditure relative to international competitors.
2.1
Types of research and development indicators
R&D, as defined by the OECD “comprises creative work undertaken on a systematic basis in order to
increase the stock of knowledge, including knowledge of man, culture and society, and the use of this stock of knowledge to devise new applications.”(Frascati Manual, OECD, 2002). The Science Budget focuses particularly on R&D and yields the following indicators:
[image:15.595.74.508.405.708.2]GBAORD – Government Budget Appropriations or Outlays on R&D - spending (this chapter) GOVERD – Measure of R&D performed in the Government sector (chapter 3)
GBAORD is the measure of government funding of R&D in all sectors, and includes:
Funding for R&D programmes in the higher education sector administered by the Department of Education and Science, the HEA, SFI and others.
Funding for business sector R&D administered via the state agencies including IDA Ireland, EI and others.
Funding for government sector performed R&D, for example, Teagasc, Marine Institute and others.
2.2 Government budget spending on research and development
The Science Budget has a strong data focus on the public financing of R&D, through EU and exchequer funds. The internationally recognised indicator for benchmarking State funding performance of R&D is GBAORD. In the definitional guidelines laid out in the OECD Frascati Manual, this includes all exchequer and EU funding for R&D projects, and also R&D spending on the arts and humanities.
Figure 8 highlights the substantial increases in GBOARD over the last decade. R&D spending by the government will more than quadruple from €221 million in 1997 to nearly €1 billion in 2007. The average growth rate in GBAORD in the last 10 years has been 16%, among the top performances across OECD countries. This has allowed rapid progress in closing the funding gap for R&D from government sources compared to other EU countries.
[image:16.595.123.475.538.742.2]Between 2006 and 2007, R&D spending growth by the government across all performing sectors will increase by 16% in current price terms. This will represent a re-acceleration of R&D funding growth from the 8.2% gains posted in 2006. In real terms GBOARD is expected to expand by an estimated 10.6% between 2006 and 2007.
Figure 8: GBAORD trend in current prices, (1997-2007)
995 858 793 668 518 467 360 290 230 238 221
0 200 400 600 800 1000 1200
1997 1998 1999 2000 2001 2002 2003 2004 2005 2006 2007
€
m
illio
n
2.3 State spending on research and development
Table 1 provides a breakdown of public R&D funding by the main government departments and offices. The largest department funding R&D projects continues to be the Department of Education and Science which will fund R&D programmes via itself and its agencies totalling €497 million in 2007. The Department of Enterprise, Trade and Employment will be the next largest funder of R&D projects via its agencies in 2007 at €243 million.
Table 1: Government departments and agencies funding R&D activities, (2007)
Funding Department/Organisation GBAORD 2007 (€m)
Department of Education and Science 497
Department of Enterprise, Trade & Employment 243
Department of Agriculture and Food 83
Department of Communications, Energy & Natural Resources 67
Department of Health & Children 51
Office of Public Works 22
Department of the Environment, Heritage & Local Government 13
Department of Social & Family Affairs 8
Department of Finance 0.6
Department of Arts, Sport and Tourism 0.4
Department of Community Rural and Gaeltacht Affairs 0.3
Department of the Taoiseach 1.1
Central Bank 1.1
Department of Transport 0.1
Total 995
The state currently invests in a wide range of R&D programmes which are outlined in more detail in Appendix 7. A summary includes:
€155 million - Science Foundation Ireland. SFI was established in 2000 to support globally competitive scientific research. SFI funds a variety of academic researchers and research teams which aim to promote research excellence in the biotechnology and information communication technology (ICT) sectors. 2007 will see an increase in funding from €132 million to €155 million. The allocation of finance is decided by SFI on the basis of scientific merit.
€93 million- The Department of Education and Science is responsible for the administration of Ireland’s public education system. In 2007 the above amount was allocated for R&D spending at third level. This funding is available to all universities and institutes of technology to support individual researchers, the development of research capabilities and to facilitate co-operation within and between
institutions. Funding will be allocated for research in humanities, social sciences, and S&T. The contribution to R&D from the block grant is not included in this total. This amounts to an additional €260 million.
€58 million – Teagasc is the national body providing advisory, research, education and training services to the agriculture and food industry. Current research projects include those grouped under the heading “sustainable agriculture and rural development” and “food processing”.
€53 million - Enterprise Ireland is the national organisation responsible for bringing together
innovation, business development and internationalisation for Irish industry. They aim to commercialise research and enhance the technological capabilities of industry in Ireland. They manage a variety of S&T sub-programmes on behalf of the Office of Science and Technology, within the Department of Enterprise Trade and Employment.
€47 million - The Health Research Board (HRB) for research award schemes. The research funding aspect of the HRB provides support for projects, programmes and fellowships in health research through an open competition process, along with an element of peer review. Some examples of research currently underway are, investigations into the genetics of schizophrenia, need, use and availability of mental health services in Ireland, and health services management research.
€30 million - IDA Ireland has national responsibility for securing new investment from overseas in manufacturing and international services and for encouraging the existing foreign enterprises to expand their business. An R&D capability assistance grant is available to support the establishment of new R&D functions. Research Technological Development and Innovation (RTDI) grant assistance, is directed at established companies who are planning to undertake their first R&D project, and those companies who intend to expand existing ones.
€23 million - The Irish Research Council for Science, Engineering and Technology, (IRCSET) to fund R&D in science, engineering and technology in third level institutes. It seeks to position Ireland as an international centre of excellence and achievement in research by encouraging students and
researchers to pursue a full time research career in their chosen field. It does this through a series of programmes of assistance, postgraduate research awards and the PhD fellowship scheme.
2.4
Programmes classified by area of research
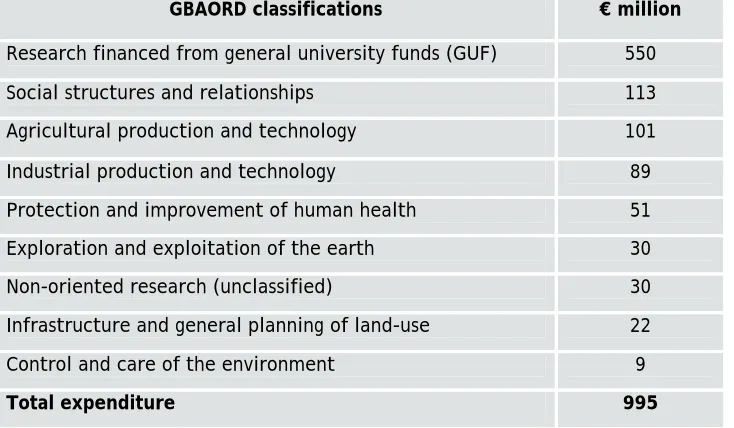
Total anticipated GBAORD for 2007 (€995 million) can be classified into a number of economic areas, as highlighted in Table 2 below. 55% of the GBAORD total funding for 2007 has been earmarked for
performance in the higher education sector, (€550 million general university funds). This includes funding from direct sources such as SFI, HEA, PRTLI schemes, EI and other sources of funding for research in the higher education sector. The GBAORD total aimed at the higher education sector also includes an estimate of indirect funding from the HEA block grant. The amount calculated is the academic portion of the block grant spent on teaching salaries of researchers. This is calculated using a time ratio and unit cost
[image:19.595.53.420.274.488.2]methodology.
Table 2: GBAORD classifications for Ireland, (2007)
GBAORD classifications € million
Research financed from general university funds (GUF) 550
Social structures and relationships 113
Agricultural production and technology 101
Industrial production and technology 89
Protection and improvement of human health 51 Exploration and exploitation of the earth 30
Non-oriented research (unclassified) 30
Infrastructure and general planning of land-use 22
Control and care of the environment 9
Total expenditure 995
The 2006 Higher Education R&D survey (HERD) examines the positive outputs of increased GBAORD in the higher education sector. HERD climbed to €600m in 2006 boosted mainly by increased funding from the public side (totalling €550m and growing by 10.5%), alongside an additional €50m funded from other sources. Increased GBAORD funding to the education sector has therefore allowed a narrowing of the R&D performance gap with our OECD neighbours in the HE sector.
http://www.forfas.ie/publications/forfas070829/forfas-herd-survey-first-findings-2006.pdf
2.5
GBAORD as a percentage of GNP and international comparisons
[image:20.595.85.466.231.462.2]It is possible to measure the relative importance which a government places on R&D by examining GBAORD as a percentage of the country’s economic activity, (GNP). As figure 9 shows, GBAORD and relative GBAORD as a percentage of GNP have increased steadily over the last ten years. The relative GBAORD intensity ratio increases from year to year when the pace of R&D funding growth outpaces nominal growth across the whole economy. GBAORD as a % of GNP has increased from 0.37% in 1997 to 0.62% by 2007.
Figure 9: GBAORD trend and GBAORD as a percentage of GNP, (1997-2007)
In the period 1997-99, the GBAORD intensity ratio fell to 0.30% of GNP as R&D programme spending growth stalled, in contrast to robust overall economic gains. Rapid increases in R&D funding growth between 2000 and 2005, which outpaced still more rapid increases of GNP, allowed the GBAORD intensity ratio to climb once more to 0.58% of GNP in 2005.
In 2006, GBAORD increased by 8.2% compared to the previous year and in line with the pace of economic expansion as measured by GNP. As a result the GBAORD intensity ratio steadied at 0.58% of GNP. In 2007, GBAORD growth is expected to rise once more, increasing by 16% and outpacing the estimated growth in nominal GNP in 2007 of 7.1%. As a result the GBAORD intensity ratio will climb to 0.62% of GNP in 2007.
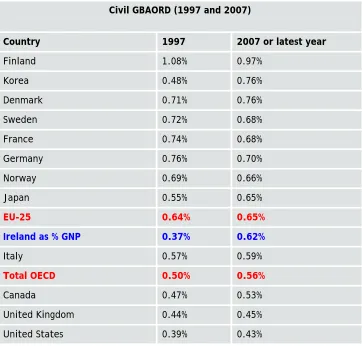
Alongside this overall funding, we can also examine the civil GBAORD figures. Civil GBAORD is a better metric used for international comparisons as it does not include the defence portion of the R&D budget. Countries such as the US, France and the UK will spend a large proportion of their GBAORD budget on defence R&D. In 2007 the US will spend 58% of their GBAORD budget on defence, while the UK will spend 31%. When data is adjusted for these R&D programmes to only include Civil GBAORD programmes the following data can be observed (Table 3).
0.35%
0.37% 0.30% 0.33% 0.37% 0.44% 0.44%
0.53% 0.58% 0.58% 0.62%
238
221 230
995 858 793 668 518 467 360 290
0.0% 1.0% 2.0% 3.0%
1997 1998 1999 2000 2001 2002 2003 2004 2005 2006 2007
0 200 400 600 800 1000
Table 3: Civil GABORD relative comparisons as a percentage of economic activity (GDP/GNP), (1997 and 2007)
Civil GBAORD (1997 and 2007)
Country 1997 2007 or latest year
Finland 1.08% 0.97%
Korea 0.48% 0.76%
Denmark 0.71% 0.76%
Sweden 0.72% 0.68%
France 0.74% 0.68%
Germany 0.76% 0.70%
Norway 0.69% 0.66%
Japan 0.55% 0.65%
EU-25 0.64% 0.65%
Ireland as % GNP 0.37% 0.62%
Italy 0.57% 0.59%
Total OECD 0.50% 0.56%
Canada 0.47% 0.53%
United Kingdom 0.44% 0.45%
United States 0.39% 0.43%
The above table shows that Irish GBAORD performance has improved dramatically over the last decade. Between 1997 and 2007 the civil GBAORD intensity ratio in Ireland climbed from 0.37% of GNP to stand at an estimated 0.62% of GNP – one of the most rapid improvements across OECD countries. Within this same period the European average (EU25) civil GBAORD intensity remained largely static at around 0.64% of GNP, as public allocations and funding for R&D programmes grew at the same pace as economic growth across the EU25. At OECD level, there was a marginally better performance in relative terms. The average civil GBAORD intensity ratio rose from 0.50% GNP in 1997 to an anticipated 0.56% of GNP in 2007.
Figure 10: International comparison of civil GBAORD as a percentage of GDP, (2007) 0.43% 0.45% 0.53% 0.56% 0.59% 0.62% 0.65% 0.65% 0.66% 0.68% 0.70% 0.76% 0.76% 0.97% 0.68%
0.0% 0.2% 0.4% 0.6% 0.8% 1.0% 1.2%
United States United Kingdom
Canada Total OECD Italy Ireland as % GNP Japan EU-25 Norw ay Sw eden France Germany Korea Denmark Finland
Looking further at medium term trends for civil GBAORD, shows that the Irish performance over the period 2002 to 2006/7 has seen one of the strongest growth rates across the OECD (Figure 11). At 16.3% Ireland will rank second out of 15 countries for the highest average annual growth rate of civil GBAORD from 2002 to 2007. This is down slightly on the 2006 figure of 16.6%, but clearly remains at the top end of the table. The civil GBAORD average growth rate in Germany and France was just 1.0% and 0.8% respectively.
Figure 11: Average annual growth rate of civil GBAORD for selected countries, (2002–2006)
0.8% 1.0% 2.7% 3.6% 4.3% 4.9% 5.4% 6.5% 6.8% 8.4% 9.2% 10.1% 11.9% 16.3% 18.1%
0.0% 5.0% 10.0% 15.0% 20.0% 25.0% 30.0%
[image:22.595.116.508.539.790.2]Chapter 3:
Performance of research and development in the
public sector
This chapter examines the performance of research and development in the government sector (GOVERD). This metric is used alongside the other R&D performance metrics of BERD (Business sector performed R&D) and Higher Education R&D (HERD) to calculate total R&D performance in the state (GERD). While the main focus of government R&D funding and performance is concentrated on the higher education sector, a smaller number of government agencies also perform R&D in the State sector. These include institutions such as Teagasc, the Marine Institute and others. The chapter also examines State sector R&D performance compared to other international competitors as well as examining the types and areas of research being conducted across the State sector.
3.1 Total expenditure on research and development performed in the government
sector
[image:23.595.128.472.494.718.2]Total expenditure on R&D performed in the State sector (GOVERD) is expected to total €140.4 million in 2007 (Figure 12). This represents a substantial 17.4% increase in current prices over the actual outturn reported for 2006. In real terms and excluding inflationary effects R&D performed in the State sector is estimated to increase by 11% between 2006 and 2007. GOVERD as a percentage of GNP is expected to therefore rise to 0.09% in 2007 after a drop to 0.08% in 2006. These increases in overall State performed R&D programmes reflect the increased exchequer funding for R&D programmes as highlighted by the government’s SSTI.
Figure 12: GOVERD as a percentage of GNP and GOVERD trend, (1997-2007)
140.4
119.7 127.4 138.4 127.4 125.3
104.1 95.6
63.9 70.0 65.4
0.00% 0.10% 0.20% 0.30%
1997 1998 1999 2000 2001 2002 2003 2004 2005 2006 2007 0 20 40 60 80 100 120 140 160
€
m
il
lio
n
GOVERD/GNP - left axis GOVERD (current) - right axis
Figure 13: Major State research and development performers, (2007)
2.9 4.4
4.9 5.5 6.4
7.2 7.5 9.3
11.2 15.1
66.2
0 10 20 30 40 50 60 70
Department of Social & Family Aff airs Central & Regional Fisheries Board Health Research Board Dublin Institute for Advanced Studies Economic and Social Research Institute Others Department of Communications, Energy & Natural Resources Bord Iascaigh Mhara Department of Agriculture and Food Marine Institute Teagasc
Teagasc is by far the largest performer of State R&D accounting for estimated R&D expenditure of €66.2m. in 2007 (47.2% of total GOVERD). The main focus of Teagasc’s R&D programmes are sustainable agriculture, rural development and food processing. The next largest R&D performer is the Marine Institute with
estimated spending performance of €15.1m in 2007 (10.5% of the total).
Table 4: GOVERD as a percentage of GDP, (2002 and 2007 or latest available data)
Country 2002 2007
France 0.37 0.37
Korea 0.34 0.36
Germany 0.34 0.34
Finland 0.35 0.32
United States 0.32 0.29
China 0.31 0.29
Japan 0.30 0.28
Total OECD 0.27 0.27
Norway 0.26 0.24
EU-27 0.24 0.24
Italy 0.20 0.20
Spain 0.15 0.19
United Kingdom 0.17 0.19
Canada 0.22 0.17
Belgium 0.14 0.14
[image:24.595.56.411.464.790.2]The GOVERD intensity ratio of 0.09% in Ireland in 2007 is amongst the lowest in the OECD (Table 4). The ratio has fallen from 0.12% of GNP in 2002 to 0.09% in 2007. Ireland’s low ratio reflects its smaller public sector, alongside the Irish government’s policy to concentrate on increasing R&D funding and performance in the higher education sector. In the same period the average OECD GOVERD intensity ratio remained steady at 0.27% of GDP, and the European average (EU27) steadied at 0.24% of GDP. The countries with the highest GOVERD ratio were France and Korea, with ratios of 0.37% and 0.36% of GDP respectively. It can also be seen that the UK, Canada, Belgium and Ireland also had relatively low GOVERD intensity ratios.
3.2
Types of Research
The Science Budget survey in addition to accounting information on performed R&D, also asks performing institutions to outline the types of research spending carried out. Collecting data on the types of research being carried out allows analysts and policymakers to assess the progress being made in moving up the value chain regarding the potential outputs and impacts from research expenditure. The OECD Frascati Manual2 defines the three categories of research as follows:
Basic Research – Experimental or theoretical work undertaken primarily to acquire new knowledge, without any particular application or use in view.
Applied Research – Original investigation undertaken in order to acquire new knowledge, primarily directed towards a specific practical aim or objective.
Experimental Development - Systematic work, drawing on existing knowledge gained from research and practical experience that is directed at producing new materials, products and devices, to installing new processes, systems and services, or to improving substantially those already produced or installed.
Table 5: GOVERD by type of research (2007)
Type of Research 2007 €m. % of total
Basic 16 11%
Applied 110 80%
Experimental 12 9%
Total in-house research 138 100%
Table 5 shows expenditure on in-house R&D performed in the government sector for 2007 broken down into the three types of research. As in previous years the type of in-house research that most government departments/agencies engage in is applied research, accounting for 80% of all government in-house R&D spending (EU27 – 46.1% of total GOVERD). Basic research is the next largest type of R&D category accounting for nearly 12% of total GOVERD (EU27 – 30.9% of total GOVERD). Experimental development R&D programmes will account for 9% of the estimated total in 2007 (EU27 – 22.3% of total GOVERD).
2
3.3
Fields of science
The fields of science classifications are defined by the OECD Frascati Manual in agreement with European nations. This classification was revised in certain areas in 2006 to reflect recent changes and new emerging areas of science, such as nanotechnology. The application of the new categories to R&D programmes in the current survey has resulted in some slight changes in the distribution, with a break in some time-series compared to previous years which used the old definitions.
As would be expected with Teagasc being the largest performer of State R&D, the largest field of science in Ireland is agricultural sciences which will account for 66% of the total GOVERD in 2007 (Table 6). Most of the research expenditure on agricultural sciences, which also incorporates fisheries, was incurred by Teagasc; Department of Agriculture & Food; the Marine Institute and BIM. Basic research in this field of science accounted for 7% of total GOVERD.
The next largest category of R&D programmes is natural sciences based programmes which make up around 20% of estimated total GOVERD in 2007. Research carried out by the Dublin Institute for Advanced
[image:26.595.60.454.401.608.2]Studies; the EPA; Department of Communications; Energy and Natural Resources; The Central and Regional Fisheries Board; Met Eireann and SEI make up most of the spending in the natural sciences category.
Table 6: Field of science classified by type of research, (2007)
2007 (€m) Field of Science
Basic Applied Experimental Total
Natural Sciences
5 22 0 28
Engineering and Technology 0 0 1 1
Medical and Health Sciences 2 3 0 5
Agricultural Sciences 6 75 11 92
Social Sciences 2 11 1 13
Humanities 0 0 0 1
Total 16 111 12 139
Chapter 4:
Human resources dedicated to publicly-performed
research and development
This chapter examines the human resources involved in R&D activities performed in the Government sector. Questionnaires were sent to the human resource managers of 41 government departments and agencies requesting details on occupation, gender and PhD status for all personnel involved in R&D activities (researchers and support staff).
A total headcount was requested alongside an estimate of time spent solely on or supporting research. Headcount data was then transformed into full-time equivalents by multiplying the headcount data by the time spent on R&D activities. For example, an R&D unit employing 10 research personnel who spent an average of 40% of their time on R&D activities had 4 FTE research personnel in the unit. FTE data is used as it allows for better international comparisons from country to country where the time spent on research activities can vary greatly.
The occupations of R&D personnel are categorised as follows: researchers with PhDs, researchers without PhDs, technicians and support staff.
4.1
Research and development personnel
[image:27.595.139.460.549.764.2]In 2007, 1,344 R&D personnel were employed by the government sector in headcount terms. In full-time equivalent terms (FTE) 1,256 R&D active staff were employed in the State sector in 2007. Figure 14 below shows the number of personnel working for the State in the area of R&D in headcount terms between 2005 and 2007. There are now 381 PhD qualified researchers, compared with 276 in 2005. The number of non PhD qualified researchers has fallen from 181 in 2005 to 157 by 2007. Total support staff and technicians have also been reduced, though the numbers are not significant.
Figure 14: Total research and development personnel by occupation in headcount terms, (2005-2007)
0 100 200 300 400 500 600
Researchers with PhD
Researchers without PhD
Technicians Other Support Staff
At 61%, support staff and technicians make up almost two thirds of all R&D personnel working in the government sector in FTE terms (Figure 15). The remaining 39% of the total personnel is comprised of researchers, with two-thirds of these researchers PhD qualified.
Figure 15: Total R&D personnel by occupation in FTEs, (2007)
28%
11%
25% 36%
Researchers withPhDs
Researchers without PhDs
Technicians
Support staff
4.2
Gender and qualifications of State sector research staff
An estimated 538 researchers will be employed by the government sector in 2007, in headcount terms. In FTE terms the research total was an estimated 498 in 2007. Around 61% of researchers are male in 2007, with 39% female researchers. There will be a 3.6% increase in the number of female researchers employed by the State, since 2004. Figure 16 show both gender and qualification make-up of researchers working on R&D in the government sector.
Figure 16: Researchers by gender and qualification, (2007)
Female Researchers 39%
Female (PhDs), 25%
Female (Non PhDs), 14%
Male (PhDs), 46% Male (Non PhDs),
[image:28.595.119.485.564.781.2]4.3 Research and development staff by fields of science
[image:29.595.51.515.226.454.2]Table 7 below provides details of the FTE male/female breakdown of researchers by field of science and as a percentage of the totals for 2007. Agricultural biotechnology utilises 43% of male and 39% of female researchers. This research is mostly performed by Teagasc and the Department of Agriculture and Food. A greater share of males perform research in the majority of scientific fields, including physical sciences, biological sciences, earth related science, economics and business.
Table 7: Total male/female (FTE) and as % of total by field of science, (2007)
Field of science Male (FTE) Male % of
Total Female (FTE) Female % of total
Computer and inform. sciences 7.0 2.3% 4.0 2.0%
Physical sciences 38.0 12.6% 13.0 6.6%
Earth and environmental science 33.6 11.1% 19.7 10.1%
Biological sciences 32.5 10.7% 20.0 10.2%
Civil engineering 0.4 0.1% 0.1 0.0%
Health sciences 12.0 4.0% 30.0 15.3%
Agriculture, forestry and fishery 11.5 3.8% 5.3 2.7%
Animal and dairy science 2.0 0.7% 2.0 1.0%
Veterinary science 4.0 1.3% 2.0 1.0%
Economics and business 28.6 9.4% 21.6 11.0%
Sociology 2.0 0.7% 2.0 1.0%
Agricultural biotechnology 130.0 43.0% 76.0 38.9%
History and archaeology 1.1 0.3% 0.0 0.0%
Totals 302.7 100% 195.6 100%
[image:29.595.61.529.597.786.2]Figure 17 shows a gender break down within the different fields of science. Female researchers make up almost 71% of total medical researchers, while male researchers dominate all other categories. For both males and females the agricultural sector comprises almost half the research personnel. The next largest share for both sexes is the natural sciences. 36.7% of male researchers and 28.9% of female researchers are working in this field.
Figure 17: Researchers classified by gender and field of science FTE, (2007)
Fem ale Researchers