EFFECT OF AUDITORY SENSORY
DEPRIVATION ON THE VISUAL SIMON
EFFECT:
A comparison of deaf and hearing individuals
University of Twente - Bachelorthesis Cognition & Media
Monja I. Froboese
(s0163139)
14/11/2010
- 2 -
Abstract
In this study a visual Simon task (standard and crossed- hands subtasks) was used to compare
the performance and the size of a Simon effect between deaf (n=15) and hearing (n=15)
individuals. Due to auditory sensory deprivation and consequently enhancements of visual
perception in deaf participants, faster reactions to peripherally presented stimuli and an
increased Simon effect were expected. Reaction times and the amount of errors showed
comparable results for the two groups, not confirming earlier findings that postulate an
enhancement of peripheral attention and thus better performance of deaf participants (e.g.
Reynolds, 1993). An interaction between compatibility and group in the crossed-hands
subtask indicated an enhanced Simon effect of deaf participants. Some developmental
modulations of the visual system could be detected in this study.
Samenvatting
In dit onderzoek wordt een visuele Simon taak (standaard en gekruiste handen subtaken)
gebruikt om de prestatie en de grootte van een Simon effect van doven (n=15) te vergelijken
met horende (n=15) proefpersonen. Te wijten aan een gebrek aan auditieve sensorische input
en hieruit resulterende verbeteringen van de visuele waarneming van doven, werden snellere
reacties op perifeer gepresenteerde stimuli verwacht, dus een betere prestatie door dove
proefpersonen. Uit een statistische analyse bleek dat reactie tijden en het aantal fouten voor
de twee groepen vergelijkbaar waren. Dit bevestigde niet resultaten uit vorig onderzoek, waar
een verbetering van perifere aandacht en betere prestatie door doven gedetecteerd werden
(e.g. Reynolds, 1993). Een interactie tussen compatibiliteit en groep in de gekruiste handen
subtaak liet een verhoogde Simon effect zien bij dove proefpersonen. Soort van modulaties
van het visuele systeem door ontwikkeling en ervaringen konden in deze studie dus
- 3 -
Introduction
The World Health Organization (WHO) estimated in 2003 that about 250 million people suffer from an impaired auditory function. According to the WHO deafness is defined as ―the complete loss of hearing ability in one or two ears‖ and its numerous reasons include middle ear infections, inheritance, peripartal hypoxic complications, drug toxicity or excessive noise exposure1. As one consequence of deafness individuals suffer from a specific sensory deprivation that has an enormous effect on their everyday life. Relevant auditory information from their environment is not transmitted to the auditory cortex and deaf individuals, therefore, lack important auditory reflex functions (Savelsbergh, Netelenbos and Whiting, 1991). Nevertheless, deaf individuals are able to cope effectively with a world dominated by auditory signals (e.g. alarm bells, telephone, etc.). Finney and Dobkins (2000) proposed that sensory adaptation enables deaf individuals to develop a shift of perception to other sensory modality. For example, visual perception may be improved to compensate for auditory deprivation. This phenomenon is denoted as ―cross-modal plasticity‖ and was shown to involve structural remodeling of various sensory brain areas (e.g. Bavelier & Neville, 2002).
The aim of this study was to analyze the effect of chronic auditory deprivation on triggered motor responses. For a more detailed analysis of possible differences between the two groups
the experiment consisted of two subtasks, a standard and a crossed-hands Simon task.
Background
Visual and auditory information are both important to guide and control behavior (Savelsbergh et al., 1991). As deaf individuals rely heavily on visual information to communicate effectively by the use of Sign Language (Todman & Cowdy, 1993), some authors assumed that an altered visual perception compensates for the deficit in auditory input (e.g. Savelsbergh et al. 1991). Rönnberg, Söderfeldt and Risberg (2000) postulated in their review paper that deaf individuals may have an improved peripheral attention, enhanced spatial cognition, a better memory for faces, better perspective taking abilities, etc, as a consequence of the early reliance on visual perception for effective communication with their environment. In line with this proposal, Stevens and Neville (2006) compared the visual sensitivity of deaf to hearing participants on perimetry tasks. Motion had to be detected either centrally or peripherally (maximal 60°). Whereas no differences between deaf and hearing
1
- 4 -
participants were found when stimuli were presented centrally, deaf participants were
significantly faster in reacting to stimuli appearing in the periphery, compared to hearing controls. Stevens and Neville (2006) alluded to an earlier study of Reynolds (1993) who postulated that deaf individuals have an improved recognition ability of geometric shapes presented in the periphery as compared to controls. According to Neville and Lawson (1986), the fovea is less sensitive to adaptations based on experience compared to the peripheral eye fields because it develops earlier. In EEG and fMRI-studies selective enhancements of visual processing in deaf individuals have been supported. It was found that the amplitude of the early attention-related negativity (N1) in temporal and parietal regions in response to visual stimuli was larger for deaf than for hearing participants (Neville & Lawson, 1986). Interestingly, this effect was only apparent, when stimuli appeared in the periphery (18° of visual field) of the visual field. It was even speculated that deaf allocate their attention to the periphery by default (Dye, Barel & Bavelier, 2007).
Visual perception can be subdivided into two processing routes, namely the controlled ventral pathway for the identification of objects and the more automatic dorsal route for linking perception to motor processes. According to Stevens and Neville (2006), especially the dorsal pathway is more vulnerable to modifications through development and experience
(e.g. Stevens & Neville, 2006) and could therefore be enhanced in deaf individuals.
Thus, as proposed by e.g. Rönnberg et al. (2000), Stevens and Neville (2006) and
Reynolds (1993), individuals with congenital deafness might have an improved perception of visual input due to their early reliance on peripheral visual information in order to detect and localize events.
Linking the Simon effect to deafness
In this study a conflict task was used for the purpose of measuring a possible adaptation of the link between perception and action due to auditory sensory deprivation. In conflict tasks, stimuli consist of task-irrelevant features (e.g. location on the screen) and task-relevant features (color, symbol etc.) determining a required response (Ridderinkhof, 2002; Stürmer, Soetens, Leuthold, Schröter & Sommer, 2002). Accuracy and response times (RTs) are used as an indicator to evaluate the impact of ―irrelevant spatial stimulus-response correspondences‖ (Hommel, 1993), called spatial S-R compatibility (Kornblum, Hasbroucq &
- 5 -
expected to be faster than reactions to incompatible stimuli (―Simon effect‖), indicating an
interaction between S-R compatibility and reaction times (e.g. Fitts & Seegers, 1955; Stürmer et al., 2002; Wascher, Schatz, Kuder & Verleger, 2001; Wascher, 2005).
Various authors tried to explain the difference in reaction times. The Premotor Theory of Attention (PMTA), for example, postulates that an allocation of attention to the location of the stimulus facilitates a reaction to the stimulus due to the neural similarity of attention orientation and action preparation to that particular location (Van der Lubbe & Abrahamse, 2010). According to the facilitation of the action preparation through the allocation of spatial attention, corresponding trials evoke shorter reaction times, compared to incompatible trials, where a re-preparation of action is necessary, represented in slower reaction times (Hommel, Müsseler, Aschersleben & Prinz, 2001)
An alternative explanation of the Simon effect was given by De Jong, Liang and Lauber (1994) and Kornblum et al. (1990) who argued for a dual route model of stimulus processing. They have (independently) developed models of parallel processing consisting of two distinct pathways for processing the different kind of features of the stimulus, namely an unconditional, automatic route and a conditional, intentional route. When task-relevant and task-irrelevant features of a stimulus are compatible, reaction will occur quickly, resulting in
low reaction times- a facilitation effect through the automatic route. But in the case of incompatible demands of the stimulus, the two processing routes will lead to conflicting
response demands (Stürmer et al., 2002). According to Metzker & Dreisbach (2009) the suppression of automatic task-irrelevant demands of the stimuli results in an increase in reaction time (see also Stürmer et al., 2002). Due to a proposed enhancement of the more automatic dorsal pathway in deaf participants and a consequently higher reliance on a direct link between perception and motion processes, an increase in the Simon effect would be the result.
- 6 -
required reaction to relevant symbols with crossed hands. The results of their study showed
that the Simon effect function in the standard condition only increased until RTs of approximately 400ms, followed by a decrease, indicating a visuomotor Simon effect. In the crossed-hands condition the effect function increased in accordance with RTs (Wascher et al., 2001), representing the occurrence of a cognitive Simon effect. The decrease of the effect function in the crossed- hands condition showed that probably more complex spatial representations have been used since the hands were crossed. By including a standard and crossed-hands Simon task in this study, it was possible to evoke a visuomotor Simon effect and a cognitive Simon effect (Wiegand & Wascher, 2007).
Hypotheses and research outline
The aim of this study was to test the effect of early auditory sensory deprivation on the visual Simon effect. A comparison was made between hearing and deaf participants regarding their performance on a Simon task in a standard and a crossed-hands subtask. Due to the early reliance on visual perception of deaf participants (Savelsbergh et al., 1991; Finney & Dobkins, 2000; Todman & Couwdy, 1993) and a proposed augmentation of the visual sensory system, we hypothesized that faster responses and an increased Simon effect will be detected in the sample of deaf participants in comparison to the control group. Deaf participants were
expected to show a greater compatibility effect due to more automatic reactions to stimuli in the periphery that are ipsilateral to the response location, indicated by a difference between
the compatibility effect between the two groups. This expectation applied to both tasks, the standard and the crossed- hands. Based on an enhancement of the automatic dorsal processing route in deaf individuals, especially the visuomotor Simon effect should be greater in deaf individuals, because of correspondence between the anatomical status of the effectors and the response to ipsilateral presented stimuli.
- 7 -
Method
Participants
Thirty healthy adults (8 male; mean age 41 years, range 21-73) with normal or corrected to normal vision were paid 6 euro to participate in the experiment, after signing an informed consent form. A test of peripheral perception showed that participants´ visual fields extended the for this task required field enormously, thus stimuli of the task could be perceived by all subjects without difficulties. Measurements of central view depicted that all participants had a visual acuity above 70%. Fifty percent of the participants were entirely or profoundly deaf bilaterally and suffered from deafness for more than five years (except one participant who is deaf since 5 years). The most common reason for deafness in this sample was heredity, but often the reason was not known (for an overview, see Appendix A). One participant suffered from neurofibromatosis, all other participants were free of neurological disorders. Controls of similar age were chosen to assure that the age range of the two groups were comparable. The Ethical Committee of the University of Twente approved the conduction of the study.
Stimuli and Procedure
The task used in this study was a Simon task with visual stimuli. Stimuli appeared on a laptop screen with a size of 40‖ and participants were seated at a distance of about 40 cm. The color
of the text was white and stimuli were light grey (transparency of 50%). For the task, three stimuli were used: circle, triangle and rectangle with an approximately size of 15x15 mm (see
Appendix B). The sequence of events and collection of data were controlled by the program ―Presentation‖. Each trial began with a white fixation cross in the center of the screen that
remained visible during the whole experiment. A triangle or circle appeared randomly for 200 ms on the left or the right side ( 37°) together with the fixation point. On erroneous execution visual feedback occurred 500 ms after errors were made. In all trials the stimulation was bilateral: a square had the function of a mask and always appeared on the other side than the relevant stimuli. Thus, the task was to react to a circle or triangle by pressing the corresponding left or right shift key.
Task
- 8 -
the second subtask participants crossed their hands, placing their left index finger on the right
shift key and the right index finger on the left (crossed-hands). 32 practice trials were followed by 288 experimental trials in each subtask with randomization of the order of the stimuli and the order of the conditions.
A cognitive recognition test of visual figures had to be executed by means of a paper- and- pencil version of Embedded Figure test (Witkins, 1976; for an example, see Appendix C). Each complex figure included an embedded simple figure and the task was to identify them as quickly as possible. All participants had 3 minutes to search different predefined figures. The scores on this test range from 0 to 18, depending on the amount of figures participants could find in the time interval. Due to a high correlation with Spearman-Brown (.89), in this study the Embedded Figure Test could be used as an indicator for general ability for controlling for a prior difference in cognitive abilities.
Data acquisition and data analysis
The performance on the Simon task was evaluated by means of reaction times and the amount of errors made. Every key press of the participants evoked an evaluation of hits versus misses and a reaction time was calculated, thus quantitative data was gathered. For every participant an average was calculated for compatible and incompatible trials per subtask. Reaction times
were omitted from analysis when they exceeded 1000ms. This procedure resulted in a removal of 17.4% of the data across deaf and 11.2% across hearing participants. Statistical
- 9 -
Results
Embedded Figure Test
Hearing participants could find an average amount of 5.5 (SE: 0.66) figures in 3 minutes; non-hearing participants found on average 4.2 (SE: 0.73) figures in the same time. A statistical test of performance on the Embedded Figure Test showed no significant differences between the two groups, with t(23) = 1.01, p = .32.
Description of the data
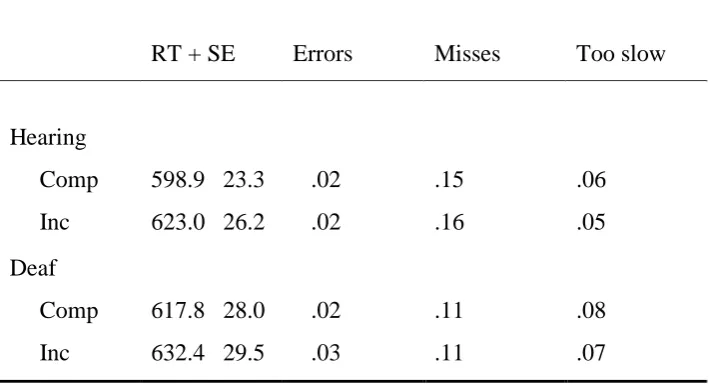
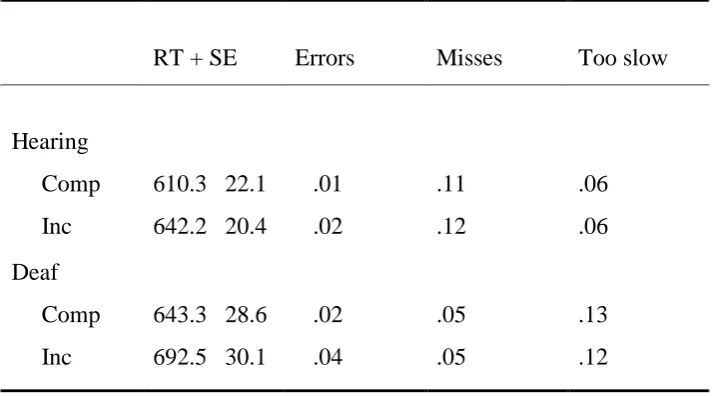
[image:9.595.121.476.517.710.2]All response times were faster than 200 ms which implied the absence of fast guesses. A Kolmogorov- Smirnov test of normality indicated that the data were normally distributed and could be analyzed by parametric methods. The data of five participants (two deaf) were excluded as they did not reach the threshold of 65% usable trials. Mean reaction times, proportions of correct responses, misses and too slow responses of both conditions, as a function of group and compatibility are presented in Table 1 and Table 2.
Table 1
Mean RTs (in ms) with SEs, proportions of errors, misses and too slow responses, as a
function of group (hearing vs. non-hearing) for compatible (Comp) and incompatible (Inc)
trials of the standard hands subtask.
RT + SE Errors Misses Too slow
Hearing
Comp 598.9 23.3 .02 .15 .06 Inc 623.0 26.2 .02 .16 .05
Deaf
- 10 -
Table 2
Mean RTs (in ms) with SEs, proportions of errors, misses and too slow responses, as a
function of group (hearing vs. non-hearing) for compatible (Comp) and incompatible (Inc)
trials of the crossed- hands subtask.
RT + SE Errors Misses Too slow
Hearing
Comp 610.3 22.1 .01 .11 .06
Inc 642.2 20.4 .02 .12 .06
Deaf
Comp 643.3 28.6 .02 .05 .13
Inc 692.5 30.1 .04 .05 .12
Statistical results
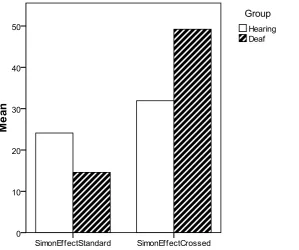
Responses to corresponding trials were significantly faster compared to noncorresponding trials, F(1, 23) = 24.87, p = .000 (standard hands) and F(1, 23) = 68.87, p < .000 (crossed hands). The difference in the deaf sample was 14.6ms in the standard and 49.2ms in the crossed-hands subtask. The hearing participants showed a mean difference of 24.1ms in the standard and 31.9ms in the crossed-hand task. Also, the amount of errors is significantly higher in noncorresponding trials compared to corresponding trials, F (1, 23) = 13.48, p = .001. When analyzing the subtask separately, the amount of errors did not differ significantly between compatible and incompatible trials in the standard (F(1, 23) = 2.54 , p = .125) , but in the crossed-hands subtask (F(1, 23) = 6.48, p = .018). In general, these results indicated the
existence of Simon effects in both groups. A significant interaction of reaction times between subtask and compatibility, F(1, 23) = 17.21, p = .000, showed that the Simon effect was
- 11 -
Comparison of groups
[image:11.595.157.457.312.562.2]The results showed no significant differences between groups regarding the reaction times (F(1, 22) = 1.20, p = .286) and the amount of errors made (F(1, 22) = 1.08, p = .309). The effect of correspondence did not differ between the deaf and the control group. Significant interactions were neither found for reaction times (F(1, 22) = 0.531, p = .474), nor for errors (F(1, 22) = 0.66, p = .425). The compatibility effect, therefore, did not seem to differ across groups. Figure 1 presents a comparison of the size of the Simon effect between the two groups across the subtasks. A statistically significant second-order interaction was found between compatibility x subtask x group regarding the reaction times, with F(1, 22) = 6.46, p = .019.
- 12 -
Subtests
Regarding the amount of errors made, statistical analyses of the two subtests separately did not show deviant results, but did support the findings described above.
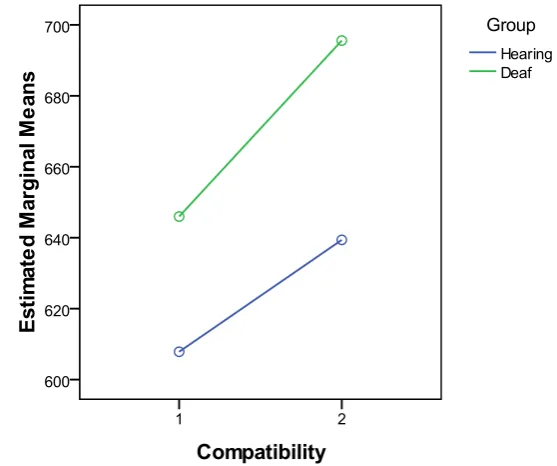
The analysis of reaction times for the separate subtests in general did support the findings described above, too. But a relevant difference was found regarding the size of the compatibility between groups, namely a statistically significant interaction (F(1, 22) = 3.48, p = .076), as presented in Figure 2.
Figure 2. A significant interaction between compatibility (1: compatible trials; 2: incompatible) and group in the crossed-hands subtask.
Age as covariate
Introducing the factor age as covariate in the statistical analysis showed that significant differences existed in reaction times, indicating that these increased with age (F(1, 22) = 8.12,
p = .009). The amount of errors did not differ significantly, with F(1, 22) = 2.03, p = .169. An
interaction between age and compatibility (F(1, 22) = 4.98, p = .036) in reaction times
[image:12.595.153.432.250.483.2]- 13 -
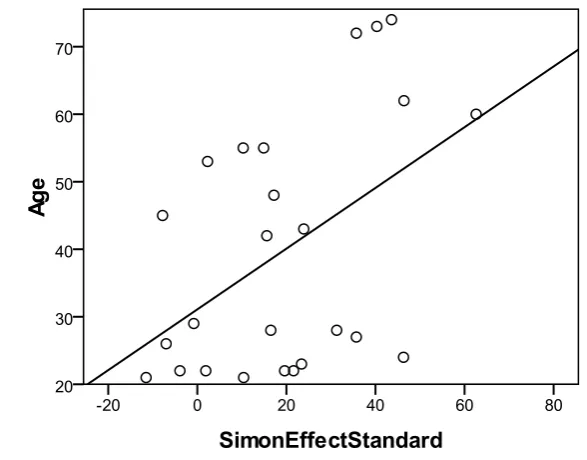
Figure 3. The relation between age and the size of the Simon effect in the standard-hands subtask.
Discussion
A visual Simon task was used to find out if a modulation effect of auditory sensory deprivation could be detected in the performance of the deaf group in comparison to hearing participants.
As expected both subtasks (standard and crossed-hands) showed significant Simon effects.
While reaction times in the standard-hands subtask were approximately 20ms faster to corresponding than to noncorresponding trials, the difference in the crossed-hands subtask
was even 40ms. This showed the proposed advantage for responses at locations ipsilateral to the position of the stimulus (Homel, 1993; Wascher et al, 2000).
[image:13.595.152.446.93.323.2]- 14 -
compatible trials in both subtasks were surprising. This tendency is not in line with previous
findings, where deaf outperformed hearing controls in tasks that required responses to peripherally presented stimuli (Stevens & Neville, 2006; Reynolds, 1993). A variation to the current study, that could be relevant for detecting the impact of early auditory sensory deprivation, was the use of moving instead of static stimuli in their task. Some authors supported the assumption of a higher activation in brain areas of deaf individuals that are sensitive to motion (MT/MST) compared to hearing controls (Stevens & Neville, 2006). So maybe, due to the choice of static stimuli in this study, those general differences between deaf and hearing participants could not be measured.
According to Van der Lubbe & Abrahamse (2010), a necessary requirement for a Simon effect to occur is the allocation of attention for selecting which spatial code exerts effect. This is in line with the Premotor Theory of Attention that holds in that the Simon effect occurs because of similarities of neuronal activity between attention processes and action preparation to that direction (Van der Lubbe & Abrahamse, 2010). Due to modulations of the peripheral attention (e.g. Rönnberg et al., 2000; Neville & Lawson, 1986), faster responses were expected for deaf participants. The fact that an increase in peripheral spatial attention would evoke a decrease in reaction times leads to the conclusion that by comparing the two groups
in this study no increased spatial attention to the periphery could be measured in deaf participants compared to the control group. These results are especially surprising, because
stimuli were presented at a distance of 37 degrees from the fixation point. The amount of eccentricity in this study extended that used in the study of Neville and Lawson (1986) who found an enhanced attention-related N1 component as a consequence of stimuli appearing at approximately 18° of the visual field.
- 15 -
interaction between the amount of Simon effect and group was not found for the
standard-hands task. Even a slight tendency of hearing participants to show a stronger Simon effect in this subtask could be detected in Figure 1. Regarding this result, the question that needs to be addressed is why an increased cognitive Simon effect could be found, but no differences related to the visuomotor Simon effect.
In a recent review paper, Van der Lubbe & Abrahamse (2010) stated that a common representational level for internal coding of stimuli and response is a necessary requirement for a Simon effect to become visible. Related to the idea of a common representational level, Wiegand & Wascher (2007) postulated that spatial response representations for linking stimuli and response vary with the task and depend on participants’ tendency to search for correspondence between the stimuli and the response. Whereas the spatial representation in the standard-hands subtask was a simple location representation, the spatial representation of the crossed-hands subtask is more complex, also indicated by a slowing in reactions. The crossed-hands subtask required more cognitive resources since the location of the effectors did not fit the anatomical status. Higher level cognitive codes, like the context and meaning of stimuli, thus differed between the two subtasks. Those codes need to be linked to lower level codes, such as automatic allocation of attention or activations of motor circuits (Van der
Lubbe & Abrahamse, 2010). A cognitive control mechanism probably playing an important role in this context, is the inhibition of actions that have been activated automatically by test
stimuli (Metzker & Dreisbach, 2009; Stürmer et al., 2002). A decrease in the effectiveness of the inhibitory control due to the enhancement of automatic action activation through the stimuli could have explained differences in the amount of a Simon effect. Greater Simon effects would indicate lower effectiveness. The data of the experiment did indicate that the inhibitory control of deaf participants was reduced, but only when the task was more complex (crossed-hands). Possibly, stimuli in this subtask activated the dorsal visual pathway in a more intensive way in deaf compared to hearing participants, leading to more automatic responses.
- 16 -
The investigation of proposed changes to the visual system of deaf individuals seems to
depend on additional factors, like the complexity of the task used and especially on the choice of participants. A test for age as a covariate depicted a positive correlation between age and the Simon effect (Figure 3). This showed that older people were more sensitive to the compatibility of stimuli and response. These findings are in line with an earlier study (Van der Lubbe & Verleger, 2002) that presented an increase of the Simon effect with age, even when the data were corrected for an age-dependent slowing in response times. Nevertheless, since the broad range of age applied to both groups, this factor was not expected to have had a great influence on the results. But a question to be addressed in general is whether deaf participants were chosen with sufficient care in this study. According to Codina, Buckley, Port & Pascalis (2010) in the age of 5-10 years, deaf subjects reacted slower to stimuli presented in the periphery compared to hearing individuals, whereas at the age of 13-15 years deaf outperformed their hearing controls. This showed that development of an advantage in peripheral attention develops at the age of 10-13 years. Participants that have not been deaf before the age of 10 probably will not have a comparable enhancement at later age. In sum, only individuals who were deaf before that period should be included in further studies. In general, the effects of cross-modal plasticity apparently cannot be extended to the entire
visual system, but seem to be rather specific (Stevens & Neville, 2006). Peripheral attention might be improved in deaf, but maybe it is measurable easier with motion-detection tasks.
Thus, the stimulation of motion-sensitive brain areas is possibly a relevant requirement for detecting differences in performance between deaf and hearing individuals.
Further research should involve additional measurements accompanying the behavioral data. For example the use of an EEG-measure could control eye-fixation and attentional effects. Additionally, a more detailed analysis of the Simon effect function should be used to compare the development of the Simon effect at different reaction time categories (e.g. fast versus slow responses).
Conclusion
- 17 -
References
Ansorge, U. (2003a). Influences of response-activating stimuli and passage of time on the Simon effect. Psychological Research, 67, 174–183.
Bavelier, D. & Neville, H. J. (2002). Cross-modal plasticity: Where and how? Nature Reviews. Neuroscience, 3, 443-452.
Codina, C., Buckley, D., Port, M. & Pascalis, O. (2010). Deaf and hearing children: a comparison of peripheral vision development. Developmental Science, 1-13.
De Jong, R., Liang, C. C. & Lauber, E. (1994). Conditional and unconditional automaticity: a dual-process model of effects of spatial stimulus-response correspondence. Journal of Experimental Psychology: Human Perception and Performance, 20, 731–750.
Dye, M. W. G., Baril, D. E. & Bavelier, D. (2007). Which aspects of visual attention are changed by deafness? The case of the attentional network test. Neuropsychologia 45, 1801- 1811.
Feng, C. (2009). An assessment of inhibition in the Simon task. Unpublished master’s thesis, University of Missouri.
Finney, E. M. & Dobkins, K. R. (2000). Visual contrast sensitivity in deaf versus hearing populations: exploring the perceptual consequences of auditory deprivation and experience
with a visual language. Cognitive Brain Research 11, 171-183.
Fitts, P. M. & Seeger, C. M. (1953). S-R compatibility: spatial characteristics of stimulus and
response codes. Journal of Experimental Psychology: Human Perception and Performance, 46, 199–210.
Hommel, B. (1993). The relationship between stimulus and response in the Simon task: Evidence for a temporal overlap. Psychological Research, 55, 280-290.
Hommel, B. & Lippa, Y. (1995). S–R compatibility effects due to context-dependent spatial stimulus coding. Psychonomic Bulletin & Review, 2, 370−374.
Hommel, B., Müsseler, J., Aschersleben, G. & Prinz, W. (2001). The Theory of event coding (TEC): A framework for perception and action planning. Behavioral and Brain Sciences 24, 849-937.
Kornblum, S., Hasbroucq T. & Osman, A. (1990). Dimensional overlap: cognitive basis for stimulus-response compatibility—a model and taxonomy. Psychological Review, 97, 253– 270.
- 18 -
Neville, H. J. & Lawson, D. (1986). Attention to central and peripheral visual space in a
movement detection task: an event-related potential and behavioral study. II. Congenitally deaf adults. Brain Research, 405, 268-283.
Notebaert, W., Soetens, E. & Melis, A. (2001). Sequential analysis of a Simon task – evidence for an attention-shift account. Psychological Research, 65, 170-184.
Reynolds, H.N. (1993). Effects of foveal stimulation on peripheral visual processing and laterality in deaf and hearing subjects. The American Journal of Psychology, 106, 523-540. Ridderinkhof, K. R. (2002). Activation and suppression in conflict tasks: Empirical clarification through distributional analyses. In: Prinz, W. & Hommel, B. (Eds). (2002). Attention and performance XIX: Common mechanisms in perception and action. Oxford University Press, 494–519.
Riggio, L., Gawryszewski, L. & Umiltà, C. (1986) What is crossed in crossed-hand effects? Acta Psychologica, 62, 89–100.
Rönnberg, J., Söderfeldt, B. & Risberg, J. (2000). The cognitive neuroscience of signed language. Acta Psychologica 105, 237-254.
Savelsbergh, G. J. P., Netelenbos, J. B. & Whiting, H. T. A. (1991). Auditory Perception and the control of spatially coordinated action of deaf and hearing children. Child Psychology
and Psychiatry, 32, 489-500.
Stevens, C. & Neville, H. (2006). Neuroplasticity as a double-edge sword: Deaf
enhancement and dyslexic deficits in motion processing. Journal of Cognitive Neuroscience, 18, 701-714.
Stürmer, B., Leuthold, H., Soetens, E., Schröter, H. & Sommer, W. (2002). Control over location-based response activation in the Simon task: Behavioral and
electrophysiological evidence. Journal of Experimental Psychology: Human Perception and Performance, 28, 1345-1363.
Todman, J. & Cowdy, N. (1993). Processing of visual- action codes by deaf and hearing children: Coding orientation or M-capacity? Intelligence, 17, 237-250.
Van der Lubbe, R. H. J. & Abrahamse, E. L. (2010). The premotor theory of attention and the Simon effect. Acta Psychologica, 136
Van der Lubbe, R. H. J. & Verleger, R. (2002). Aging and the Simon task. Psychophysiology, 39, 100-110.
Wascher, E. (2005). The timing of stimulus localization and the Simon effect. An EEG-study. Experimental Brain Research, 163, 430–439.
- 19 -
of automatic response activation in the Simon task. Journal of Experimental Psychology:
Human Perception and Performance, 27, 731-751.
- 20 -
Appendix
Appendix A: Table of manifestation of deafness and its causes.
Age Deaf since Cause
72 65 years Chronic otitis media
58 >40 years unknown,
possibly infection
45 >20 years Neurofibromatosis Type 2, inherited
44
>40 years (birth)
unknown
22 5 years Anoxia
21 >20 years (birth)
inherited
21 >5years unknown
55 >50years (birth)
unknown
29 >25 years (birth) mother measles when pregnant
42 >20 years inherited
74 >10 years stress,
acute hearing loss
28 >20 years unknown
66 >30 years unknown
27 >20 years (birth)
unknown
28
>20 years
(birth) unknown
- 21 -
Appendix B: Stimuli used in the Simon task.
(1): Relevant stimuli requiring a response:
(2): Irrelevant stimulus (mask):
(3): Example of a trial
- 22 -
Appendix C: An example of the Embedded Figure Test (EFT).