Human Visual Cortex
Serge A. R. B. Rombouts, Frederik Barkhof, Frank G. C. Hoogenraad, Michiel Sprenger, Jaap Valk, and Philip Scheltens
PURPOSE: To investigate the intersubject and intrasubject variability of the activated area in the visual cortex with functional MR imaging. METHODS: Double-section gradient-echo MR images were acquired at 1.5 T in 28 healthy volunteers using the fast low-angle shot (FLASH) technique. Visual stimulation was obtained with light-emitting diode (LED) goggles. Eighteen volunteers were studied twice. The size of the activated areas in the visual cortex and the increase in signal were measured. A reproducibility ratio for size (Rsize) and for location (Roverlap) was calculated on a scale of 0.0 to 1.0. RESULTS: Activation was seen in 89% of the subjects. The size of the activated area was widely variable among subjects: mean, 4606284 mm2; range, 0 to 1029 mm2in the first study in all volunteers. Signal increases ranged from 3.2% to 10.9%, with a mean of 6.661.7%. The mean values of intrasubject variability testing were Rsize50.8360.16 and Roverlap50.3160.11. CONCLUSION: Functional MR imaging with the FLASH technique is useful in identifying certain cortical areas that have quite variable locations among subjects. This study provides reference data for the intrasubject and intersubject variability of the activation pattern of the visual cortex.
Index terms: Magnetic resonance, functional; Magnetic resonance, technique
AJNR Am J Neuroradiol18:1317–1322, August 1997
Several studies have used blood oxygen lev-el– dependent (BOLD) functional magnetic res-onance (MR) imaging to measure human brain activation in the motor (1, 2) or visual (2– 6) cortex. Activation in the auditory cortex (7, 8) or in areas activated by higher cognitive func-tions like speech (9), word generation (10), and working memory (11) has also been measured with BOLD functional MR imaging. Visual par-adigms are probably most widely studied, and,
recently, functional MR imaging has revealed borders of multiple visual areas in human sub-jects (12). However, the structure, size, and even location of the visual cortex differs from person to person (13). In addition, subjects un-dergoing functional MR imaging can be classi-fied into three groups: those who show consis-tent activation in the expected area, those who show variable results, and those who show no activation at all.
In one study, three subjects were tested for test-retest reliability using a cognitive para-digm (J. D. Cohen, D. C. Noll, L. Nystrom, “Qualitative and Quantitative Assessment of Test-Retest Reliability of Functional MRI Data,” presented at the annual meeting of the Society of Magnetic Resonance and the Euro-pean Society for Magnetic Resonance in Med-icine and Biology, Nice, France, August 1995), and Yetkin et al (14) tested four sub-jects using a sensory and motor paradigm. We investigated the size and reproducibility of ac-tivated areas in the visual cortex in a large group of healthy volunteers.
Received October 19, 1996; accepted after revision February 10, 1997. Presented in part at the meeting of the International Society for Mag-netic Resonance in Medicine, New York, NY, April 27 to May 3, 1996.
Supported in part by “Stichting Vrienden MS Research” (grant 93–156). Dr Rombouts is the recipient of a Universitair Stimulerings Fonds grant from Vrije Universiteit Amsterdam, the Netherlands.
From the Departments of Clinical Physics and Engineering (S.A.R.B.R., F.G.C.H., M.S.), Diagnostic Radiology (F.B., J.V.), and Neurology (P.S.), University Hospital Vrije Universiteit, Amsterdam, the Netherlands.
Address reprint requests to P. Scheltens, MD, PhD, Department of Neurology, Academisch Ziekenhuis VU, PO Box 7057, 1007 MB Amster-dam, the Netherlands.
AJNR 18:1317–1322, Aug 1997 0195-6108/97/1807–1317
©American Society of Neuroradiology
Subjects and Methods
Studies were done on a 1.5-T MR unit using a standard circularly polarized head coil. Twenty-eight healthy volun-teers (15 men and 13 women, 19 to 33 years old) without ocular refraction anomalies, history of vision loss, or color blindness participated in a complete visual stimulation study, and 18 of these subjects were studied a second time after a period of 1 to 3 weeks. Informed consent was obtained after the nature of the procedures had been fully explained.
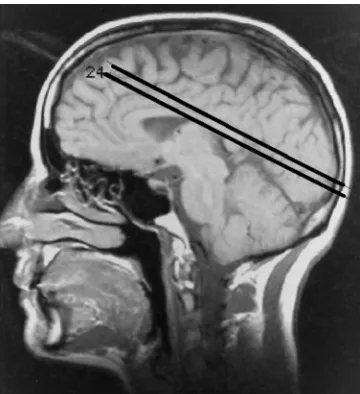
Subjects were positioned with the standard equipment. First, a localizer scan was made in all three orthogonal directions to verify visually whether the midsagittal plane appeared vertical in the coronal and axial images. Next, T1-weighted sagittal images were acquired to locate the calcarine fissure. For the axial functional MR images, sec-tions were placed parallel on either side of the calcarine fissure (Fig 1) and first-order shimming was performed manually. This procedure of defining the two sections was done by the same investigator in each of the two studies. The functional MR imaging measurement consisted of a double-section flow-compensated (read direction and through-plane) fast low-angle shot (FLASH) sequence (15) with the following parameters: 91/60/1 (repetition time/echo time/excitations), a flip angle of 15° to reduce inflow effects (16), a section thickness of 5 mm, a field of view of 250 mm, a matrix of 1282 sinc-interpolated to
2562, an intersection gap of 1 mm, an acquisition time of
14 seconds, and a bandwidth of 19 Hz per pixel. Twenty-five images of both sections were acquired in an alternat-ing manner: five duralternat-ing rest, five duralternat-ing visual stimulation, and so on. All subjects underwent the same visual para-digm while wearing modified goggles (Grass Instruments, Quincy, Mass) with two 536 light-emitting diode (LED) matrices, one in front of each eye. It was made sure that the goggles fitted each subject well, and all subjects were
instructed to lie completely still throughout the study and to keep their eyes open. During the rest periods, subjects were lying in the dark, since the goggles were turned off and no light from outside could enter the goggles. During the stimulation periods, the goggles were turned on and the visual field of each eye was illuminated with a flashing red light (8 Hz).
All postprocessing was done using the 2562 images.
During postprocessing, images were corrected for possible small movement artifacts with a simplified version of the algorithm described by Woods et al (17), correcting for in-plane translations and using linear interpolation. Stabil-ity of the signal of the functional MR images during the examination was verified visually by viewing the signal of an area near the calcarine fissure in time. Signal-to-noise ratio (SNR) was calculated for the gray/white matter in the occipital region with the formula SNR 50.655 3(Mave, tissue/MSD, background), with Mave, tissuethe average of the
signal of the gray/white matter and MSD, background the
standard deviation of the background signal (18). SNR values had to be high enough so that activation could be detected. Activation was detected with the correlation method (19). A boxcar function with the same on-off pe-riod as the stimulus was used as a reference. No delay was used, since acquisition time was longer than the expected hemodynamic response time. Areas in the occipital region were considered activated when the correlation value was 0.5 or higher (P , .01 per pixel) and when the areas consisted of at least four connected pixels that were acti-vated. Next, the size of the total activated area in the primary visual cortex and its mean signal increase were measured.
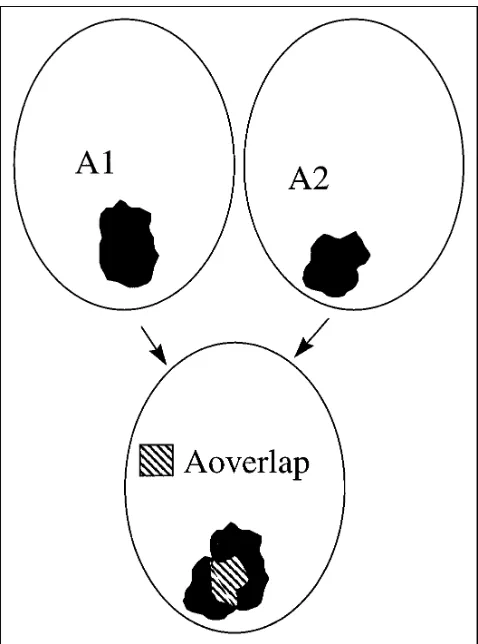
To test for reproducibility, we first considered the size of the activated area in the first (A1) and second (A2) studies for all 18 subjects who were studied twice. As a measure of reproducibility, ratio Rsizewas calculated as Rsize 5 12
uA12A2u/(A1 1A2). This ratio varied between 0.0 (no reproducibility of size) and 1.0 (perfect reproducibility). Second, we considered the location of the activated area in each subject: images of the second study were matched to images of the first study on a pixel-by-pixel basis, with the same algorithm that was used for motion correction. Next, the size of the areas activated in both studies (Aoverlap)
were determined and the ratio Roverlap 5 2 3 Aoverlap/
(A11A2) was calculated. This ratio was a measure of the reproducibility of the size and the location of the activation: in case of perfect reproducibility, this ratio was 1.0. A diagram illustrating the method of calculating these two ratios appears in Figure 2.
Results
[image:2.587.79.259.83.280.2]One subject was unsuccessfully studied be-cause of claustrophobia. In the first study of the remaining 27 subjects, no large motion artifacts were found. The signal was stable and SNR ranged from 95 to 145. Only in two subjects was no reliable activation detected. In these two Fig 1. Parasagittal scout view shows positioning of the two
cases, either there was no activation of at least four connected pixels or pixels were artifactu-ally activated outside the region, near the cal-carine sulcus, which were indistinguishable from activated pixels inside this region, and all activated pixels were considered to be artificial. Possible explanations include small, undetected stimulus-correlated motion or scanner instabil-ity.
Figure 3A is an example of an activation pat-tern in one section in one subject; Figure 3B plots the signal intensity in this area. The total activated area in the two sections for the 25 subjects who showed activation ranged widely, from 125 to 1029 mm2(mean6SD, 496 mm2 6 262). Not only size but also the signal in-crease in the activated areas differed: in Figure
4 the size of the activated area is plotted against the signal increase. Signal increases ranged from 3.2% to 10.9% (mean, 6.6%6 1.7).
Of the 18 second studies, one had to be ex-cluded owing to technical problems. For the remaining 17 subjects, signal stability and SNR were found to be of the same order as in the first examination and, again, no large motion arti-facts were detected. The results from the two subjects who showed no activation in the first study were consistent in the second; that is, no reliable activation was seen. The other 15 sub-jects showed activation in both studies. The size of the activated areas ranged from 112 to 908 mm2 in the second study (mean, 474 mm2 6 226). We found no significant difference in size of activated areas between the two studies (nonparametric test,P 5.61). Signal increases in the activated areas ranged from 4.5% to 10.0% (mean, 6.4%61.7). Figure 5 shows the size of the activated area in the second study plotted against the size in the first study. In cases of perfect reproducibility of measured size, points appear on the line, which has a slope of 1.0 in the graph. Again, one can see that the range in activated areas (ie, intersubject variability) is large.
In testing for location of the activated area, all images from the second study were matched to the images from the first study for each subject. The borders of the images from the first study were marked and overlaid on the borders of the matched images from the second examination. In one subject, images of the first and second study could not be matched correctly because the sections differed too much in orientation owing to a placement error. In the 14 remaining subjects with activation in both studies, the re-sult of the matching procedure was found to be acceptable after visual inspection. These were used for further analysis. For these subjects, areas that were activated in both studies could be distinguished from areas that were activated in either study alone.
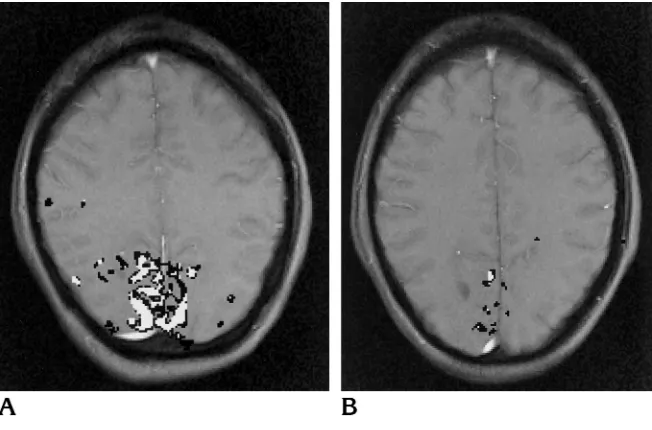
Figure 6 shows the activated areas in a sub-ject who showed high reproducibility (Fig 6A) and in a subject who showed less activation and also less reproducibility of the location of the activated area (Fig 6B). Overlapping activated areas (activation in both studies) in the visual cortex were found for all subjects. The size of the overlapping areas of all 14 subjects ranged from 45 to 477 mm2(mean, 162 mm26120). The overlapping areas exhibited a typical pat-Fig 2. Diagram illustrates the method for calculating the
[image:3.587.49.288.82.404.2]tern: in general, they formed a “center of pixels” activated in both studies surrounded by pixels that were activated in either study alone. The mean signal increase of overlapping areas was 6.7% 6 1.8 (range, 4.0% to 10.3%); for areas activated in either study, the mean signal in-crease was 6.2%61.2% (range, 3.9% to 8.1%). The difference was not significant (P 5 .06, Wilcoxon’s signed rank test, two-tailed). Fur-ther, if we consider areas that were merely sig-nificantly activated in one study, we find that this area also showed a small signal increase in
[image:4.587.89.507.84.281.2]the other study, although no significant activa-tion was detected in that session. These signal increases were observed with all subjects and ranged from 0.30% to 3.20% (mean, 1.61%60.75). The mean value of Rsize was 0.83 6 0.16 (range, 0.48 to 0.98); the mean value of Roverlap was 0.31 6 0.11 (range, 0.15 to 0.50). From the high values of Rsize it can be seen that re-producibility of the number of activated pixels was high. Yet a number of activated pixels dif-fered in location between the first and second studies, resulting in a lower Roverlap.
Fig 4. The total size (in mm2) of the activated area (sections 1 and 2) plotted against mean signal increase (in %) of the activated area for all 25 subjects who showed activation in the first study. Note wide range in size and signal increase.
Fig 5. Size of activated area in the second study (in mm2) plotted against size in the first study for the 17 subjects in whom a technically successful second study was obtained. Note that two subjects in each study showed no activation. The slope of the line is equal to 1.0; for subjects with perfectly reproducible sizes, points are on this line.
Fig 3.A, Example of the area activated upon visual stimulation (8-Hz flashing LED goggles) superimposed on an anatomic image. Pixels with correlation values higher than 0.5 are seen inblack. This subject has a large area of activation in the visual cortex.
[image:4.587.306.548.347.480.2] [image:4.587.49.290.349.491.2]Discussion
Activated areas were found in 25 (89%) of our 28 subjects. One subject was claustrophobic, and in the remaining two (7%), no activation was found in either session. The size and shape of the activated areas exhibited a large intersub-ject variability, with activated areas ranging from 125 to 1029 mm2, consistent with the notion that the size and location of the visual cortex differ among individuals (13). The mean ratio of reproducibility of sizes of activated areas within subjects was 0.83 60.16; for reproduc-ibility of location, the mean ratio was 0.31 6 0.11, on a scale of 0.0 to 1.0.
Reproducibility of the location and shape of activated areas displayed overlapping areas in each subject. A test-retest study with a cogni-tive paradigm (Cohen et al, “Qualitacogni-tive...”) showed areas of activation in the prefrontal cor-tex as measured with BOLD functional MR im-aging. These areas showed local spatial varia-tion across tests. Reliable centers of activavaria-tion, surrounded by pixels that were active in either study alone, were detected. We also found cen-ters with activation in both studies, surrounded by pixels that were active in only one of the studies. In most subjects, the signal increase was highest in these centers, but the difference in signal increase was not statistically signifi-cant.
In the study by Yetkin et al (14), test-retest reliability was studied on a motor and sensory paradigm within a single imaging session. Re-producibility ratios were between 0.39 6 0.39 and 0.59 6 0.15 and it was found that higher
correlation values did not improve reproducibil-ity. The ratios that were used in that study have no upper limit: perfect reproducibility would produce infinite ratios. Their technique would give Roverlap between 0.44 and 0.54. Further, our study differs from the study of Yetkin et al (14) in three respects. First, our second study was done after an interval of 1 to 3 weeks, introducing more sources of variation, similar to those that may be expected in a clinical setting (repositioning, time of the day, and so on). Sec-ond, the visual cortex is known to be a large and complicated structure; reliability studies using different paradigms are likely to give different results. Third, our sample size was larger, pro-viding more reliable statistics.
Our study was aimed at measuring the repro-ducibility of FLASH functional MR imaging in two sections placed parallel to the calcarine fissure in a situation comparable to a practical clinical setting. The technique we used was lim-ited by the small number of sections measured and therefore could not detect all areas of acti-vation. Moreover, repositioning between the studies introduced possible differences in mea-sured activation patterns. Echo-planar imaging has the advantage of providing very fast acqui-sitions, thus affording the possibility of measur-ing multiple sections with increased statistical power. With multisection echo-planar acquisi-tions and three-dimensional matching proce-dures, results might be more reproducible. Such studies would prove extremely useful. Since echo-planar imaging requires special hardware, and two-dimensional techniques are more Fig 6.A, Example of high reproduc-ibility: the area that is activated in either of the two studies is shown inblack; the area that is activated in both studies is shown in white. The total size of the area (sections 112) showing activation in both studies is 477 mm2. Total R
sizeis 0.96 and Roverlapis 0.50.
B, Example of less activation and less reproducibility than seen inA. The size of the area activated in both studies is 60 mm2; R
[image:5.587.50.376.84.299.2]widely available, we expect that a substantial number of clinical applications using functional MR imaging will be done with single- or double-section FLASH techniques. Further, echo-pla-nar techniques suffer from reduced spatial res-olution and image distortion.
The difficulty in explaining intrasubject vari-ation lies in the fact that the sensitivity of the method is not entirely known. In our studies, SNR, motion, and temporal stability were ac-ceptable and cannot explain the observed vari-ation. The influence of another important factor, the position of the sections, was kept to a min-imum by defining this location with precision in each examination. Further, the results of Yetkin et al (14) suggest that repositioning may not be the main cause of differences in activation pat-terns between two studies. Even without repo-sitioning errors (by design), reproducibility in their study was comparable to ours. Within sub-jects, the number of activated pixels was quite reproducible, but the location of activation dif-fered. Pixels that were activated in one study but not in the other also showed a signal increase in the latter study, indicating that part of the intra-subject variation may be explained by physio-logical effects.
In conclusion, two-dimensional BOLD func-tional MR imaging with the FLASH technique is useful in identifying certain cortical areas that have quite variable locations among subjects. Given this variability, the diagnostic implica-tions of a single BOLD functional MR examina-tion using the FLASH technique remain to be determined. The technique might be more suit-able for the follow-up of individual patients over time, for which this study provides reference data.
Acknowledgments
We thank Herman Ader for assistance with the statisti-cal analysis and Per E. Roland for valuable comments on the manuscript.
References
1. Bandettini PA, Wong EC, Hinks RS, Tikofsky RS, Hyde JS. Time
course EPI of human brain function during task activation.Magn
Reson Med1992;25:390 –397
2. Kwong KK, Belliveau JW, Chesler DA, et al. Dynamic magnetic resonance imaging of human brain activity during primary
sensory stimulation.Proc Natl Acad Sci U S A1992;89:5675–
5679
3. Ogawa S, Tank DW, Menon R, et al. Intrinsic signal changes accompanying sensory stimulation: functional brain mapping with
magnetic resonance imaging.Proc Natl Acad Sci U S A1992;89:
5951–5955
4. Frahm J, Bruhn H, Merboldt KD, Ha¨nicke W. Dynamic MRI of
human brain oxygenation during rest and photic stimulation. J
Magn Reson Imaging1992;2:501–505
5. Blamire A, Ogawa S, Ugˇurbil K, et al. Dynamic mapping of the
human visual cortex by high speed magnetic resonance imaging. Proc Natl Acad Sci U S A1992;89:11069 –11073
6. Menon R, Ogawa S, Kim S-G, et al. Functional brain mapping
using MRI: signal changes accompanying visual stimulation.
In-vest Radiol1992;27(Suppl 2):S47–S53
7. Binder JR, Rao SM, Hammeke TA, et al. Functional magnetic
resonance imaging of human auditory cortex.Ann Neurol1994;
35:662– 672
8. Binder JR, Rao SM, Hammeke TA, Frost JA, Bandettini PA, Hyde JS. Effects of stimulus rate on signal response during functional
magnetic resonance imaging of auditory cortex.Brain Res Cogn
Brain Res1994;2:31–38
9. Hinke RM, Hu X, Stillman AE, et al. Functional magnetic
reso-nance imaging of Broca’s area during internal speech.
Neurore-port1993;4:675– 678
10. McCarthy G, Blamire AM, Rothman DL, Gruetter R, Shulman RG. Echo-planar magnetic resonance imaging studies of frontal
cor-tex activation during word generation in humans.Proc Natl Acad
Sci U S A1993;90:4952– 4956
11. Cohen JD, Forman SD, Braver TS, Casey BJ, Servan-Schreiber D, Noll DC. Activation of the prefrontal cortex in a nonspatial
working memory task with functional MRI.Hum Brain Map1994;
1:293–304
12. Sereno MI, Dale AM, Reppas JB, et al. Borders of multiple visual areas in humans revealed by functional magnetic resonance
im-aging.Science1995;268:889 – 892
13. Sarkisov SA. Grundrißder Struktur und Funktion des Gehirns.
Berlin, Germany: VEB Verlag; 1967:257–263
14. Yetkin FZ, McAuliffe TL, Cox R, Haughton VM. Test-retest
preci-sion of functional MR in sensory and motor task activation.AJNR
Am J Neuroradiol1996;17:95–98
15. Haase A, Frahm J, Matthaei D, Ha¨nicke W, Merboldt K-D. FLASH
imaging: rapid NMR imaging using low flip-angle pulses.J Magn
Reson1986;67:258 –266
16. Frahm J, Merboldt K-D, Ha¨nicke W, Kleinschmidt A, Boecker H.
Brain or vein-oxygenation or flow? On signal physiology in
func-tional MRI of human brain activation.NMR Biomed1994;7:45–53
17. Woods RP, Cherry SR, Mazziotta JC. Rapid automated algorithm
for aligning and reslicing PET images.J Comput Assist Tomogr
1992;16:620 – 633
18. Henkelman RM. Measurement of signal intensities in the presence
of noise in MR images.Med Phys1985;12:232–233
19. Bandettini PA, Jesmanowicz A, Wong EC, Hyde JS. Processing strategies for time-course data sets in functional MRI of the human