Printed in Great Britain
A STUDY OF THE DEFORMABILITY OF RED BLOOD
CELLS OF A TELEOST FISH, THE YELLOWTAIL
(SERIOLA QUINQUERADIATA), AND A COMPARISON WITH
HUMAN ERYTHROCYTES
BY G. M. HUGHES,• Y. KIKUCHIf AND H. WATARI National Institute of Physiological Sciences, Okazaki, Japan
(Received 27 March 1981)
SUMMARY
The blood of a carangid fish, the yellowtail (Seriola quinqueradiata) has been studied with particular reference to the deformability properties of the red blood cells. The rate at which blood flows through a Nuclepore filter containing 5 /im pores has been determined under the same conditions that have been used with human blood. Marked differences were found in the flow of yellowtail blood which depended on the particular way in which the blood had been sampled. Such differences seem to be due to a sensitivity of fish red blood cells to their environmental conditions. Blood flow through filters is temperature-dependent, the rate increasing with a rise in tempera-ture. Measurements made at 37 °C gave values which were similar to those normally obtained for human red blood cells, in spite of their greater dimensions (10-4 x 6-8 x 3-4 /im), and nucleated nature. It was also found that the blood flow rate of human blood was slower than that of yellowtail blood when measured at the normal environmental temperatures (15 °C) for these fish.
INTRODUCTION
Many factors are involved in the transfer of oxygen from air or water to the blood in the respiratory organ and between the blood and cells of the tissues. Analyses, both physiological and morphological, have tended to emphazise features such as the distances for diffusion of oxygen across different parts of the barrier (Weibel, 1971; Hughes, 1972), and although flow conditions in air, water, or blood have also been taken into account (Hughes, 1966; Hills & Hughes, 1970; Scheid & Piiper, 1976), relatively few studies (Fung & Sobin, 1977) have considered factors which influence the resistance to blood flow through the microcirculation of gas exchange organs. Measurements of properties of red cells concerned with their deformability in the microcirculation have included determinations of blood viscosity (Dintenfass, 1977), but more directly have used suction methods on single red cells (Rand & Burton, 1964). Perhaps a more appropriate measure is that using many red cells either in suspensions (Schmid-Schoenbeim, Wells & Goldstone, 1969) or whole blood (Reid
210 G. M. HUGHES, Y. KIKUCHI AND H. WATARI
et al. 1976) passing through filter membranes of known pore size under a standard pressure difference. Some indirect studies have included measurements of the effects on perfusion of the lung vasculature following heat treatment with chemical agents known to stiffen the red cell membranes (Greene et al. 1973).
Recent studies using human red blood cells have drawn attention to the ways in which their deformability, during passage through the microvasculature, may vary in relation to the haematocrit and physico-chemical features of the blood (Kikuchi, Horimoto & Koyama, 1979; Y. Kikuchi & T. Koyama, in preparation). The finding that deformaility of red cells may vary in relation to their physico-chemical environ-ment (Kikuchi et al. 1979) and that measureenviron-ments of R.C.D. can help in diagnosis of certain conditions has been made possible by improvements in the nucleopore technique (Kikuchi et al. 1979, 1980). As yet no measurements are available for lower vertebrates and this would seem to be of special interest not only because of differ-ences in body temperature but also because non-mammalian vertebrates have nucleated red blood cells, which might be expected to influence their physico-chemical proper-ties and hence deformability. Furthermore, red blood cells of many lower vertebrates are much larger than those of mammals and their life-span is longer.
This method has revealed significant differences in the flow properties of blood following different commonly accepted methods of sampling and some marked effects of temperature on the flow of both human and fish blood cells.
MATERIALS AND METHODS
The fish mainly used in these experiments were specimens of yellowtail (Seriola quinqueradiata) of 1-1-5 kg body weight. The fish were kept in sea-water circulation of the Institute for Physiological Sciences, Okazaki, at 15 °C after having been obtained from commercial dealers where the fish are often living at 20 °C.
Blood sampling was carried out by three main methods.
(1) Without being anaesthetized the fish were stunned by a blow on the head, and after minimal dissection deoxygenated blood was taken from the heart by heparinized syringes.
(2) The second and third methods involved anaesthesia (quinaldine, 1 g/10 1 sea water) of the fish followed by cannulation of the dorsal aorta during continuous circulation of aerated anaesthetic (0-5 g/1) over the gills. The method used was modified from that described by Soivio, Nyholm & Westman (1975) in which, following the insertion of a thin polyethylene tubing containing a sharpened stainless-steel wire, the latter is removed after it has penetrated the junction of the first efferent branchial arteries at the anterior end of the dorsal aorta. Blood was readily obtained immediately following such insertions while the fish was still under anaesthesia, and consequently fairly hypoxic as was indicated by the very dark colour of the blood. (3) The third method involved sampling from the same cannulae as used in (2) several days after the fish had recovered from the anaesthetic and operation, this blood being well oxygenated.
Blood sample 0-5 ml syringe '••..
Membrane filter
Saline infusion
Three-way tap
Reservoir
[image:3.451.99.354.68.370.2]Constant negative pressure
Fig. i. Diagram to show basis of apparatus used for measurement of red cell defonnability. Blood inserted into the 0-5 ml syringe is made to flow through the Nuclepore filter by the imposed suction pressure of 10 cm H,O. After measurement the system is washed with saline and a new filter is infused with saline before insertion of the next sample.
red cells because they have a significant metabolic rate which may be as much as 5 % of the fish's resting O2 uptake (Eddy, 1975).
haemato-212 G. M . HUGHES, Y. K I K U C H I AND H . WATARI
crit increases. This illustrates the principle used for measurement of red cell deform-ability using this method. It is clear that the quality of the filter used for these measure-ments is of great importance. In order to check the condition of each filter, a saline sample was timed as it flowed through each filter before a measurement was made using the blood sample. The values obtained for saline were found to lie within a timing error (o-i s for total saline passage time of c. 50 s), mainly due to observers' variations. The filters seemed to be satisfactory for the purpose of comparing the blood flow rates of different samples with one another. Other factors affecting blood flow through the filter are considered in the Discussion.
Small portions of each sample were used for measurement of haematocrit and red cell counts (Neubauer bright line). All values given relate to the heparinized sample and are not corrected for saline dilution. Dimensions of 50 red cells in each of the samples used for counting were measured using an eyepiece micrometer (Table 3).
_. . . , . RESULTS
Kelatum to haematocrit
In general, blood obtained by each of the three sampling methods showed a relationship to haematocrit but the particular times involved varied according to the treatments. In all cases, blood of higher haematocrit had a longer blood passage time at 15 °C using 5 /im filter and a pressure difference of 10 cm water. Plots given in Fig. 2 indicate that the three types of sampling used provide blood of different characteristics with respect to the rate at which they flow through such filters.
In order to take into account differences in haematocrit of different blood samples, a simple analysis has been developed (Kikuchi et al. 1980). Blood flow through the filter is composed of flow through many parallel pores in each of which the red cells and plasma are passing successively. On average, the length of a red cell as a column in a pore (a) relative to that of successive columns of plasma in the same pore (b) should be related to the haematocrit value (h, expressed as a fraction); a /(a + b) = h on average. Red cells take various times to pass through individual pores; the mean passage time (3JLp) is the time taken for a single cell to pass through the pore. The plasma can flow at its own speed (Vp) for a time interval of {b-l)/Vp (where / is the length of a pore)
until the next red cell blocks the pore opening. Therefore, a blood volume of (a + b) • S (S = cross-sectional area of a pore) flows through a pore for an interval of 2^,+ [(b-l)/Vp]. When (a + b)-S is mutliplied by the total number of pores A-d (A =
total area through which blood flows, d is pore density) a value is obtained for the blood volume which flows through the whole filter during the same interval. Thus the flow rate through the filter is given by the following relationships:
40
Haematocrit (%)
Fig. 2. Relationship between haematocrit value and the passage time for heparinised blood through Nuclepore filters of 5 fim. Data from experiments in which blood was sampled by three methods are shown: (A) blood obtained directly from heart, (B) blood obtained via cannula during an operation, (C) blood samples subsequently obtained from such cannulae. Two values (open circles) for blood obtained directly from the heart of a sea bream are included in (A). Arrows in (C) indicate the order of sampling (see text pp. 216, 217).
214 G. M. HUGHES, Y. KIKUCHI AND H. WATARI
Table i. Yellowtail. Values for RBC passage time (ms ± s.D.) of blood taken under three different conditions at 15 °C
Blood directly from Blood from cannula Blood via chronic heart immediately after operation cannula
2Q 5'20±I-6o
(n = 8) (n = 9) (» = 7)
Mean RBC passage time in relation to blood sampling method
The mean passage time for red blood cells when blood is subjected to a pressure difference of 10 cm water is given in Table 1 together with the standard deviations. It is apparent that blood sampled directly from the heart has the shortest passage time. Results with blood taken from the hearts of different fish were closely grouped with passage times between 2 and 3 ms. Blood taken from cannulae during the operation gave the longest RBC passage time (10-13 ms). The spread of data for blood taken from the chronic cannulae was greater and on average had a value intermediate between those for the other two types of sampling.
In all cases the measurements were made in as short a time as possible following the blood sampling. Often this was less than 5 min but never much greater than 1 h, the longer time resulting from the need for equilibration at different temperatures. The nature of the differences found according to the sampling method might suggest that blood taken during anaesthesia had the longest passage time because of some direct effect of anaesthesia on the membrane of the red cells. Another factor involved in this situation, of course, is the blood oxygen tension and pH. In more recent experiments in which these features were measured it has been found that the blood POi seems to have a marked effect, and the conclusion has been reached that anaes-thesia as such has little direct effect (G. M. Hughes & Y. Kikuchi, in preparation). There are also complications, however, because of the effect that hypoxia has upon the red cell population age distribution. In yellowtail, other studies have indicated that there might be a release of new red cells into the blood stream during such conditions.
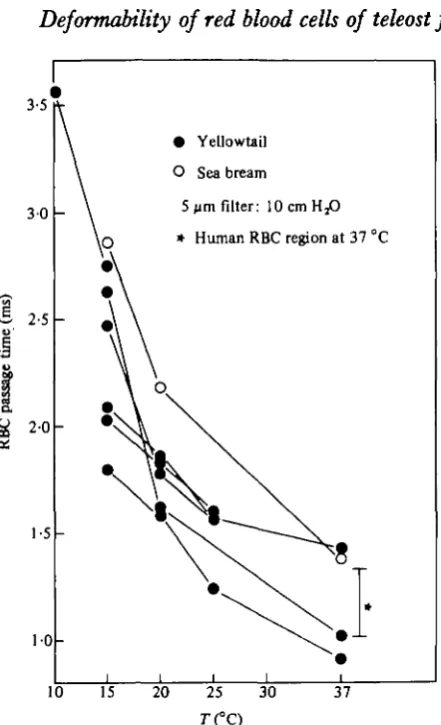
Effect of temperature on the RBC passage time
• Yellowtail O Sea bream
5 ^m filter: 10cmH,O * Human RBC region at 37 °C
[image:7.451.102.323.47.410.2]10 15 20 25 30 37
Fig. 3. Effect of temperature on the mean passage time for red blood cells of yellowtail. Lines are drawn through data of the same blood sample, and the effect on one sample of sea bream (open circles) is also shown. Blood was obtained direct from the heart in all cases. The S.D. of values for normal human blood at 37 °C (Kikuchi et al. 1980) is also given.
D I S C U S S I O N
216 G. M. HUGHES, Y. KIKUCHI AND H. WATARI
3-0
2-5
2 0
10
Yellowtail
5 jim filter: 10 cm HjO
K
T - S.D.
Mean
10 15 20 25 30 37
Fig. 4. Plot of mean values (±S.D.) for red blood cell passage time at different temperatures using blood obtained directly from the heart.
methods. Furthermore, despite blood obtained from the heart being taken within a few minutes of the fish swimming and respiring normally it cannot have had a POt greater
than 10 mmHg (Hughes et al. 1981).
Table 2. Comparison of RBC passage time (ms ± s.D.) for yellowtail and human blood at
iS and 37 °C
IS
37 °C
°C
•
Yellowtail
2-20 ±0-34 (fl = 5) II2±0'27
(n = 3)
Based on Kikuchi
Human
3'05±i-4i (» = 3) I - I 8 ± O I 6 (•» = 6)
et al. (1980).
were even greater than those expected from the slight increase in haematocrit value (shown by arrows in Fig. 2). If this interpretation is valid, then it suggests that new red blood cells are less deformable than those which have been in circulation for some time. Such a conclusion was unexpected and at this stage must be treated with caution, especially as experiments using mammalian red cells indicate a decrease in filterability with age (Levander, Morris & Ferretti, 1978). A similar interpretation might also be involved in the observation that blood from chronic cannulae after several samplings tended to show an increase in passage time. Although the haemato-crit value generally fell in such experiments, this may well have been associated with an increase in new red blood cells in the circulating blood. Release of red blood cells from the spleen of yellowtail has been shown following severe exercise (Yamamoto et al. 1980) and there are also indications that this may occur during hypoxia (Hughes et al. 1981).
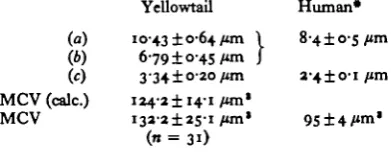
The values obtained in the present experiments with yellowtail provide an interest-ing comparison with the well-documented data from human blood and at first sight it would appear that yellowtail red cells are far less deformable than those of humans. At least this is true when comparison is made between the two types of blood at their normal environmental temperature. If, however, human blood is cooled to 15 °C, the red cell passage time exceeded that of yellowtail blood (Table 2), whereas yellow-tail blood measured at 37 °C is in a similar range to that obtained with normal human blood. Measurements of the dimensions of yellowtail red cells were carried out in nearly all samples, and it was consistently found that the dimensions of the yellowtail red cells, though ellipsoidal, were not vastly different from those of humans (Table 3). Although the minor axis is about the same size as the diameter of human RBC's, nevertheless the longer major axis means that the average red cell volume of yellowtail is about 1-5 x that of human red cells. The length occupied by a red cell column within a pore (a as defined above) are 7 and 5 /tm for yellowtail and human red cells respectively. Consequently, fish red cells would remain in contact with the walls of 5 jim pores for longer time than would the human cells and therefore would be expected to have a longer passage time than human cells at the same temperature, assuming that other factors are equal.
218 G. M. HUGHES, Y. KIKUCHI AND H. WATARI
Table 3. Summary of the dimensions (c = thickness) of red blood cells of yellowtail together with calculated values (%n .£a .\b .\c)for mean cell volume based on these measure-ments, and determinations of mean cell volume based on haematocrit value and red cell count. {Values ( + S.D.) for human blood are also given.)
(«) (.b) (c)
MCV (calc.) MCV
YeUowtail 10-43 ±0-64/«n I
6-79 ± 0-45 fan J
334±o-2o fan i24-2±i4-i fan* i32-2±2S-i fan*
Human*
8-4±o-5/*m
2-4 ±o-i fan
95 ± 4 /mi1
• After Altman & Dittmar (1971).
passage time plotted here are more related to some effect on the elastic properties of the red cells themselves. The fact that there did not seem to be any marked transition temperature suggests that there is no sudden change in the physical state of any lipoid-like component of the red cell in a way which has been observed in other properties of living membranes under changing temperature conditions (cf. Beament, 1958). However, more detailed investigation of human blood indicates the presence of some transitional phenomena.
Factors which govern blood passage time
Measurements made during this study are of the time for passage of whole blood through filters of known dimensions. Perhaps this is best described as the 'filtrability' of blood and will be affected by many factors which may be subdivided into (1) those based upon the nature of the pores, (2) the nature of the plasma, and (3) those related to the characteristics of the red blood cells themselves.
(1) Though some studies were made using Nuclepore filters of different pore sizes, most of those reported here relate to the same type of Nuclepore filter with pore dimensions of 5 /im and a pore-length averaging 10 fim. Particular surface properties and average orientation of these pores are constant for a given sample. Clearly such properties are involved in determinations of the kind reported here.
(2) Plasma properties are also involved, particularly its viscosity, as a greater viscosity would certainly affect total flow-rate of the blood through the filters; relative to the blood cells themselves one would expect this to be of less importance.Viscous properties of the plasma coupled with the nature of the pore surfaces would be important in lubrication aspects of the flow of red cells through these pores.
would bring flow to a halt. Different degrees of aggregation and rouleaux formation may occur in different vertebrates but presumably this will be reduced in heparinized blood samples and hopefully this factor is not involved in these measurements; (d) the surface properties of individual red cells including the nature of any charge on their surface, or of any superficial coating of protein, would also have effects on the relationship between corpuscles and pores; (e) the physical properties of the red cell contents are also important, but the internal viscosity would have to be very high for it to affect the overall deformability of the cells. The nucleus of fish RBC's probably has more dense protoplasm but its size relative to that of the pore is small (fish RBC nuclei occupy about 20% of the total volume of red blood cells (Hughes, 1979). This list is certainly not complete and the precise way in which each factor influences the flow rate through micropores and therefore parts of the microcirculation is at present unknown, but at least we can begin to gain some insight into the possible range and nature of some of the factors involved.
We wish to thank Dr R. C. Schroter of the Physiological Flow Studies Unit, Imperial College, for his very helpful comments on the manuscript. One of us (G.M.H.) wishes to thank the President of the National Institute of Physiological Sciences for his kind invitation to be an Invited Professor at the Institute during which this work was carried out.
REFERENCES
ALTMAN, P. L. & DITTMEB, D. S. (eds) (1971). Biological Handbooks: Respiration and Circulation. Bethesda: Fedn Proc. Fedn Am. Socs exp. Biol. 930 pp.
BEAMENT, J. W. L. (19S8) The effect of temperature on the waterproofing mechanism of an insect. J. exp. Biol. 35,
494-519-DINTENFASS, L. (1977). Theoretical aspects and clinical applications of the blood viscosity equation containing a term for the internal viscosity of the red cell. Blood Cell 3, 367-374.
EDDY, F. B. (1975). Oxygen uptake by rainbow trout Wood, Salmo gairdneri.J. Fish. Biol. 10, 87-90. FUNG, Y. C. & SOBIN, S. S. (1977). Pulmonary alveolar blood flow. In Bioengineering Aspects of Lung
Biology (Ed. J. B. West), ch. 4, pp. 267-358. Marcel Dekker.
GREENE, R., HUGHES, J. M. B., ILIFF, L. D. & PINEO, G. F. (1973). Red cell flexibility and pressure-flow relations in isolated lungs. J. appl. Physiol. 34, 169-175.
HILLS, B. A. & HUOHES, G. M. (1970). A dimensional analysis of oxygen transfer in the fish gill. Resp. Physiol. 9, 126-140.
HUGHES, G. M. (1966). The dimensions of fish gills in relation to their function. J. exp. Biol. 45,177-195. HUGHES, G. M. (1972). Morphometrics of fish gills. Respir. Physiol. 14, 1-25.
HUGHES, G. M. (1979). The paths of blood flow through the gills of fishes - some morphometric observations. Bulg. Acad. Set. Sofia. Ada Morphologica a, 52-58.
HUGHES, G. M. & WOOD, S. C. (1974). Respiratory properties of the blood of the thornback ray. Experientia 30, 167-168.
HUGHES, G. M., YAMAMOTO, Y., ITAZAWA, Y. & KOBAYASHI, S. (1981). Respiratory responses to confinement in a marine carangid fish (in preparation).
KIKUCHI, Y., HORIMOTO, M., KAKIUCHI, Y. & KOYAMA, T. (1979). Effects of proteins on red cell deformability. Biorheology 16, 496.
KIKUCHI, Y., HORIMOTO, M. & KOYAMA, T. (1979) Reduced deformability of erythrocytes exposed to hypercapnia. Experientia 35, 343-344.
KIKUCHI, Y., HORIMOTOA, M., KOYAMA, T., KOYAMA, Y. & TOZAWA, S. (1980). Estimation of pore passage time of red blood cells in normal subjects and patients of renal failure. Experientia 36, 325-3»6.
LEVANDER, O. A., MORRIS, V. C. & FERRETTI, R. J. (1978). Effect of cell age on the filterability of erythrocytes from vitamin E-deficient lead-poisoned rats. J. Nutr. 108, 145-151.
220 G. M. HUGHES, Y. KIKUCHI AND H. WATARI
REID, H. L., BARNES, A. J., LOCK, P. J., DORMANDY, J. A. & DORMANDY, T . L. (1976). A simple method
for measuring erythrocyte deformability. J. Clin. Path. 39, 855-858.
SCHEID, P. & PIIPER, J. (1976). Quantitative functional analysis of branchial gas transfer: Theory and application to Scyliorhinus stellaris (Elasmobranchii). In Respiration of Amphibious Vertebrates (ed. G. M. Hughes), pp. 17-38. Academic Press.
SCHMIDT-SCHOENBEIM, H., WELLS, R. & GOLDSTONE, J. (1969). Influence of deformability of human red cell on blood viscosity. Circulation Res. 25, 131—143.
SOIVIO, A., NYHOLM, K. & WESTMAN, K. (1975). A technique for repeated sampling of the blood of individual resting fish. J. exp. Biol. 6a, 207-217.
SOIVIO, A., WESTMAN, K. & NYHOLM, K. (1974). The influence of changes in oxygen tension on the haematocrit value blood samples from asphyxic rainbow trout (Salmo gairdneri). Aquaculture 3, 395-4°i •
WEIBEL, E. R. (1971). Morphometric estimation of pulmonary diffusion capacity. I. Model and method.
Rap. Physiol. n , 54-75.