Scott A. Mirowitz 1 Klaus Sartor Mokhtar Gada
Received January 1 0, 1989; revision requested March 1, 1989; revision received March 28, 1989; accepted April 11, 1989.
' All authors: Mallinckrodt Institute of Radiology, Washington University School of Medicine, 510 S. Kingshighway Blvd., St. Louis, MO 6311 0. Address reprint requests to S. A. Mirowitz.
0195-6108/89/1006-1159
© American Society of Neuroradiology
High-Intensity Basal Ganglia
Lesions on T1-Weighted MR
Images in Neurofibromatosis
Basal ganglia lesions, characterized on MR by increased signal intensity on T1· weighted images, were observed in seven patients with documented neurofibromatosis. These lesions most often involved the globus pallidus and internal capsules in a bilateral and symmetric fashion, and extended across the anterior commissure resulting in a "dumbbell" configuration. Smaller and less prominent foci of increased signal also were present on corresponding T2-weighted images. These lesions did not exhibit mass effect, edema, or enhancement with gadolinium-DTPA. They were not visible on CT (performed in two patients) and demonstrated no progression during a 2-year interval in three patients. Their signal characteristics and morphology suggest that they repre-sent heterotopias containing Schwann cells andjor melanin deposits. Migrational ab-normalities of these neural crest derivatives are known to occur in neurofibromatosis, and the presence of such heterotopias has been documented pathologically in patients with this disorder.
While recent reports discuss foci of increased signal intensity on T2-weighted MR images in patients with neurofibromatosis, signal abnormalities on T1-weighted images have not yet been described. When lesions characterized by similar signal as well as morphologic characteristics are encountered on MR, the diagnosis of neurofibromatosis should be considered.
AJNR 10:1159-1163, November/December 1989; AJR 154: February 1990
Neurofibromatosis (NF) is the most common of the phakomatoses, occurring in 1/3000 births [1 ]. This disorder is transmitted as an autosomal dominant trait, although spontaneous mutations are responsible for half the cases [1]. While the expression of the genetic defect is highly variable among individual patients, intracranial abnormalities account for some of the most frequent and disabling features. CNS neoplasia occurs in the form of optic nerve and chiasm gliomas, other varieties of astrocytomas, meningiomas, and cranial nerve schwannomas [2-4] and is the most frequent cause of death in children with this disease [5]. Patients also are predisposed to CNS dysplasia, which may manifest with a wide spectrum of hamartomatous or heterotopic lesions within the brain and spinal cord [2, 4]. Other anatomic abnormalities that affect the CNS include meningocele, aqueductal stenosis, arachnoid cysts, hydrocephalus, macrocranium, cerebrovascular occlu-sions, cytoarchitectural anomalies, and syringomyelia [2, 4]. In addition to the neurologic deficits that often result from these anatomic lesions, patients with NF are subject to intellectual handicaps, including mental retardation, as well as headaches, speech impediments, seizures, and other disorders for which a clear origin has not been found [1, 2].
1160 MIROWITZ ET AL. AJNR:1 0, November/December 1989
abnormalities on CT or on T1-weighted images [6, 7, 11, 12]. The apparently benign features associated with these lesions and the absence of associated neurologic deficits have led most authors to suggest that the lesions represent hamartomas or heterotopias [6, 7, 11, 12].
Although these studies report routine use of T1- and T2-weighted sequences, none has described lesions that demonstrate significantly increased signal intensity on T1-weighted images. We have recently encountered seven chil-dren with NF in whom MR has demonstrated unusual lesions involving the basal ganglia characterized by bright signal intensity on T1-weighted images.
Subjects and Methods
A review of cranial MR examinations in 35 patients with docu-mented NF revealed seven patients who demonstrated foci of
in-creased signal intensity on T1-weighted images. These patients included five females and two males ranging in age from 3 to 17 years (mean, 12 years).
MR was performed on two separate superconducting units*
op-erating at 0.5 and 1.5 T. Images were acquired by using spin-echo multisection technique. TRs ranging from 300-750 and TEs ranging
from 15-35 resulted in relatively T1-weighted images. A double-echo
pulse sequence was used to obtain relatively spin-density- and T2-weighted images. TRs ranged from 1500-31 00, with first-echo TE of
35 and second-echo TE of 90-120. A slice thickness of 5-10 mm was used, and images were variably obtained in all orthogonal planes. Patients were not sedated for the examination.
Two of the patients underwent CT scanning,t which was performed
before and after administration of IV contrast material. Contiguous transaxial images were obtained by using a slice thickness of 8 mm.
Results
Areas of increased signal intensity relative to cerebral white matter were observed in the basal ganglia region on T1-weighted images in all seven patients (Figs. 1-3). This process was bilateral in all cases and usually symmetric. The globus pallidus and portions of the internal capsule were involved in all patients. Apparent extension of signal abnormality across the anterior commissure, resulting in a "dumbbell" configura-tion, was present in six of the seven patients. The posterolat-eral aspects of the thalami appeared to be involved in five patients, and in one patient there were foci of increased intensity within the corpus callosum. On T2-weighted images foci of increased signal intensity were demonstrated within at least a portion of the above-described areas in all patients. In five of the seven patients the extent and conspicuity of hyperintensity on T2-weighted images were considerably more limited than the hyperintensity seen on T1-weighted images. In other words, some of the tissue displaying in-creased intensity on T1-weighted scans was of normal signal intensity on T2-weighted images in these patients. In one patient the distribution of hyperintensity on T1- and T2-weighted images was equivalent, and in the remaining patient
• Magnetom, Siemens, Iselin, NJ. t DR-3, Siemens, Iselin, NJ.
T2-weighted images demonstrated more extensive involve-ment. On all pulse sequences, the areas involved by abnormal signal intensity were smoothly marginated, although some-what nodular in appearance and without associated mass effect or edema. IV Gd-DTPA was administered in two pa-tients, and no evidence of abnormal enhancement related to these basal ganglia signal abnormalities was noted. Multiple MR examinations were performed in three patients, covering an approximate time span of 2 years in all patients. Although these examinations varied significantly in terms of pulse se-quences, imaging planes, and slice thicknesses used, as well as field strength, there was no definite evidence of change in the signal abnormalities. CT scans were performed before and after administration of IV contrast material in two patients, and revealed no abnormalities that correlated with these signal alterations. Numerous abnormalities were observed on MR in these patients in addition to the signal changes de-scribed above; these are listed in Table 1.
Discussion
Recent studies concerning MR in patients with NF describe focal areas of increased signal intensity on T2-weighted im-ages as a frequent observation [6-12]. These lesions are characterized by an absence of mass effect or surrounding edema and apparently are not associated with focal neuro-logic deficits. The frequency of these lesions as cited in recent series has been 23/53 patients [12], fourffour patients [11 ], and nearly half of 15 patients [6]. The most frequent location reported is the basal ganglia [6, 7, 11, 12]. In those reports that further specify location, the globus pallidus is the most frequent site, often with bilateral involvement [11]. Extension of basal ganglia lesions into the internal capsules, as de-scribed in our cases, has also been reported [12].
While histopathologic correlation has been lacking, the apparently benign features of these lesions has led the au-thors of these studies to conclude that the lesions most likely represent hamartomas or heterotopias [6, 7, 11, 12]. This is stated, of course, with the proviso that the limited ability of MR to predict histopathology does not allow for the exclusion of a low-grade tumor without serial studies. The nature of the constituents of these hamartomatous lesions has not been addressed in previous reports. This is presumably because prolongation of T2 relaxation occurs with a wide variety of pathologic lesions and therefore confers almost no specificity regarding tissue composition. The observation of lesions man-ifesting increased signal intensity on T1-weighted images, however, is unusual, and such signal behavior has been associated with relatively few tissues. These tissues include lipids and paramagnetic species of iron as contained within hemoglobin degradation products such as methemoglobin [13] or melanin (melanoma) [14]. Further consideration of the source of the unusual signal behavior of the lesions we encountered requires a review of some of the basic patho-physiologic aspects of NF.
B
c
Fig. 1.-A, T1-weighted image (750/21) at 1.5 T shows increased signal intensity involving globus pallidus and internal capsule bilaterally (straight
arrows) that was without interval change since a previous examination 2 years earlier. A pericallosal lipoma is also seen (curved arrow). CT revealed no evidence of basal ganglia abnormalities in this patient.
B, T1-weighted image at another level better demonstrates posterior extent of increased signal intensity, as well as involvement of anterior commissure (arrow).
[image:3.612.40.559.69.288.2]C, Coronal T2-weighted image (3100/90) shows mildly increased signal intensity involving basal ganglia region on the right only (arrow).
Fig. 2.-A, T1-weighted image (750/21) at 1.5 T demonstrates confluent nodular areas of hyperintensity involving globus pallidus and in· ternal capsule bilaterally (wide arrows) with ex-tension across the anterior commissure (thin
arrow), resulting in a "dumbbell" configuration.
B, T2-weighted image (3200/90) at a compa-rable level. There are small nodular foci of increased intensity within globus pallidus and internal capsule bilaterally. The extent and mor-phology of signal abnormality shown here differ considerably from those seen on corresponding T1-weighted image.
A
origin along the dorsal surface of the embryonic neural tube, the multipotential cells of the neural crest migrate throughout the embryo [17]. The timing and path of their migration as well as their subsequent differentiation into various special-ized cell types is regulated by intrinsic as well as extrinsic or environmental factors [18, 19]. Among the major neural crest derivatives formed as a result of this process are cephalic
mesenchyme, leptomeninges, sensory ganglia of cranial
nerves, sympathetic and parasympathetic ganglia and plex-uses, spinal ganglia, Schwann cells, and pigment cells [18, 20]. Failure in the controls that regulate the formation, migra-tion, and differentiation of neural crest cells results in the
B
formation of dysplastic and neoplastic aggregations of the neural crest derivatives listed above [15]. We describe two of these derivatives in terms of the possible nature of the MR
signal abnormalities encountered.
Schwann cells are involved in many common manifestations of NF. Neoplastic proliferation of these cells results in schwan-nomas or neuromas of the cranial nerves (particularly cranial nerves eight and five), which are closely associated with NF. Similar tumors may involve the spinal nerves and ganglia.
Schwann cells, along with fibroblasts and other tissues, are
also major components of the neurofibromas and occasional
[image:3.612.54.558.349.584.2]1162 MIROWITZ ET AL. AJNR:1 0, November/December 1989
A
8
TABLE 1: Additional Abnormalities Demonstrated on MR Images
C~~~
Age Gender 12 3 4 5 6 7
12 10 14 17 17 3 9
F F F F F M M
Additional MR Abnormalities
OC and ON glioma; pericallosal lipoma Sphenoid dysplasia; buphthalmos OC and ON glioma extending along OT OC and ON glioma; infarct
Third ventricular mass; cutaneous NFs Macrocephaly; ON glioma; plexiform NF Cerebellar mass
Note.-OC = optic chiasm, ON = optic nerve, OT = optic tract, NF = neurofibroma.
Although neoplasms of Schwann cells are more frequent and widely recognized, hamartomatous collections of Schwann cells also occur in association with NF [4]. Aggregations of ectopic Schwann cells, or schwannosis, within the CNS have been encountered most often in the spinal cord [21, 22]. Hamartomas containing Schwann cells have also been doc-umented in the cerebral cortex and basal ganglia [23]. Addi-tional components of such lesions include meningeal cells, neuroglia, and blood vessels, as well as other neural crest tissues [23].
[image:4.612.46.567.78.398.2]The signal behavior of the lesions we describe could be explained, at least in part, by the presence of ectopic Schwann cells within the basal ganglia. Myelinated regions in the brain routinely result in relatively increased signal intensity on T1-weighted images as compared with cortex and deep gray matter, CSF, and most other components of the image [24]. That the lesions in our patients were hyperintense relative to surrounding white matter can potentially be ex-plained by a denser clustering of myelinated fibers within the lesions. The observation of smaller foci of increased signal on T2-weighted images could presumably be due to tissues other than Schwann cells (e.g., neuroglia) within the hamartomas, or could result from reactive gliosis leading to increased water content.
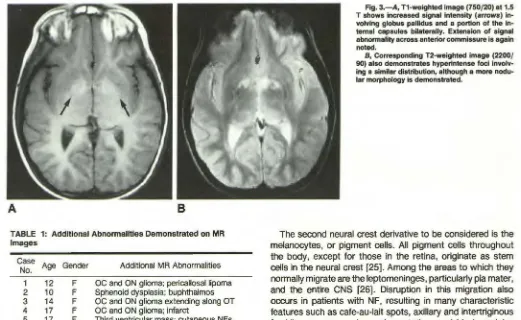
Fig. 3.-A, T1-weighted image (750/20) at 1.5 T shows increased signal intensity (arrows) volving globus pallidus and a portion of the in-ternal capsules bilaterally. Extension of signal abnormality across anterior commissure is again noted.
B, Corresponding T2-weighted image (2200/
90) also demonstrates hyperintense foci
involv-ing a similar distribution, although a more nodu-lar morphology is demonstrated.
The second neural crest derivative to be considered is the melanocytes, or pigment cells. All pigment cells throughout the body, except for those in the retina, originate as stem cells in the neural crest [25]. Among the areas to which they normally migrate are the leptomeninges, particularly pia mater, and the entire CNS [26]. Disruption in this migration also occurs in patients with NF, resulting in many characteristic features such as cafe-au-lait spots, axillary and intertriginous freckling, cutaneous hyperpigmentation, and Lisch nodules (melanocytic hamartomas of the iris) [1, 5, 27]. Hamartoma-tous collections of melanocytes have also heen described within the brain in patients with NF [23, 28]. In such cases, pigment cells that appear to arise from the pia mater migrate along perivascular sheaths [21, 28] resulting in intracerebral masses of melanin in various locations, including the basal ganglia [28].
Several studies have described increased signal intensity on T1-weighted MR of intracranial metastases from malignant melanotic melanoma [29, 30], presumably related to the paramagnetic properties of free radicals in melanin [14, 29]. We are not aware of any reports in which melanin deposits have been identified by MR in the brain in conditions other than melanoma metastases. The documented association between intracranial melanin deposits and NF leads one to consider melanin as a possible contributor to the signal char-acteristics of these lesions on T1-weighted MR. Since mela-noma metastases characterized by shortened T1 also usually show evidence of shortened T2 relaxation [14, 29, 30], the presence of small foci of increased signal on T2-weighted images would have to be accounted for by associated gliosis or additional tissue elements within the hamartomatous le-sion.
cells and melanocytes may occasionally be found together in
NF. This association occurs, for example, in the form of
melanocytic schwannomas [15, 21, 31 ], and some authors
state that Schwann cells may actually be capable of producing
melanin [21]. The lack of autopsy material in our patients
clearly precludes any definitive statements regarding the
na-ture of the lesion observed. These neuropathologic studies,
however, support speculation that the basis for the increased
signal on T1-weighted MR may relate to inclusion of Schwann
cells or melanocytes or both within heterotopic or
hamarto-matous lesions of the basal ganglia.
The significance of cerebral heterotopias in NF patients is
unknown. It has been suggested that such lesions may con-tribute to the high frequency of mental retardation, learning
disabilities, and other related deficits, as well as possibly
serving as a focus for seizures [11 ]. Others believe that such
lesions are preneoplastic and the probable origin of the many
types of tumors that afflict patients with this condition [22]. MR promises to contribute significantly to the understanding
of this disease by providing a means of noninvasively
moni-toring the progression of such lesions over time. Follow-up
imaging in our limited series revealed no evidence of lesion progression. However, longitudinal studies of larger numbers
of NF patients will have to be performed to further assess
lesion stability.
In summary, basal ganglia lesions characterized on MR by
increased signal intensity on T1-weighted images, with
smaller foci of hyperintensity of T2-weighted images, were
observed in seven patients with NF. The signal characteristics
of these lesions as well as neuropathologic information
avail-able suggest that such lesions represent heterotopias or
hamartomas that contain Schwann cells or melanocytes or
both. When lesions characterized by signal and morphologic
characteristics similar to those described are encountered on
MR, the diagnosis of NF should be considered.
ACKNOWLEDGMENT
We express our appreciation to Kevin Roth of the division of neuropathology for reviewing this manuscript.
REFERENCES
1. Riccardi VM. von Recklinghausen neurofibromatosis. New Eng/ J Med
1981;305: 1617-1627
2. Rubenstein AE, Mytilineoau C, Yahr MD, Revoltella RP. Neurological aspects of neurofibromatosis. Adv Neuro/1981;29: 11-21
3. Pierce J. The central nervous system pathology in multiple neurofibroma· tosis. Neurology 1967;17:691-697
4. Lott IT, Richardson EP Jr. Neuropathological findings and the biology of neurofibromatosis. Adv Neuro/1981;29:23-32
5. Riccardi VM, Eichner JE. Neurofibromatosis: phenotype, natural history
and pathogenesis. Baltimore: Johns Hopkins University Press, 1986: 37-65
6. Cohen ME, Duffner PK, Kuhn JP, Seidel FG. Neuroimaging in neurofibro-matosis. Ann Neuro/1986;20:444 (abstr)
7. Brown EW, Riccardi VM, Mawad M, Handel S, Goldman A, Bryan RN. MR imaging of optic pathways in patients with neurofibromatosis. AJNR
1987;8: 1031-1036
8. Gray J, Swaiman KF. Brain tumors in children with neurofibromatosis: computed tomography and magnetic resonance imaging. Pediatr Neurol
1987;3:335-341
9. Pomeranz SJ, Shelton JJ, Tobias J, Soila K, Altman D, Viamonte M. MR of visual pathways in patients with neurofibromatosis. AJNR 1987;8: 831-836
10. Mayer JS, Kulkarni MV, Yeakley JW. Craniocervical manifestations of neurofibromatosis: MR versus CT studies. J Comput Assist Tomogr 1987;
11:839-844
11. Hurst RW, Newman SA, Cail WS. Multifocal intracranial MR abnormalities in neurofibromatosis.AJNR 1988;9:293-296
12. Bognanno JR. Edwards MK, Lee TA, Dunn OW, Roos KL, Klatte EC. Cranial MR imaging in neurofibromatosis.AJNR 1988;9:461-468 13. Gomori JM, Grossman Rl, Goldberg HI, Zimmerman RA, Bilaniuk LT.
Intracranial hematomas: imaging by high-field MR. Radiology 1985; 157:87-93
14. Gomori JM, Grossman Rl, Shields JA, Augsburger JJ, Joseph PM, De-Simeone D. Choroidal melanomas: correlation of NMR spectroscopy and MR imaging. Radiology 1986;158:443-445
15. Kissel P, Andre JM, Jacquier A. The neurocristopathies. New York: Mas-son, 1981:223-232
16. Bolande RP. Neurofibromatosis-the quintessential neurocristopathy:
pathogenetic concepts and relationships. Adv Neuro/1981;29:67-75 17. Newgreen OF, Erickson CA. The migration of neural crest cells. tnt Rev
Cyto/1986;103:89-141
18. Kissel P, Andre JM, Jacquier A. The neurocristopathies. New York: Mas-son, 1981:1-15
19. LeDourain N. The neural crest. Cambridge: Cambridge University Press, 1982:22-53
20. LeDourain N. The neural crest. Cambridge: Cambridge University Press, 1982:212-215
21. Russell DS, Rubinstein LJ. Pathology of tumours of the nervous system,
4th ed. Baltimore: Williams & Wilkins, 1977:48-57
22. Rubinstein LJ. The malformative central nervous system lesions in the central and peripheral forms of neurofibromatosis: a neuropathological study of 22 cases. Ann NY Acad Sci 1986;486: 14-29
23. Rubinstein LJ. Tumors of the central nervous system. In: Firminger HI, ed.
Atlas of tumor pathology. Washington: Armed Forces Institute of Pathology,
1972:302-311
24. Brandl-Zawadzki M. MR imaging of the brain. Radiology 1988;166:1-10
25. LeDourain N. The neural crest. Cambridge: Cambridge University Press, 1982:108-133
26. Kissel P, Andre JM, Jacquier A. The neurocristopathles. New York: Mas-son, 1981:19-25
27. Fitzpatrick TB. Melanin synthesis pathways in the pathogenesis of neuro-fibromatosis. Adv Neuro/1981;29:209-211
28. Gibson JB, Burrows D, Weir WP. Primary melanoma of the meninges. J
Pathol Bacter/o/1957;74:419-435
29. Atlas SW, Grossman Rl, Gomori JM, et al. MR imaging of intracranial metastatic melanoma. J Comput Assist Tomogr 1987;11 :577-582 30. Woodruff WW Jr, Djang WT, Mclendon RE, Heinz ER, Voorhees DR.
Intracerebral malignant melanoma: high-field-strength MR imaging. Red/of· ogy 1987;165:209-213
31. Borello ED, Gor1in RJ. Melanotic neuroectodermal tumor of infancy- a