David Zag zag ,
_
3Marvin Goldenber~
4Steven Brem
·
2This article appears in the May/June 1989 issue of AJNR and the July 1989 issue of AJR.
Received February 17, 1988; accepted after r e-vision October 25, 1988.
This work was supported in part by grant MA-8672 from the Medical Research Council of Canada.
D. Zag zag is supported by a Postdoctoral F el-lowship grant from the Cancer Research Society,
Inc.
' Department of Neurosciences, Sir Moriimer B. Davis-Jewish General Hospital, 3755 Cote Ste.
Catherine, Suite C-130, Montreal, Quebec H3T 1E2, Canada. Address reprint requests to S. Brem.
2
Department of Neurology and Neurosurgery,
McGill University School of Medicine, Montreal,
Quebec H3T 1 E2, Canada. 3
Present address: Department of Pathology, New York University Medical Center, 550 First Ave., New York, NY 10016.
'Department of Radiology, Sir Mortimer B.
Davis-Jewish General Hospital and McGill Univer -sity School of Medicine, Montreal, Quebec H3T 1 E2, Canada.
AJNR 10:529-534, May/June 1989
0195-6108/89/1003-0529
© American Society of Neuroradiology
Angiogenesis and Blood-Brain
Barrier Breakdown Modulate CT
Contrast Enhancement:
An Experimental Study in a
Rabbit Brain-Tumor Model
529
Because of the crucial role played by tumor neovascularization in contrast enhance-ment, we studied the CT imaging findings in a transplantable rabbit brain tumor, the VX2 carcinoma that induces angiogenesis and the breakdown of blood-brain barrier associ-ated with contrast enhancement. Tumor detection by contrast enhancement followed the peak of angiogenesis. Inhibition of angiogenesis, by copper depletion and penicil-lamine, led to avascular tumors that lack contrast enhancement. Furthermore, there was no contrast enhancement in brain adjacent to the tumor of normocupremic rabbits or within the hypocupremic tumor, despite the breakdown of the blood-brain barrier, without the concomitant presence of angiogenesis.
We conclude that contrast enhancement of intracranial tumors is dependent primarily on the proliferation of the microvasculature.
Contrast
enhancement
is one of the main
radiologic
manifestations of CNS
tumors
;
it is
not observed
,
however
,
in all tumors [1
)
.
The mechanisms that
cause
the contrast enhancement of brain tumors are not entirely known but remain
important to the interpretation of CT scans. These mechanisms relate to breakdown
of the blood-brain barrier
(BBB)
[2-5]
and to tumor neovascular
i
zation
,
that
is
,
angiogenesis
[6-12)
.
The growth of tumors outside the CNS
[13)
and in
the
brain
[14
,
15]
proceeds through
two stages:
the early avascular and the later vascular
phases
.
Prevention of
ang
iogenesis
arrests tumor
growth at the
ava
s
cular
stage
[16). Tumor neovascularization is prevented
in
the cornea
[17
, 18)
and
in the
brain
[19] by the depletion of
copper,
a necessary cofactor for angiogenesis
[17
,
20)
.
The present study was designed to investigate the mechanisms that modulate
contrast enhancement. We selected the rabbit VX2 carcinoma
,
useful for radiologi
c
research [21-23)
,
studies
of BBB
,
and angiogenes
is [24)
.
We compared the
serial
CT images,
extravasation
of Evans blue
,
and
histology
of
normocupremic
and
hypocupremic tumors
.
Materials and Methods
We implanted 5
x
1 05 cells of the VX2 carcinoma into the right parietal lobe of 36 3-kgmale New Zealand white rabbits, according to a model of intracerebral angiogenesis and
tumor growth [24].
We divided the rabbits into six groups of six animals each: four for CT imaging and two
for study of the BBB. Tumor size and histology were determined in each of the six animals. Groups 1-5 were fed a normal diet• throughout the experiment. Group 6 animals were fed a
low-copper diet,t beginning 6 weeks before tumor implantation, and given 20 mg of o -penicillaminet per os, thrice daily, 6 days before and after tumor-cell implantation [17].
CT studies were performed on an Elscint Exel 2002, with the following settings: circle
diameter, 140 mm; X-ray current, 40 mA; voltage, 140 kV; scan time, 10.5 sec; slice width,
3 mm; and image matrix, 340
x
340. The brains of the rabbits were imaged in the coronal and axial planes before and 5 min after completion of IV administration of 3 mljkg ofiothalamate meglumine§ given as a bolus.
---
---• #5301, Ralston Purina Canada Inc., Longueuil, Quebec.
1 #5890C-1, Ralston Purina, Richmond, IN. 1 #4875, Sigma Chemical Co., St. Louis, MO.
530
ZAGZAG ET AL
.
AJNR:1 0, May/June 1989Group 1 was scanned 6 days after implantation, and immediately sacrificed. Groups 2-5 were likewise studied and sacrificed on days 10, 14, 18, and 22, respectively. In group 6, aCT scan was obtained
only when the animals developed neurologic deterioration (gait dis-turbances, decreased level of consciousness). The brains were re-moved and fixed in 1 0% phosphate-buffered formalin for 6 days. The specimens were sectioned coronally at 1 .5-mm intervals and corre-lated to the CT coronal scans.
One hour before sacrifice, two rabbits in each group received 2% Evans blue (2 ml/kg) injected IV via the marginal vein of the ear. The brains were then removed and evaluated for Evans blue extravasation by using a semiquantitative scale [25].
After fixation and coronal sections, tumor volume was determined
by measuring coronal (d1 ), axial (d2), and transverse (d3) diameters
using the formula (d1 x d2 x d3 x -rr)/6 [26]. The specimens were then examined histologically. Tumor neovascularization was scored by using a histologic method that computes microvascular density, endothelial hyperplasia, and endothelial cytology [27]. Vascular den-sity was defined in our study as the number of microvessels per field (x200).
Blood samples were taken in all the animals at the beginning of
the experiment, at time of surgery, and at time of sacrifice for serum
copper determinations [28].
Statistical analysis of tumor volume was performed by analysis of variance and Tukey test (29]. A
p
<
.05 was the chosen level forsignificance.
Results
Se
ru
m
copper
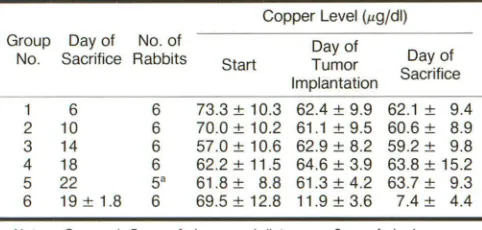
levels are shown
in
Table
1.
Groups 1-5
were
normocupremic
throughout the
experiment
,
whereas
group
6
was
hypocupremic at the time of tumor
-
cell
implan-tation and sacrifice.
The
mean
survival
time
in group 6 was
19
±
1.8
days
.
CT Findings
In
the
normocupremic
animals
,
there
was no tumor
detec-tion
at any time
without contrast
i
nfus
i
on
.
Even with contrast
infusion
,
there was
still
no visualization of the tumor on days
6 and 10
.
Starting at
day 14
,
the
tumor first showed dense
,
round
,
homogeneous
,
well
-
defined enhancement (Fig. 1 A)
.
As
the tumor enlarged,
it became more
oval
on day 18
(Fig
.
2A)
.
TABLE 1: Serum Copper Levels in Rabbits Implanted
with Tumor
Copper Level (J.Lg/dl) Group Day of No. of Day of
No. Sacrifice Rabbits Start Tumor Day of Implantation Sacrifice
1 6 6 73.3
±
10.3 62.4±
9.9 62.1±
9.42 10 6 70.0
±
10.2 61.1±
9.5 60.6±
8.93 14 6 57.0
±
10.6 62.9±
8.2 59.2±
9.84 18 6 62.2
±
11.5 64.6±
3.9 63.8±
15.2 5 22 5" 61.8±
8.8 61.3±
4.2 63.7±
9.3 6 19±
1.8 6 69.5±
12.8 11.9±
3.6 7.4±
4.4Note.-Groups 1-5 were fed a normal diet; group 6 was fed a low-copper diet.
• Sixth animal excluded because of death before scheduled CT.
Finally
,
on day
22,
patchy areas of decreased attenuation
appeared within the
center of
the tumor (Fig.
3A)
.
The lesion
itself rema
i
ned very well defined at all times. CT was not
performed in one animal
in
group 5 because it died before
day
22.
The tumor was visualized with CT in all the other
normocupremic rabbits studied on days 14
,
18
,
and 22.
CT
i
n the
hypocupremic
animals appeared normal even
after injection of contrast material (Fig. 4A)
.
In both norma
-and hypocuprem
i
c groups we failed to observe peritumoral
edema.
Histologic Findings
In normocupremic tumors
,
a slight capillary proliferation
first appeared on day 6
.
The vascular density
i
ncreased
progress
i
vely until day 14
,
when
neovascularization
was
prominent (Fig. 1 B)
.
On day 18
,
tumor vascularity was slightly
decreased
(Fig
.
2B)
.
By day 22
,
vascularized tumors
accom-panied by central necrosis were present
in
all normocupremic
rabbits (Fig
.
3B). The cortical surface revealed many enlarged
tortuous
peritumoral vessels resembling
those
of human
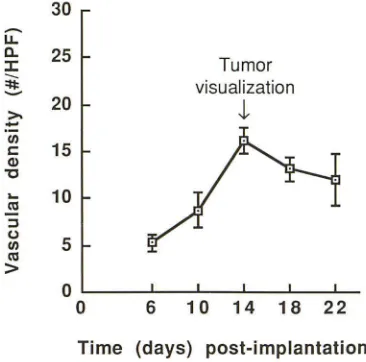
ma-lignant tumors [30]. The progression of volume and vascular
density in the normocupremic tumor is summarized
i
n Table
2 and Figure 5
.
The tumors in the hypocupremic groups were tiny
,
pale
,
laminar
plaques with 91
%
less
volume compared
with the
normocupremic tumors on day 22 (Table 2). The cortical
surface
of hypocupremic rabbits showed a normal
vascular
pattern
.
Microscopically, the tumor cells retained malignant
features
and appeared viable
,
but the capillary density was
close to that
of a normal brain, ind
i
cating
that
angiogenesis
failed to occur (Fig
.
4B).
Evans Blue Studies
In normocupremic animals (groups 1-5) Evans blue
extrav-asation appeared in
the tumor
area by day 6 and around the
tumor
by day 14
.
Extravasation
was
not seen on
the
cortical
surface on day 14 (Fig
.
1 C)
.
By day 18 extravasation was
prominent
in the
tumor and
brain adjacent
to tumor
and
was
detected on
the
cortical surface (Fig
.
2C)
.
Finally, by day 22
,
we
observed severe
extravasation
in
the
tumor and at
the
level of
the
cortical surface
(Fig.
3C)
.
The hypocupremic
animals in group 6
revealed
marked extravasation in and
around the
t
umor
(Fig. 4C)
.
In
summary
(Tab
l
e 2),
in
normocupremic rabbits, contrast
enhancement allowing
tumor detection
was
possible only
when
angiogenesis was prominent by day 14
.
In
the
hypo-cupremic
rabbits,
even though the tumor volume at the time
of sacrifice was larger
(46.8
±
26
.
6 mm
3)
than
the
tumor
vo
l
ume on day 14 (13
.
2 ± 2.2 mm
3)
in normocupremic rabbits,
no tumor
was visualized
on CT
,
even after contrast injection
.
Evans blue
extravasation was
observed in normocupremic
tumors at
all stages and around
them
on day 14
;
in
hypocu-premic
tumors
Evans blue extravasation
was
noted
in
and
[image:2.612.57.298.580.695.2]AJNR:1 0, May/June 1989
ANGIOGENESIS AND CONTRAST ENHANCEMENT
A
B
Fig. 1.-Normocupremic tumor on day 14.
A, Axial CT scan shows enhancing tumor nodule of right high convexity. 8, Highly vascularized tumor. (H and E, x200)
C, Cortical surface fails to reveal Evans blue extravasation on day 14.
A
B
Fig. 2.-Normocupremic tumor on day 18.
A, Axial CT scan shows large homogeneously enhancing tumor on right. 8, Slight decrease of tumor vascular density. (H and E, x250)
C, Cortical surface reveals localized area of Evans blue extravasation.
c
c
[image:3.614.54.559.71.321.2] [image:3.614.56.558.425.675.2]532
ZAGZAG ET AL.
AJNR:10, May/June 1989A
8
c
Fig. 3.-Normocupremic tumor on day 22.
A, Axial CT scan reveals further enlargement of tumor, but now with some inhomogeneity and areas of decreased attenuation corresponding to tumor
necrosis.
8, Prominent vascular proliferation at tumor periphery around central necrosis (N). (Hand E, x 150)
C, Severe Evans blue extravasation seen on cortical surface on day 22.
8
c
Fig. 4.-Hypocupremic tumor.
A, Axial CT scan. No contrast enhancement is detected.
8, Light microscopy reveals lack of vascular proliferation in tumor; angiogenesis is suppressed. (H and E, x450)
C, Broad areas of Evans blue extravasation are observed on cortical surface around tumor.
In
normocupremic animals,
on day 18,
we
observed
necro-sis
and punctate hemorrhages with light microscopy
, but not
by CT
scanning.
Necrosis
was
observed on CT on day
22
when
it
was more prominent by
histopathology.
Discussion
Currently
,
two
interrelated
mechanisms are invoked
to
ex-plain
the contrast enhancement of tumors on
CT:
(1)
break-down of
the BBB
with passage
of
iodine
across the basement
membrane of the capillaries into the
tumor
(2-5]
and (2) tumor
neovascularization leading to increased intravascular levels of
iodine
[6-12],
that is,
"computed angiotomography" (8], w
i
th
a positive correlation between contrast enhancement and the
degree of vascularity [7]. Because of the newl
y
discovered
ability
to
pharmacologically suppress capillary growth induced
by brain
tumors (18
, 19], we could test the relative
contribu-tions
of BBB breakdown and angiogenesis.
The
exact mechanism by which copper
regulates
[image:4.612.55.563.79.354.2] [image:4.612.57.561.391.568.2]AJNR:10, May/June 1989
ANGIOGENESIS AND CONTRAST ENHANCEMENT
533
TABLE 2: Tumor Vascularity, Size, Breakdown of the Blood-Brain Barrier (BBB), and Contrast Enhancement in Rabbits Implanted with Tumor
Day of CT Breakdown of Contrast
Group and No. of Tumor Tumor Size BBBb Enhancement
Sacrifice Rabbits Vascularity• (mm
3)
Tumor BAT Tumor BAT
Normocupremic
1
6
6
5.2
±1.0
0
.
2
±0
.
04
+
0
No No2
10
6
8.7
±1
.
5
0.7
±0.2
+
0
No No3
14
6
16.5
±1.6
13.2
±2.2
++
+
Yes No4
18
6
13.7
±1.4
70
.
0
±17
.
5
++
++
Yes No5
22
5
c
12.4
±1.5
513.5
±128.0
+++
++
Yes NoHypocupremic
6
19.5
±1.8
6
4.2
±0.8
46.8"
±26.6
+++
++
No NoNote.-AII data expressed represent mean± SD. BAT= brain adjacent to tumor. • Number of microvessels per field. (x200)
"Breakdown of BBB detected by extravasation of Evans blue: 0 = none;
+
= slight;++
= moderate;+++
= severe.c Sixth animal excluded from the study because of death caused by tumor growth before scheduled day of CT.
d Statistically significant difference from normocupremic tumors on day 22 (p < .01 ).
30
-
u...
ll..
25
J:
~
20
z.
(/)
c:
15
Q)
"C
...
(II10
::I(.)
5
(/)(II
>
0
0
Tumor
visualization
,t
6
10 14 18 22
Time (days) post-implantation
Fig. 5.-Progression of vascular density in normocupremic animals. CT tumor visualization correlates with peak tumoral angiogenesis. HPF
=
high-power field.copper as a cofactor for angiogenesis: (1) copper ion
,
but not
other metal salts, stimulates endothelial cell locomotion in
vitro [32]; (2) a local
rise
of copper concentration precedes
neovascularization in the cornea [17]; (3) copper salts act in
a dose-dependent fashion as a chemoattractant to induce
corneal neovascularization in vivo [33]
;
and (4) ceruloplasmin
and hepar
i
n are angiogenic in the cornea only when bound to
copper [20]. Penicillamine, a chelator of copper
,
contributes
to copper depletion by acceleration of copper clearance [17].
Contrast enhancement appeared on day 14 in
normocu-premic tumors and failed to appear in larger hypocunormocu-premic
tumors (Table 2), excluding size alone as a determinant of
contrast enhancement. In the hypocupremic group
,
the Evans
blue extravasation revealed the breakdown of the BBB, both
within the tumor and in the peritumoral area. CT scans of
hypocupremic animals
,
however
,
failed to reveal
enhance-ment after iothalamate meglumine injection. In hypocupremic
tumors, angiogenic inhibition likely prevented contrast
en-TABLE 3: Angiogenesis and Breakdown of the Blood-Brain
Barrier as Causes of Contrast Enhancement in
Tumor-Implanted Rabbits
Breakdown
Group Angiogenesis of Brain Blood- Enhancement Contrast
Barrier"
Normocupremic
Tumor
+
+
+
Brain adjacent to tumor
+
Hypocupremic
Tumor
+
Brain adjacent to tumor
+
'Detected by Evans blue extravasation.
hancement. On the other hand
,
contrast
enhancement
ap-peared in normocupremic malignant tumors that
contain
nu-merous new blood vessels
.
The permeability of newly formed
capillary sprouts
com-pared with that of mature capillaries is
increased
[34]
.
Normal
capillaries
of the brain maintain the integrity of the BBB
[35],
but the blood vessels of experimental [36] and human [37]
brain tumors are structurally altered and have
an increased
capillary permeability.ln normocupremic rabbits, the presence
of both tumor angiogenesis and breakdown of the BBB is
linked to the appearance of
contrast
enhancement. In
hypo-cupremic rabbits, however, the
breakdown
of the BBB is not
sufficient by itself to result in contrast
enhancement.
Evans blue binds to albumin
and
has a molecular weight
of
68
,
500 daltons
[38],
whereas iothalamate meglumine has
a
molecular weight of 800 daltons
.
Comparison of molecular
weights does not explain the leakage of Evans
blue and
the
failure of
contrast
material to
cross
an open BBB
.
To
explain
the paradox between the appearance of Evans blue
extrav-asation and the absence of
contrast
enhancement, we
sug-gest that the
interval
after injection of iothalamate
,
5 min,
compared
with the longer interval after injection
of
Evans
blue, 1 hr
,
accounts for the appearance of Evans blue
extrav-asation
,
despite the greater molecular
weight of
Evans
blue
.
[image:5.612.55.557.100.218.2] [image:5.612.83.266.295.476.2] [image:5.612.313.557.328.430.2]534
ZAGZAG ET AL.
AJNR:10, May/June 1989the injection of iothalamate
,
the hypocuprem
i
c tumors might
have
shown contrast
enhancement. Our data support the
concept
that if a CT
scan
is obtained immediately after
injection, the contrast enhancement probably corre
l
ates with
vascularity [7].
There
was
a correlation between the histologic boundary
of the tumors and contrast enhancement in the
normocu-premic group. On day 22, at the periphery of the tumor, both
vascu
l
arity [24) and contrast enhancement were prom
i
nent.
The topographic distribution corresponds to the growth
pat-terns of malignant human gliomas, where contrast
enhance-ment and vascular prol
i
feration are both conspicuous at the
growing edge
[1 0-12, 39]. The zone
of Evans blue
extrava-sation,
however, did not correlate with histologic ev
i
dence of
angiogenesis
nor with the radiologic appearance of CT
con-trast enhancement.
We conclude from our data (Tables 2 and 3) that breakdown
of the
BBB
was
a necessary but not sufficient cond
i
tion for
contrast enhancement
and that angiogenesis
i
n our
brain-tumor
model was
a key
requirement for the appearance of
contrast enhancement.
Angiogenesis occurs at the microvascular level. For cl
i
nical
imaging,
contrast enhancement in CT scann
i
ng is a sensitive
guide to
vascular proliferation and differs from angiography,
which delineates the macrovessels or their branches.
ACKNOWLEDGMENTS
We thank Y. Tanaka for determinations of serum copper levels,
Sylvana Ordonselli and Lynn Miller for technical assistance, Suzanne
Wileman for photography, and A. S. Luck and M. Maritzer for typing
the manuscript.
REFERENCES
1. Ambrose J, Gooding MR, Richardson AE. Sodium iothalamate as an aid
to diagnosis of intracranial lesions by computerized transverse axial
scan-ning. Lancet 1975;2:669-674
2. Ambrose J. Computerized transverse axial scanning (tomography). Part 2.
Clinical application. Br J Radiol1973;46: 1023-1047
3. Gado MH, Phelps ME, Coleman RE. An extravascular component of
contrast enhancement in cranial computed tomography. Part 1: The tissue
blood ratio of contrast enhancement. Part II: Contrast enhancement and
the blood tissue barrier. Radiology 1975;117:589-593, 595-597
4. Kormano M, Dean PB. Extravascular contrast material: the major
compo-nent of contrast enhancement. Radiology 1976;121 :379-382
5. Britt RH, Lyons BE, Enzmann DR, Saxer EL, Signer SH, Signer DO.
Correlation of neuropathological findings, computerized tomographic and
high resolution ultrasound scans of canine avian sarcoma virus-induced
brain tumors. J Neurooncol 1987;4: 243-268
6. Ethier R, Sherwin A, TaylorS, et al. Computerized angiotomography. The
use of 100 cc of Hypaque M-60%, clinical and experimental results.
Presented at the symposium on computerized axial tomography, Montreal,
Quebec. Canada, May 1974
7. Taveras JM, Wood EH. Diagnostic neuroradiology, vol. 2, 2nd ed., part IV.
Selection of diagnostic procedures. Baltimore: Williams & Wilkins,
1976:1000
8. Messina AV, Potts DG, Rottenberg D, Patterson RH. Computed
tomog-raphy: demonstration of contrast medium within cystic tumors. Radiology
1976;120:345-347
9. Butler AR, Horii SC, Kricheff II, Shannon MB, Budzilovich GN. Computed tomography in astrocytomas. A statistical analysis of the parameters of
malignancy and the positive contrast-enhanced CT scan. Radiology
1978; 129:433-439
10. Daumas-Duport C, Meder JF, Monsaingeon V, Missir 0, Aubin ML, Szikla G. Cerebral gliomas: malignancy, limits and spatial configuration.
Compar-alive data from serial stereotaxic biopsies and computed tomography (a
preliminary study based on 50 cases). J Neuroradiol1983;10:51-80
11. Zimmerman HM. The pathology of primary brain tumors. Semin Roentgenol 1984;19: 129-138
12. Kelly PJ, Daumas-Duport C, Kispert DB, Kall BA, Scheithauer BW, Illig JJ.
Imaging based stereotaxic serial biopsies in untreated intracranial glial
neoplasms. J Neurosurg 1987;66:865-874
13. Folkman J. Tumor angiogenesis. Adv Cancer Res 1974;19:331-348
14. Brem S. The role of vascular proliferation in the growth of brain tumors.
Clin Neurosurg 1976;23:440-453
15. Deane BR, Lantos PL. The vasculature of experimental brain tumors. Part
1: A sequential light and electron microscope study of angiogenesis. J
Neurol Sci 1981;49:55-66
16. Brem S, Brem H, Folkman J, et al. Prolonged tumor dormancy by
preven-tion of neovascularization in the vitreous. Cancer Res 1976;36:2807-2812
17. Ziche M, Jones J, Gullino PM. Role of prostaglandin E, and copper in
angiogenesis. JNCI1982;69:475-482
18. Alpern-Eiran H, BremS. Angiogenesis in human brain tumors: inhibition by
copper depletion. Surg Forum 1985;36:498-500
19. Zagzag D, BremS. Control of neoplastic development in the brain: copper
depletion prevents neovascularization and tumor growth. Surg Forum
1986;37: 506-509
20. Raju KS, Alessandri G, Ziche M, Gullino PM. Ceruloplasmin, copper ions,
and angiogenesis. JNCI1982;69: 1183-1188
21. Carson BS, Anderson JH, Grossman SA, et al. Improved rabbit brain tumor
model amenable to diagnostic radiographic procedures. Neurosurgery
1982;11 :603-608
22. Cochran ST, Higashida RT, Holburt E, Winter J, Iwamoto K, Norman A.
Development of rabbit brain tumor model for radiologic research. Invest Radiol1985;20:928-932
23. Kumar AJ, Hassenbusch S, Rosenbaum AE, et al. Sequential computed
tomographic imaging of a transplantable rabbit brain tumor. Neuroradiology
1986;28:81-86
24. Zagzag D, BremS, Robert F. Neovascularization and tumor growth in the
rabbit brain: a model for experimental studies of angiogenesis and
blood-brain barrier. Am J Pathol1988;131 :361-372
25. Sage MR, Wilcox J, Evill CA, Benness GT. Comparison of blood-brain
barrier disruption by intracarotid iopamidol and methylglucamine iothala-mate. AJNR 1983;4: 893-895
26. Auerbach R, Morrissey LW, Sidky YA. Regional differences in the incidence
and growth of mouse tumors following intradermal or subcutaneous
inoc-ulation. Cancer Res 1978;38:1739-1744
27. BremS, Cotran RS, Folkman J. Tumor angiogenesis: a quantitative method for histologic grading. JNCI1972;48:347-356
28. Yasuda K, Koizumi H, Ohishi K, Noda T. Zeeman effect atomic absorption.
Prog Anal Atomic Spectr 1980;3:299-368
29. Sokal RR, Rohlf FJ. Biometry. The principles and practice of statistics in
biological research, 2nd ed. San Francisco: Freeman, 1981:454-477
30. Nystrom S. Pathological changes in blood vessels of human glioblastoma
multiforme. Comparative studies using plastic casting, angiography, light
microscopy and electron microscopy, and with reference to some other
brain tumors. Acta Pathol Microbial Scand [Suppl] 1960;49(137): 1-83
31. Folkman J, Klagsbrun M. Angiogenic factors. Science 1987;235:442-447 32. McAuslan BR, Reilly W. Endothelial cell phagokinesis in response to
specific metal ions. Exp Cell Res 1980;130:147-157
33. Parke A, Bhattacherjee P, Palmer RMJ, Lazarus NR. Characteri~ation and
quantification of copper sulfate induced vascularization of the rabbit
cor-nea. Am J Pathol1988;130: 173-178
34. Abell RG. The permeability of blood capillary sprouts and newly formed
blood capillaries as compared to that of older blood capillaries. Am J
Physiol1946;147:237-241
35. Goldstein GW, Betz AL. Recent advances in understanding brain capillary
function. Ann Neurol1983;14:389-395
36. Nishio S, Ohta M, Abe M, et al. Microvascular abnormalities in
ethylnitro-sourea (ENU)-induced rat brain tumors: structural basis for altered blood
brain barrier function. Acta Neuropathol (Berl) 1983;59: 1-10
37. Long OM. Capillary ultrastructure and the blood brain barrier in human malignant brain tumors. J Neurosurg 1970;32:127-144
38. Neuwelt EA, Rapoport Sl. Modification of the blood-brain barrier in the
chemotherapy of malignant brain tumors. Fed Proc 1984;43:214-219
39. Burger PC, Dubois PJ, Schold SC, et al. Computerized tomographic and
pathologic studies of the untreated, quiescent, and recurrent glioblastoma