Mapping of the Central Sulcus with Functional
MR: Active versus Passive Activation Tasks
Christine C. Lee, Clifford R. Jack, Jr, and Stephen J. Riederer
PURPOSE:Our purpose was to assess the pattern of functional MR activation obtained with a passive sensory versus an active sensorimotor hand stimulus paradigm.
METHODS:Eight functional MR runs, four with an active sensorimotor (sponge-squeezing) task and four with a passive sensory (palm-finger brushing) reception, were acquired for each of 10 healthy volunteers. Activation maps were generated by thresholding cross-correlation maps. Regions of interests (ROIs) were drawn around the precentral and postcentral gyri on T1-weighted images according to established anatomic criteria, and the number of activated pixels inside the ROIs was ascertained. Displacement of the sensorimotor and sensory activa-tion centroids within the ROIs from the central sulcus as well as from each other was measured. RESULTS: Active sensorimotor stimulation produced a significantly greater number of activation pixels than did passive sensory stimulation. Run-to-run variability was equivalent between sensorimotor and sensory activation tasks. On average, the sensorimotor and sensory activation centroids were located in the postcentral gyrus, and their spatial locations were not significantly different.
CONCLUSION: Active and passive activation tasks produce largely equivalent results. Pre-surgical mapping of the sensorimotor area can be performed with functional MR imaging using a passive palm-finger brushing task in patients who are physically unable to perform active finger-tapping or hand-squeezing sensorimotor activation tasks.
Functional magnetic resonance (MR) imaging is a noninvasive way to image brain areas activated by a given task or stimulus. Active finger-tapping or sponge-squeezing tasks are often used to specifically elicit a sensorimotor response, but patients with sur-gical abnormalities near the central sulcus frequently have hand weakness or motor impairment that may preclude them from executing these tasks, or, in their efforts to comply, induce greater head motion than that of unimpaired volunteers. A passive sensory stimulus, such as brushing of the palm and fingers, may be a useful alternative to an active sensorimotor task in these patients.
When the location of the functional central sulcus can be ascertained with confidence by functional MR imaging, subsequent intraoperative mapping typically corroborates the functional MR results obtained
pre-operatively (1–7). However, for many sensorimotor activation studies, functional activation may extend over two to three sulci or gyri in the perirolandic region on axial functional MR acquisitions, resulting in ambiguous identification of the central sulcus (Fig 1). Any level of ambiguity is unacceptable for surgical mapping. One approach to reduce ambiguity in ana-tomic localization of spatially distributed functional activation, which we used in this work, is to calculate the activation centroid or center of mass of the acti-vation pixels.
We compared a passive sensory (S) stimulus para-digm to an active sensorimotor (SM) parapara-digm in healthy volunteers. Insight gained by comparing the results of active stimulation versus passive stimulation in healthy volunteers may translate to more confident and accurate functional MR interpretations in pa-tients. The goals of this work were twofold: first, to assess whether S and SM tasks are equivalent markers for identification of the central sulcus and, second, to determine the spatial relationship between the ana-tomic central sulcus and the activation centroids gen-erated by S and SM activation tasks. We addressed four specific aims, which are expressed as questions: 1) Is the number of pixels within the region of interest (ROI) the same for SM and S tasks? In other words, is the magnitude of the functional MR response dif-ferent for an SM task than for an S task? 2) Is there
Received June 24, 1997; accepted after revision October 6. Presented at the annual meeting of the American Epilepsy So-ciety (AES), San Francisco, Calif, December 1996, and at the annual meeting of the American Society of Neuroradiology, To-ronto, Ontario, Canada, May 1997.
From the Department of Radiology, Mayo Clinic, Rochester, Minn.
Address reprint requests to Clifford R. Jack, Jr, MD, Depart-ment of Radiology Mayo Clinic, 200 First Street SW, Rochester, MN 55905.
©American Society of Neuroradiology
a difference in the run-to-run variability in the num-ber of activation pixels within the ROIs for an S versus an SM task? 3) What is the spatial relationship between the central sulcus and the centroids for an SM versus an S activation task? and 4) Are the loca-tions of the centroids for SM and S activation tasks different from each other?
Methods
Functional MR Imaging Acquisition
Scanning was performed on a 1.5-T MR imager using a standard bird-cage head coil. Ten healthy right-handed volun-teers (nine men and one woman, 25 to 49 years old) were studied. The two activation tasks, squeezing sponges (SM ac-tivation task) and passively receiving brushing stimuli on the palms and fingers (S activation stimulus), were demonstrated until the subjects were comfortable and could satisfactorily execute them. The participants were instructed to hold their heads still and informed that an aim of the study was to compare the two tasks. Sponges and straps were used to stabi-lize the head, and nine contiguous, 5-mm-thick T1-weighted axial anatomic images transecting the somatotopic hand area were acquired. Functional MR imaging studies over the same nine axial sections were performed using a multisection gradi-ent-recalled-echo single-shot echo-planar imaging (EPI) pulse sequence. Imaging parameters were 1080/45 (repetition time/ echo time) with a flip angle of 72° (Ernst angle). The field of view (FOV) was 24 cm and the in-plane resolution of the functional MR images was 3.75 33.75 mm. A total of 648 images were acquired (72 images per section) during the 81 seconds that elapsed for each functional MR run. No hand stimulus was performed during the first 3 seconds of each run in order to reach steady-state magnetization of the anatomic sections of interest. The stimulus paradigm during the follow-ing 78 seconds of each functional MR run involved three cycles of hand activation with alternation of hands occurring five times every 13 seconds. Visual cues to change hands were triggered by the pulse sequence. Four SM functional MR runs and four S functional MR runs were performed for a total of eight functional MR runs per volunteer. To ensure consistent
brushing, the same two experimenters brushed the left and right hands of each of the volunteers during all 40 of the S functional MR runs.
Activation Map
For each functional MR run, compensation was made for linear baseline drift of the functional MR signal (8). Cross-correlation of the signal with a sinusoidal function at the pri-mary stimulus frequency (9) was generated on a pixel-by-pixel basis for intracranial pixels only. The number of intracranial pixels (3.7533.75 mm) varied from 1000 to 1800 pixels de-pending on the size of the volunteer’s head and the particular anatomic section under consideration. Each intracranial pixel in the correlation map was associated with a functional MR signal containing 72 samples (ie, images in the time series). For each intracranial pixel, the chronological ordering of the 72 time samples was randomized 10 times, and a correlation co-efficient was calculated each time (10). This was done for all the relevant anatomic sections so that for each section, there were 10 000 to 18 000 correlation coefficients, the specific number dependent on the number of intracranial pixels. By reshuffling the data in this manner, a probability density func-tion was created whose values were distributed under the null hypothesis that no significant correlation existed between the stimulus input function and signal intensity fluctuation in indi-vidual pixels in the functional MR time series while capturing some of the noise properties of the functional MR data itself. To threshold the activation map, a pixel in the original func-tional MR time series was considered significantly activated if the probability of generating its calculated correlation coeffi-cient under the null hypothesis was less thanP5.001. As a result, the cross-correlation threshold value varied slightly across the different time series, but the probability of a false-positive activation was held constant atP,.001 over all time series.
The correlation phase termf5arctan(rs/rc), where rsand rcare the correlation of the time series with a sine and a cosine, respectively, was calculated for each pixel (8). The maximum cross-correlation coefficient was calculated over a range of 360° in phase increments of 15° or, equivalently, time intervals of 1.08 seconds. The phase at which the maximum pixel correla-tion coefficient was observed was used to segment the final activation map into pixels associated with right-hand activation (f 5 0° to 90°, left hemisphere) and those associated with left-hand activation (f5180° to 270°, right hemisphere). This convention of assigning pixels was based on the observations about blood oxygenation level–dependent (BOLD) hemody-namics by Bandettini et al (11) and Lee et al (8), and has been used by others (12).
Analysis
First, regions of interest (ROIs) were drawn around the pre-and postcentral gyri using stpre-andard neuroanatomic criteria on T1-weighted anatomic images by a neuroradiologist who was blinded to the functional MR results (13–20). Second, the right and left hemispheric thresholded activation maps for each of the eight functional MR runs were superimposed on the T1-weighted images with the ROIs, and the number of activation pixels within the ROIs was tabulated. In addition, the standard deviation of the number of activation pixels inside the ROIs was calculated for each run. Third, the activation centroids or centers of mass of the activation pixels within the ROIs were determined with weighting by the cross-correlation coefficients. These are illustrated in Figure 2. Fourth, for the purpose of aim 3, we identified the nearest tangential point in the central sulcus relative to the activation centroid in each hemisphere (Fig 3). The displacement of the centroid of functional activity with respect to the central sulcus was decomposed into x and y components and directionality was assigned on the basis of the following convention. Taking the point identified in the fourth FIG 1. Functional MR activation superimposed onto
step above as the reference, the following were computed: displacement of the centroid laterally from the central sulcus (along the right-left or x direction on an axial image) was given a “1” sign; displacement of the centroid medially from the central sulcus was given a “2” sign; displacement of the cen-troid posterior to the central sulcus (along the anteroposterior or y direction on axial images) was given a “2” sign; and displacement of the centroid anterior to the central sulcus was given a “1” sign. Fifth, for the purpose of aim 4, the relative displacements between the SM and S activation centroids in terms of x and y distance components were calculated using the S activation centroid as the reference point. The same conven-tions for directionality described above were used.
Results
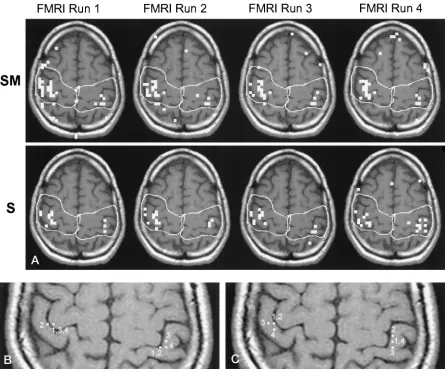
Figure 4 illustrates typical data from one volunteer. The activation maps of one section have been
super-imposed on its T1-weighted anatomic image with pre-viously identified ROIs. Comparison of the activation from the four SM functional MR runs and the four S functional MR runs suggests that the SM activation task elicits a greater response than the S activation task (Fig 4A). The activation centroids for both the SM and the S tasks tend to be located immediately posterior to the central sulcus (Fig 4B and C).
To address specific aim 1, Table 1 illustrates the average number of functional MR activation pixels for the SM and S activation paradigms separately for the right and left hemispheres. A significantly greater number of activation pixels is associated with an SM than with an S activation task (P , .01, t test). In addition, the number of functional MR activation
FIG 2. ROIs and centroids.
After the ROIs were drawn around the pre- and postcentral gyri using standard neuroanatomic criteria (A), the number of activation pixels within the ROIs was tabulated (B) and the centroids of the activation pixels within the ROIs were determined (C). The centroid is indicated by the white pixels (arrows) in each hemisphere.
FIG 3. Distance analysis.
[image:3.587.56.535.60.262.2] [image:3.587.56.536.309.516.2]pixels within the ROIs for an SM as well as an S functional MR study was significantly greater in the right than the left hemisphere (P, .01,t test).
To address specific aim 2, Table 2 illustrates that there was no significant difference in the run-to-run variability in the number of activation pixels either between hemispheres or between SM and S tasks (t test).
To address specific aim 3, Table 3 indicates that with both SM and S tasks, the centroids of functional MR activation were lateral and posterior to the
cen-tral sulcus. The lateral displacement (Table 3A) was more pronounced for an S than for an SM task (P, .01,ttest), and the posterior displacement (Table 3B) was more pronounced for an S than for an SM task (P , .02, t test). These results effectively place the centroids for both SM and S tasks in the postcentral gyrus. The interpretation of the data is made more clear by a consideration of the neuroanatomy of the
FIG 4. A functional MR study.
[image:4.587.72.520.59.434.2]This figure illustrates typical functional MR imaging activation patterns obtained in one section over the four SM functional MR runs and the four S functional MR runs (A). The four SM activation centroids calculated for the four SM functional MR runs are shown inB, and the four S activation centroids are shown inC. The numbers adjacent to the centroids indicate the functional MR run(s) from which they were obtained; some of the centroids were equivalent for different functional MR runs. Note the greater response for SM tasks relative to S tasks (A) and the tendency of the centroids for both activation tasks to lie in the postcentral gyrus.
TABLE 1: Magnitude of functional MR response. The average of the number of pixels within the ROIs on the thresholded activation map are calculated by task and by hemisphere.
TASK HEMISPHERE PValue Right Left
Sensorimotor (SM) 9.9 7.1 ,.01 Sensory (S) 7.7 5.9 ,.01
P,.01
TABLE 2: Run-to-run variability. The standard deviations of the number of activation pixels within the ROIs over the four SM func-tional MR runs and the four S funcfunc-tional MR runs were calculated by hemisphere, and the averages of these values over all 10 volun-teers are shown.
TASK HEMISPHERE Difference Right Left
Sensorimotor (SM) 2.91 2.38 NS Sensory (S) 2.72 2.40 NS NS
[image:4.587.55.283.533.603.2] [image:4.587.306.534.555.623.2]central sulcus, which angles medial to lateral as one moves posterior to anterior. The postcentral gyrus lies lateral and posterior to the central sulcus along its oblique course, accounting for the lateral or “1” displacement of the activation centroid along x, and for the posterior or “2” displacement of the activa-tion centroid along y.
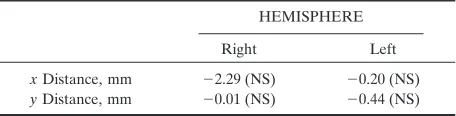
To address specific aim 4, Table 4 tabulates the mean displacements between the positions of SM and S centroids from each other. These measurements were decomposed into x and y components for both hemispheres. The positions of the SM centroids were not significantly different from those of the S cen-troids in either hemisphere (ttest).
Discussion
The impetus for this work grew out of the uncer-tainty that may be encountered when interpreting sensorimotor functional MR studies in patients who are candidates for surgery in the perirolandic region. We used functional MR techniques and activation stimuli that are commonly used in the field: gradient-echo-based single-shot EPI, multisection axial image acquisitions, cross-correlation for generation of the activation map, hand-squeezing for the motor task, and hand brushing for the sensory task. Using a dif-ferent scanning technique and processing strategy to investigate sensory and sensorimotor activation, Puce et al (2) found considerable overlap in the anatomic
distribution of functional MR activation between sponge-squeezing and brushing tasks. By inspecting the activation maps, these authors concluded that motor activation occurred anterior to and within the central sulcus, and that brushing produced activation posterior to the central sulcus. We also found signif-icant spatial overlap in SM and S activation. Although final activation maps showed slightly more anterior extent for SM activation than for S activation, both SM and S centroids tended to be located in the postcentral gyrus. Comparison of the coordinates of anatomic landmarks between the single-shot echo-planar and T1-weighted images revealed no discrep-ancy, thereby eliminating the possibility of anatomic misregistration as a confounding factor. PET mea-surements of regional cerebral blood flow (rCBF) in the primary motor and primary sensory cortices for active sensorimotor versus passive sensory-only hand stimuli have generally yielded greater changes in rCBF with sensorimotor activation paradigms (21– 26). This supports the results obtained in this work. It is not surprising that the loci of signal change in both the SM and S paradigms overlapped. Both palm-finger brushing and sponge squeezing (propriocep-tion, tactile stimulation) would be expected to acti-vate the primary sensory cortex. In addition, Brodmann’s area 4 (primary motor) and areas 3, 1, and 2 (primary sensory) are richly interconnected, so that primary activation of either one would elevate the rate of neuronal depolarization in the other.
Location of the functional MR signal in large cor-tical draining veins results in spatial nonspecificity, which in turn diminishes the accuracy of the tech-nique for functional mapping. Gao et al (27) investi-gated the effect of acquisition parameters on the site of origin (brain versus vein) of the functional MR signal and found that with single-section gradient-recalled echo acquisitions, inflow effects dominated the functional MR signal, thus placing the functional MR signal source within cortical draining veins. Con-versely, with multisection single-shot EPI acquisitions (with TRs greater than 1 second), the BOLD effect dominated. The BOLD contrast locus can be in cap-illaries, veins, or tissue adjacent to vascular structures. High field strengths (greater than 1.5 T) and radio-frequency refocused echoes favor microvascular lo-calization, although sensitivity to the BOLD effect is dramatically enhanced with gradient-refocused echoes. Nonetheless, the long TR multisection single-shot EPI acquisitions used in our study have substantially greater microvascular/parenchymal signal weighting than do single-section short TR acquisitions, which are domi-nated by venous inflow effects.
[image:5.587.54.285.124.262.2]The run-to-run standard deviation in the number of activation pixels (s 5 2 to 3) may seem excessive (Table 2). However, for a specific activation task, the average distance between the centroids of the first functional MR run and that of subsequent functional MR runs across all volunteers was less than 5.5 mm. That is, the position of the centroid was highly stable from run to run. This is illustrated in left hemispheric activity in Figure 4, where the run-to-run variability in
TABLE 3: Distance analysis. Normal vectors between the central sul-cus and the centroids were decomposed intoxandycomponents with their distances shown in (A) and (B), respectively. For conven-tion, directional signs were assigned according to the position of the centroid with respect to the central sulcus, which is described in the test.
xDistance, mm
PValue Right Left
Sensorimotor (SM) 0.25 1.56 ,.01 Sensory (S) 1.17 2.25 ,.01
P,.01
A y Distance, mm
PValue Right Left
Sensorimotor (SM) 20.66 22.16 P,.01 Sensory (S) 21.97 22.33 NS
P,.02
B Note.—NS indicates not significant.
TABLE 4: Relative distance analysis. Each vector drawn from the sensory centroid to the sensorimotor centroid was decomposed into itsxandycomponents. The directionality signs reflect the position of the sensorimotor centroid relative to the sensory centroid using the convention described in the text.
HEMISPHERE
Right Left
xDistance, mm 22.29 (NS) 20.20 (NS)
[image:5.587.55.283.339.397.2]the number of activation pixels within the ROIs for the S functional MR runs (Fig 4A, bottom) was 3 SD. Despite this variability, the centroid positions (Fig 4C) for functional MR runs 2 to 4 were less than 4 mm away from the centroid position of functional MR run 1.
Conclusion
SM and S tasks produce essentially equivalent re-sults. The run-to-run variability is equivalent between S and SM tasks, and the location of the two centroids for S and SM activation was not significantly different between them. However, the number of activated pixels is typically greater with an SM than an S task, and on average the centroid of S activation is located more posterior and lateral to the central sulcus than that of SM activation. While the position of the func-tional MR imaging centroid varied across different sections and among subjects, on average the S and SM activation centroids were located slightly poste-rior and lateral to the central sulcus (ie, in the post-central gyrus). Therefore, when presented with the scatter of activation pixels typically found in func-tional MR imaging, calculating the centroid can re-duce ambiguity of central sulcus localization for sur-gical mapping.
References
1. Jack CR Jr, Twomey CK, Zinsmeister AR, et al.Sensory motor cortex: correlation of presurgical mapping with functional MR imaging and invasive cortical mapping.Radiology1994;190:85–92 2. Puce A, Constable RT, Luby ML, et al.Functional magnetic res-onance imaging of sensory and motor cortex: comparison with electrophysiological localization.J Neurosurg1995;83:262–270 3. Yousry T, Schmid UD, Jassoy A, et al.Topography of the cortical
motor hand area: prospective study with functional MR imaging and direct motor mapping at surgery.Radiology1995;195:23–29 4. Pujol J, Conesa G, Deus J, et al.Presurgical identification of the
primary sensorimotor cortex by functional magnetic resonance imaging.J Neurosurg1996;84:7–13
5. Cosgrove GR, Buchbinder BR. Functional magnetic resonance imaging for intracranial navigation.Neurosurg Clin N Am1996;7: 313–322
6. Maldjian J, Atlas S, Howard RS, et al.Functional magnetic reso-nance imaging of regional brain activity in patients with intrace-rebral arteriovenous malformations before surgical or endovascu-lar therapy.J Neurosurg1996;84:477–483
7. Cedzich C, Taniguchi M, Schafer S, et al.Somatosensory evoked potential phase reversal and direct motor cortex stimulation dur-ing surgery in and around the central region.Neurosurgery1996; 38:962–970
8. Lee AT, Glover GH, Meyer CH.Discrimination of large venous vessels in time-course spiral blood-oxygen-level-dependent mag-netic resonance functional neuroimaging.Magn Reson Med1995; 33:745–754
9. Bandettini PA, Jesmanowicz A, Wong EC, Hyde JS.Processing strategies for time-course data sets in functional MRI of brain.
Magn Reson Med1993;30:161–173
10. Bullmore E, Brammer M, Williams SCR, et al.Statistical methods of estimation and inference for functional MR image analysis.
Magn Reson Med1996;35:261–277
11. Bandettini PA, Wong EC, Hinks RS, Tikofsky RS, Hyde JS.Time course EPI of human brain function during task activation.Magn Reson Med1992;25:390–397
12. Desmond JE, Sum JM, Wagner AD, et al.Functional MRI mea-surement of language lateralization in Wada-tested patients.Brain
1995;118:1411–1419
13. Berger MS, Cohen WA, Ojemann GA.Correlation of motor cortex brain mapping data with magnetic resonance imaging.J Neurosurg
1990;72:383–387
14. Iwasaki S, Nakagawa H, Fukusumi A, et al.Identification of pre-and postcentral gyri on CT pre-and MR images on the basis of the medullary pattern of cerebral white matter.Radiology1991;179: 207–213
15. Yetkin FZ, Papke RA, Mark LP, et al.Location of the sensor-imotor cortex: functional and conventional MR compared.AJNR Am J Neuroradiol1995;16:2109–2113
16. Rumeau C, Tzourio N, Murayama N, et al. Location of hand function in the sensorimotor cortex: MR and functional correla-tion.AJNR Am J Neuroradiol1994;15:567–572
17. Walter H, Kristeva R, Knorr U, et al. Individual somatotopy of primary sensorimotor cortex revealed by intermodal matching of MEG, PET, and MRI.Brain Topogr1992;5:183–187
18. Beisteiner R, Gomiscek G, Erdler M, et al.Comparing localization of conventional functional magnetic resonance imaging and mag-netocephalography.Eur J Neurosci1995;7:1121–1124
19. Sobel DF, Gallen CC, Schwartz BJ, et al. Locating the central sulcus: comparison of MR anatomic and magnetoencephalo-graphic functional methods.AJNR Am J Neuroradiol1993;14:915– 925
20. Orrison WW, Davis LE, Sullivan GW, et al.Anatomic localization of cerebral cortical function by magnetoencephalography combined with MR imaging and CT.AJNR Am J Neuroradiol1990;11:713–716 21. Roland PE.Motor functions.In:Brain Activation.New York, NY:
Wiley-Liss; 1993:237–268
22. Roland PE.Sensation and perception.In:Brain Activation.New York, NY: Wiley-Liss; 1993:141–194
23. Roland PE, Nielsen VK.Vibratory thresholds in the hands: com-parison of patients with suprathalamic lesions with normal sub-jects.Arch Neurol1980;37:775–779
24. Gelmers HJ.Cortical organization of voluntary motor activity as revealed by measurement of regional cerebral blood flow.J Neurol Sci1981;52:149–161
25. Fox PT, Raichle ME.Focal physiological uncoupling of cerebral blood flow and oxidative metabolism during somatosensory stim-ulation in human subjects.Proc Natl Acad Sci U S A1986;83:1140– 1144
26. Fox PT, Burton H, Raichle ME.Mapping human somatosensory cortex with positron emission tomography.J Neurosurg 1987;67: 34–43
27. Gao JH, Miller I, Lai S, et al.Quantitative assessment of blood inflow effects in functional MRI signals.Magn Reson Med1996;36: 314–319