Many insects exploit the polarization pattern of the sky for navigation or course control. Crickets belong to those insects in which polarization vision has been studied most thoroughly, i.e. at the anatomical, optical, electrophysiological and behavioural levels (e.g. Burghause, 1979; Labhart et al. 1984; Brunner and Labhart, 1987; Nilsson et al. 1987; Labhart, 1988; Herzmann and Labhart, 1989; Zufall et al. 1989; for a review, see Labhart and Petzold, 1993). Whereas eusocial hymenopteran species are especially amenable to a behavioural approach in studying polarization vision (for a review, see Wehner, 1994), the solitary field cricket proved to be well suited for electrophysiological studies. Only in crickets, and recently also in locusts, has the processing of polarized light information in the insect visual system been studied beyond the level of the retina by recording from polarization-sensitive interneurones (Labhart, 1988; Labhart and Petzold, 1993; Petzold and Labhart, 1993; Müller and Homberg, 1994; Petzold et al. 1995). The so-called POL-neurones of the field cricket Gryllus campestris receive input from the polarization-sensitive blue receptors of the specialized dorsal rim area of the compound eye. In these neurones, spike activity is a sinusoidal function of e-vector orientation with an excitatory and an inhibitory part and with the maxima and minima separated by 90 °. Thus, POL-neurones are polarization-opponent neurones receiving antagonistic input from two analyzer channels with orthogonal orientations of maximal sensitivity (Labhart, 1988).
Polarized stimuli for studying polarization sensitivity in the nervous system are usually obtained using dichroic polarizer sheets, which produce a very high degree of polarization (d≈1.0). This is in contrast to naturally observed d-values in the sky, which do not exceed approximately 0.75 even under optimal atmospheric conditions and are normally much lower (Coulson, 1988). The aim of this study was to assess how POL-neurones perform at physiologically relevant d-values as compared with the strongly polarized stimuli previously used.
Materials and methods Animals
Adult field crickets, Gryllus campestris (L.), were used for the experiments. They were laboratory-bred F1 offspring of crickets collected in the field. The crickets were kept and bred under long-day conditions (14 h:10 h L:D) at 26 °C and 60 % relative humidity. Lighting was provided by Osram L20W/10S daylight lamps.
Stimulation
Light was supplied by a 900 W xenon arc lamp feeding into two beam paths, one for stimulation with polarized light and one for adaptation with unpolarized light between the tests. In both light paths, blue light was produced by interference filters, intensity was controlled by a neutral density wedge or neutral density filters and electromagnetic shutters provided temporal
JEB0292
In crickets, polarized-light information from the blue sky is processed by polarization-opponent interneurones (POL-neurones). These neurones receive input from the polarization-sensitive blue receptors found in the specialized dorsal rim area of the compound eye. Even under optimal conditions, the degree of polarization d does not exceed 0.75 in the blue region of the spectrum and it is normally much lower. The aim of this study is to assess how POL-neurones perform at low, physiologically relevant degrees of polarization. The spiking activity of POL-neurones is a sinusoidal function of e-vector orientation
with a 180 ° period. The modulation amplitude of this function decreases strongly as the degree of polarization decreases. However, our data indicate that POL-neurones can signal e-vector information at d-values as low as 0.05, which would allow the polarization-sensitive system of crickets to exploit polarized light from the sky for orientation even under unfavourable meteorological conditions.
Key words: polarization vision, interneurones, optic lobe, electrophysiology, cricket, Gryllus campestris.
Summary
HOW POLARIZATION-SENSITIVE INTERNEURONES OF CRICKETS PERFORM AT
LOW DEGREES OF POLARIZATION
T. LABHART
Zoologisches Institut der Universität, Winterthurerstrasse 190, CH-8057 Zürich, Switzerland
Accepted 22 March 1996
control. The light was focused into flexible light guides the other ends of which were mounted on a perimeter instrument. To control the state of polarization, a linear polarizer (HNP′B, Polaroid) in combination with either an optical retarder or a diffusor was mounted on the perimeter in front of one of the light guides (for details, see below).
For the recordings from photoreceptors, only the stimulation path was used. The stimulus was positioned approximately in the optical axis of the photoreceptors. With elliptically polarized light (with a retarder plate) and plane-polarized light (polarizer only), stimulus diameter was 1.0 ° and stimulus wavelength was 440 nm (narrow-band interference filter, Schott; half-width 13 nm). With partially plane-polarized light (diffusor), the stimulus diameter was 4.8 ° and a blue filter with a wider bandwidth (K45, Balzers, half-width 60 nm) had to be used to make up for the intensity loss caused by the diffusor. Light intensity was 3.8×10¹²quanta s−1cm−2at the preparation for all states of polarization.
For the experiments with POL-neurones, the stimuluation path provided polarized stimuli during the tests. The stimulus was positioned at the zenith (with respect to natural head position). Stimulus diameter was 1.5 ° at a light intensity of 1.1×10¹³quanta s−1cm−2 or 1.3 ° at a light intensity of 0.83×10¹³quanta s−1cm−2 and stimulus wavelength was 440 nm (narrow-band interference filter, Schott; see above). The adaptation path delivered unpolarized light between the tests and was used with approximately half of the POL-neurones to maintain a constant level of light adaptation. The adaptation light was positioned as close as possible to the polarized stimulus (5 ° off the stimulus axis). Because of the large and strongly overlapping visual fields (Labhart et al. 1984), it stimulated much the same photoreceptors as the polarized stimulus. The adaptation light had a diameter of 3.1 ° and a wavelength of 443 nm (narrow-band interference filter, Balzers; half-width 12 nm). The intensity of the adaptation light was adjusted to within 0.1 log units of that of the polarized stimulus.
Control of the state of polarization
Partially plane-polarized light was produced by mounting a diffusor in front of the polarizer. The diffusor consisted of a small acrylic disc that was ground bifacially with emery powder. Elliptically polarized light was generated by combining a linear polarizer with an optical retarder, i.e. a quarter-wave (λ/4) plate. Ellipticity is a function of the angle between the e-vector produced by the polarizer and the principal axis of the retarder. As this angle increases from 0 ° to 45 °, ellipticity decreases from d=1 (linear polarization) to d=0 (circular polarization) (for a definition of d, see below). We constructed a λ/4 plate for 440 nm by sandwiching together a λ/2 plate for 280 nm and a λ/4 plate for 140 nm (both by Polaroid) after adjusting their principal axes relative to one another. This compound plate allowed ellipticity to be varied between d≈0.025 and d≈0.98 with the 440 nm interference filter. Note that the orientation of the λ/4 plate also influences the principal axis of the polarization ellipse, i.e. the principal
e-vector. Therefore, the e-vector response functions for different ellipticities are phase-shifted relative to one another (see Figs 1, 2 and 3). The degree of polarization or ellipticity was measured during the experiments using a simple polarimeter system based on an Optometer model 161 with detector head model 222AUV (United Detector Technology). The detector was fitted with a wideband blue filter (BG 28, Schott) and a high-quality linear polarizer (HNP′B, Polaroid) and was placed next to the head of the cricket. As the stimulating e-vector rotates, the polarimeter signal (V) oscillates sinusoidally (Fig. 2B,C). The amplitude of this modulation indicates either the degree of polarization of plane-polarized light or the ellipticity of elliptically plane-polarized light, both defined as d=(Vmax−Vmin)/(Vmax+Vmin).
Preparation and recording
Crickets were waxed to a stage with their head centred in the perimeter and oriented appropriately for electrode approach. Intracellular recordings from photoreceptors were made as described in detail by Labhart et al. (1984). For recordings from POL-neurones, a small window was cut in the head capsule to expose the left optic lobe (see Fig. 1 in Labhart, 1988). To facilitate penetration of the electrode through the brain sheath, 1 % collagenase (C-0130, Sigma) in cricket saline was applied for a few minutes. Signals from POL-neurones were recorded intracellularly in the proximal part of the medulla. The experiments were performed using a conventional electrophysiological apparatus with micropipettes filled with 2 mol l−1 KCl and using a high-impedance electrometer (M 707, World Precision Instruments). Cell responses, polarizer orientation, polarimeter signal and shutter states were all recorded on a DAT-recorder (DTR 1800, Bio-Logic).
Experimental protocol
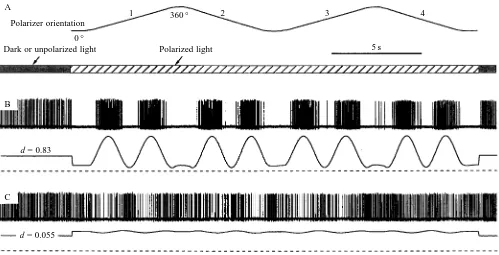
To test the e-vector response of both photoreceptors and POL-neurones, the eye was stimulated with continuous light with the polarizer constantly rotating from 0 ° to 360 ° and back with an angular velocity of approximately 80 ° s−1 (see Figs 1A, 2A). For measuring photoreceptor responses, stimulation lasted at least 1 min so that light adaptation reached a steady state. Test periods were separated by variable dark periods during which adjustments were made to change the state of polarization. In order to measure e-vector responses of POL-neurones, the polarizer was rotated twice from 0 ° to 360 ° and back (see Fig. 2A). Test periods were separated either by dark periods or by periods of adaptation with unpolarized light.
Evaluation of data
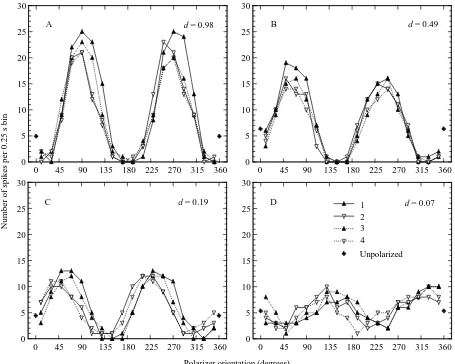
For the POL-neurones, we obtained e-vector response functions for each 360 ° polarizer rotation by counting the number of action potentials in consecutive 20 ° bins of polarizer orientation (corresponding to 0.25 s) (see Fig. 3).
To quantify response strength to polarized light we defined the following response value R:
where ni is the number of spikes in bin i, and n¯ is the mean number of spikes per bin during that 360 ° polarizer rotation. In words, R is the sum of absolute differences between e-vector-specific spike counts (ni) and mean spike count (n¯). Therefore, R is a measure of the amplitude of spike frequency modulation during a 360 ° e-vector rotation. For comparison, the mean number of spikes per 0.25 s bin during a 6.0 s period with no polarized stimulus (dark or unpolarized light) immediately preceding the start of each test period was determined. The individual pre-test spike counts were processed in the same way as the test counts, resulting in a ‘response’ value R0for the non-stimulus situation (reduced to 4.5 s, i.e. the same time period as the test). Owing to fluctuations in spontaneous spike rates, R0is always greater than zero. Thus, R0 represents the baseline value for any response R; i.e. R cannot (statistically) become smaller than R0. To assess the polarizer orientation eliciting the maximal response Pmax, e-vector response functions were determined in a similar way as above but with a finer resolution. This was achieved by spacing the 20 ° bins 5 ° apart (instead of 20 °), i.e. consecutive bins overlap by 15 °. From these e-vector response functions, the maximum ranges were selected, defined as those parts of the function surmounting the mean response n¯. We defined Pmax as that polarizer orientation for which the areas under the curve to the left and right of Pmax were equal. To avoid starting and stopping effects, the evaluation of Pmaxwas restricted to the 20–340 ° range of the e-vector response functions, i.e. Pmaxvalues were only determined for maximum ranges fully contained within these limits. The maximum ranges were clearly delimited in all but a few e-vector response functions with very low d-values, for which no Pmax values were calculated.
Results
Use of elliptically polarized light
The aim of this study was to assess how the POL-neurones of the cricket perform with different degrees of polarization d. Controlling the d-value of a stimulus is not a trivial task. One method is to mix different ratios of plane-polarized light and unpolarized light. This requires a sophisticated apparatus that is prone to produce polarized stimuli that, for mechanical reasons, are flawed by intensity modulations during e-vector rotation (see Edrich and von Helversen, 1987). In addition, the limited space in our electrophysiological apparatus prohibited
the installation of such a mixing device. The degree of polarization can also be controlled by depolarizing plane-polarized light with a set of diffusing ground-glass screens of different diffusing strengths. Apart from being restricted to discrete levels of polarization, this method has the disadvantage that the intensity of the polarized light source has to be adjusted for each d-value to keep stimulus intensity constant at the eye of the cricket and, at low d-values (i.e. with strong diffusors), enormous source light intensities are necessary since most light is scattered away from the direction to the cricket.
For theoretical reasons, partially plane-polarized light and elliptically polarized light with the same d-value (a measure of both the degree of polarization and the ellipticity; see Materials and methods) are equivalent for a photoreceptor. In unpolarized or partially plane-polarized light, the e-vector changes rapidly (f≈108s−1) and in an unpredictable fashion (Hecht, 1987). Elliptically polarized light is characterized by very fast rotation of the e-vector (f=6.8×10¹⁴s−1 at 440 nm), i.e. 568 times within the 250µm long rhabdom of a cricket dorsal rim receptor. Clearly, a photoreceptor has neither the temporal nor the spatial resolution to discriminate between the two stimuli as long as they have the same d-value. We tested these theoretical considerations in a number of dorsal rim receptors using intracellular recordings. The receptors were stimulated both with partially plane-polarized light (d=0.66) and with elliptically polarized light of variable d (including d=0.66). In both states of polarization, the principal e-vector rotated continuously from 0 ° to 360 ° and back. In accordance with theory, both types of stimuli evoked similar modulations of the receptor potential, and the modulation amplitudes as tested with d=0.66 were identical (see Fig. 1A,B). It is therefore justifiable to substitute partially plane-polarized light with elliptically polarized light, and the measure d, which expresses ellipticity, is in effect a measure of the degree of linear polarization.
Response of POL-neurones as a function of the degree of polarization
POL-neurones are polarization-opponent interneurones that receive input from two analyzer channels with orthogonal orientations of maximal sensitivity to the e-vector (Labhart, 1988). In the dark or with unpolarized light, they show spontaneous spike activity (Fig. 2; Labhart, 1988). Stimulated with the rotating e-vector of polarized light, they respond with a strong 180 ° periodic modulation of spike frequency around the spontaneous activity level (Fig. 3A; Labhart, 1988). The sharp responses to the varying e-vector and the high maximal spike frequencies of approximately 100 Hz and above indicate that all recordings were from the ‘classical’ (type I) POL-neurones described by Labhart and Petzold (1993; compare Petzold et al. 1995; J. Petzold, personal communication). In the present experiments, we used periods of polarized light during which the polarizer rotated twice from 0 ° to 360 ° and back to 0 ° (the four 360 ° rotations are designated 1–4; see Fig. 2A). Originally, the stimulation periods were separated by dark
^
i=18
i=1
periods. Under these conditions, the e-vector response showed a substantial adaptation from rotation 1 to rotation 4. Spike frequency modulation as expressed by the response value R (for a definition of R, see Materials and methods) diminished by approximately 25 % from rotation 1 to rotation 4. Our photoreceptor recordings indicate that this adaptation is at least
partially due to adaptation of the photoreceptor response. Adaptation with unpolarized light between test periods to maintain light adaptation alleviated, but did not abolish, adaptation of the POL-neurone response. In order to save precious recording time, we decided not to extend the stimulation period to allow for complete adaptation but to
360 °
0 ° 5 s
2 mV A
Elliptical polarization
d = 0.66
Linear polarization
d = 0.66
Linear polarization
d = 0.99
0 1.0 2.0 3.0 4.0 5.0
Modulation amplitude (mV)
0 0.2 0.4 0.6 0.8 1.0 Degree of polarization, d
[image:4.612.70.540.72.243.2]B
Fig. 1. Response of a dorsal rim photoreceptor to plane-polarized and elliptically polarized light. (A) Modulation of the receptor potential as the polarizer rotates by 360 ° in both directions. Traces are smoothed for clarity. The phase shift of modulation with elliptical polarization results from the phase-shifted principal e-vector due to the retarder plate. The polarization sensitivity of this photoreceptor was 5.8. (B) Amplitude of modulation as a function of d (degree of polarization or ellipticity; for a definition, see Materials and methods). Different symbols (circles, triangles) represent data from two series of experiments on the same photoreceptor at different times. Open symbols, data with elliptical polarization; filled symbols, data with linear polarization. The data confirm the hypothesis based on theory that partially plane-polarized and elliptically polarized light with the same d-value are equivalent for a photoreceptor
B
C A
1 2 3 4
5 s Polarized light
360 °
0 ° Polarizer orientation
Dark or unpolarized light
d = 0.83
d = 0.055
[image:4.612.54.553.341.596.2]exclude the R-values of rotation 1 from further considerations of response strength. This reduced the effect of adaptation to less than 10 % (see Fig. 3A–C for an illustration of the adaptation effect: the e-vector response function 1 has a larger modulation amplitude than the response functions 2–4).
As expected, the modulation of spike frequency decreases as the degree of polarization d decreases (exemplified in Fig. 3). This dependence is quantified in Fig. 4A, which presents the averaged R-values R–(for rotations 2–4) of each test as a function of d. Three features of this graph attract attention. (1) The POL-neurone response R is a nonlinear function of polarization d (see Discussion). (2) At the higher d-values, the responses obtained with dark periods between tests (filled symbols) seem to be stronger than those in the light-adapted preparations (open symbols). This difference may not be significant as all three dark-adapted POL-neurones were from the same preparation and, as was our previous experience with dark-adapted crickets (T. Labhart and J. Petzold, unpublished observations), there is substantial variation of maximal spike frequency between POL-neurones.
(3) The POL-neurones show clear responses with d-values as low as 0.05 (see also Figs 2C, 3D). For the threshold range of d<0.10, we compared statistically the individual values of R for each polarizer rotation (2–4) with the ‘response’ values R0 obtained when no polarized stimulus was presented (Fig. 4B). Fig. 4 shows that when d was close to 0.05 most R-values exceeded the 95 % confidence limit of the R0-values (upper horizontal line), indicating significant e-vector-evoked modulation of spike frequency.
However, even with a response value R that significantly exceeds the baseline value R0, the e-vector response function may be too noisy for coding useful directional information. A straightforward way to assess the coding performance of POL-neurones is to compare the polarizer orientations Pmax that elicit maximal spike frequency during the four rotations periods. The scatter of the Pmax-values indicates coding reliability, i.e. the smaller the deviations, the better the reliability. First, we determined the Pmax-values for each polarizer rotation using e-vector response functions similar to those in Fig. 4 but with four times the resolution (for
0 5 10 15 20 25 30
0 45 90 135 180 225 270 315 360
d = 0.98
A
0 5 10 15 20 25 30
0 45 90 135 180 225 270 315 360
d = 0.49
B
0 5 10 15 20 25 30
Number of spikes per 0.25 s bin
0 45 90 135 180 225 270 315 360
Polarizer orientation (degrees)
d = 0.19
C
0 5 10 15 20 25 30
0 45 90 135 180 225 270 315 360 Unpolarized
d = 0.07
D 1
2 3 4
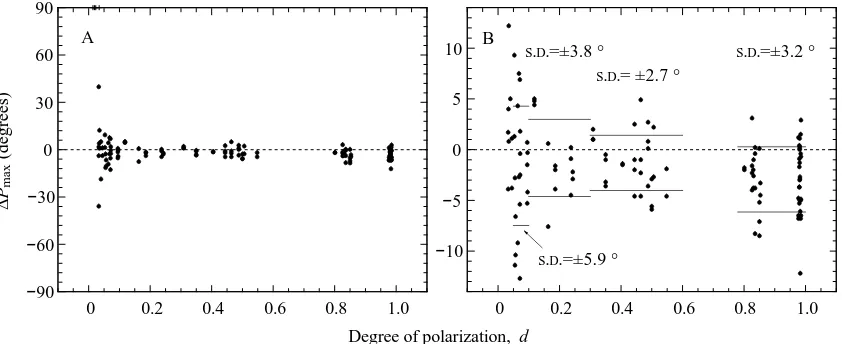
[image:5.612.80.535.73.437.2]procedures, see Materials and methods). Then, we calculated for each test the difference between the corresponding Pmax orientations obtained for the two 0 ° to 360 ° polarizer rotations (1 and 3), where ∆Pmaxis defined as Pmax,3−Pmax,1, and for the two 360 ° to 0 ° rotations (2 and 4), where ∆Pmaxis defined as Pmax,2−Pmax,4. As demonstrated in Fig. 5A, the ∆Pmax-values remain rather similar down to d≈0.1. With d<0.05, ∆Pmax increased in several tests, although in all but four tests (symbols at +90 °) the ∆Pmaxorientations were clearly defined (see Materials and methods). In Fig. 5B, which focuses on the central ∆Pmaxrange of Fig. 5A, four ranges of d were defined
for which the standard deviations of ∆Pmax were calculated (see error bars). The data indicate that the precision with which the principal e-vector is indicated by the POL-neurones is quite constant for d-values greater than 0.1 and is only slightly impaired for d-values between 0.05 and 0.1. Surprisingly, the ∆Pmax-values are not distributed equally around ∆Pmax=0, but show some bias towards negative values, especially at the higher degrees of polarization. The extent of bias is similar for both 0 ° to 360 ° and 360 ° to 0 ° polarizer rotations (data not shown). With our definition of ∆Pmax(see above), this means that maximal spike frequency during the second of the two
50 100 150 200
Response,
R
0.2 0.4 0.6 0.8 1.0
Degree of polarization, d No
stimulus
0 0.05 0.10 0
10 20 30 40 50 60
No stimulus
A B
[image:6.612.88.519.74.257.2]0 0
Fig. 4. The strength of the e-vector response R (for a definition, see Materials and methods) of seven POL-neurones as a function of the degree of polarization d. (A) All data covering the full range of d-values tested. Each symbol represents the mean response value R¯ for each test (rotations 2–4). Filled symbols, experiments with dark periods between tests; open symbols, experiments with periods of unpolarized light between tests; different shapes of symbol denote different POL-neurones. Data at the no-stimulus position indicate mean response values R¯0
obtained for the periods between tests. (B) Data for d<0.10. Symbols represent individual response values R for each polarizer rotation (rotations 2–4 of each test) or R0for each inter-test period (no-stimulus values). The oblique line is a linear regression through the data (R=632.9 d+1.5,
r2=0.68); horizontal lines mark the mean and the upper 95 %-confidence limit of the no-stimulus data. The POL-neurones show clear responses
with degrees of polarization d as low as 0.05.
−90
−60
−30 0 30 60 90
0 0.2 0.4 0.6 0.8 1.0
Degree of polarization, d A
−10
−5 0 5 10
0 0.2 0.4 0.6 0.8 1.0
S.D.=±3.2 ° S.D.= ±2.7 °
S.D.=±3.8 °
S.D.=±5.9 °
B
∆
Pmax
(degrees)
Fig. 5. Scatter in signalling e-vector orientations of five POL-neurones as a function of degree of polarization d. For a definition of ∆Pmax
(ordinate), see text. (A) All data for the full potential range of scatter (±90 °). Dots represent individual values of ∆Pmax; symbols at +90 °
[image:6.612.93.514.371.543.2]compared rotations occurs a bit earlier than during the first one. This may be another effect of adaptation of the e-vector response.
Discussion The d-characteristic
In accordance with theoretical considerations, the d-characteristic of the photoreceptor in Fig. 1, which has a polarization sensitivity (PS) of 5.8, is quasilinear (see Fig. 1B). With higher polarization sensitivities (PS of approximately 8 and above), an actual nonlinearity (monotonic function with increasing slope) would become apparent. The modulation amplitude of the receptor potential M is given by:
M = k×log[(1 + PS ×p)/(PS + p)] ,
where k is a constant, PS is the polarization sensitivity of the photoreceptor, and p=−(d+1)/(d−1) or p=Vmax/Vmin (see Materials and methods). The term is logarithmic because of the log–linear intensity characteristic of the photoreceptor. We suppose that the characteristic opponency of the POL-neurones is a result of the subtraction of the responses of two sets of photoreceptors with orthogonal e-vector tuning angles (Labhart, 1988), i.e. the e-vector response represents the difference between 90 ° phase-shifted photoreceptor signals. This operation results in a d-characteristic with a shape similar to the d-characteristic of the photoreceptors. Thus, for the POL-neurones, we might expect a linear or slightly nonlinear relationship between R and d, depending on the value of the compound PS of the photoreceptors that provide input to the POL-neurones. However, the modulation of spike frequency (expressed by the response value R) is a strongly nonlinear function of d with decreasing slope (Fig. 4A). A reason for this may be that the e-vector response is asymmetric with respect to spontaneous frequency at medium and high d-values because the response range between spontaneous frequency and 0 Hz is rather narrow (see Fig. 3A–C, and Fig. 2 in Labhart, 1988). Therefore, the modulation of the generator potential in the POL-neurone may well be a linear function of d, but the modulation of the spike frequency is not, as a result of clipping. To test this hypothesis, we have calculated a modified R-value, which applies only to those parts of the e-vector response functions that surmount the spontaneous frequency. This procedure does indeed remove most of the nonlinearity, indicating that clipping does play a major role in shaping the d-characteristic. If R is calculated for the values below the spontaneous frequency, clipping can be seen to start between d=0.2 and d=0.3. This may be taken as an indication that POL-neurones are designed for low rather than high degrees of polarization.
There are strong reasons to believe that insects do not rely on the degree of polarization for navigation. (1) Whereas the e-vector pattern of the sky is rather robust, the d-pattern is markedly susceptible to even minor atmospheric disturbances such as light haze (Brines and Gould, 1982; Coulson, 1988) and is therefore unsuitable as a navigation cue. (2) As shown
in honeybees, it is the e-vector orientation that is evaluated, and d is ignored as long as it is high enough to allow the perception of the e-vector (Rossel and Wehner, 1984; Brines and Gould, 1979). Since d seems not to be coded by the insect visual system, the exact shape of the d-characteristic becomes irrelevant. Instead, it is the minimal degree of polarization at which the e-vector can be perceived that seems to be important.
e-vector coding
As shown above, the threshold for discriminating an e-vector response from the background noise is in the region of d=0.05 (Fig. 4B). e-vector coding in POL-neurones remains intact down to a similar value of d (Fig. 5B). What does this mean in terms of the behaviour of the cricket?
Note that we arrived at the thresholds mentioned above by considering individual e-vector response functions rather than averaged data (see Figs 4B, 5B). This probably corresponds to the natural situation in which an insect has no opportunity to calculate average response functions (see Bialek et al. 1991). An averaging procedure would of course lower the threshold. We have tacitly assumed that crickets use some ‘scanning’ mechanism of e-vector detection, whereby the insect makes rotatory movements about its vertical body axis to scan the e-vector pattern of the sky with its dorsal rim areas (Kirschfeld, 1972; Rossel and Wehner, 1986). This behaviour induces spike frequency modulations of the POL-neurones in a similar way to that occurring in our experiments, and maximal spike frequencies indicate the symmetry plane of the e-vector pattern. However, as the visual system of the cricket contains three types of POL-neurones with different tuning angles (Labhart, 1988; Labhart and Petzold, 1993), e-vectors could also be determined instantaneously by comparing the three POL-neurone outputs (‘simultaneous’ mechanism) (Kirschfeld, 1972; Edrich and von Helversen, 1987). The visual fields of the three POL-neurone types almost coincide (Petzold and Labhart, 1993; J. Petzold, personal communication), and therefore the modulation amplitudes of the three POL-neurone types will covary with different d-values. Thus, our considerations on response strength are relevant to both models of e-vector detection. However, double or triple recordings from different POL-neurones would be necessary to assess the reliability for e-vector coding as a function of d for the simultaneous model.
The absolute intensity threshold of polarization vision in field crickets is 2.5×10⁷quanta cm−2s−1 of blue light (Herzmann and Labhart, 1989). Interestingly, a similar value has been obtained for the absolute threshold of POL-neurones (Petzold and Labhart, 1993). Thus, there seems to be a close correlation between the performance of the POL-neurones and that of the whole organism. This may indicate that d-values of 0.05, which elicit threshold responses in POL-neurones, are indeed exploited by orienting field crickets. For comparison, behavioural experiments with honeybees indicate a somewhat higher threshold of d≈0.1 (von Frisch, 1965; Edrich and von Helversen, 1987).
natural wide-field stimuli may have improved performance since the ommatidia of the dorsal rim area would have been more strongly and more evenly stimulated. Likewise, we might have extracted useful directional information down to even lower d-values with slower polarizer rotation and correspondingly larger (i.e. longer) bin sizes. Finally, of course, the algorithm used to calculate Pmaxis purely arbitrary. The way in which the nervous system of the cricket decodes the POL-neurone signal is completely unknown. For these reasons, the absolute values of ∆Pmax (Fig. 5B) should be treated with caution. However, our evaluation shows that the POL-neurone signal does contain useful directional information with d-values as low as 0.05. Living organisms are demonstrably good at extracting information even from noisy signals, approaching the physical limit in many cases (e.g. Bialek et al. 1991; Aho et al. 1993; for reviews, see Bialek, 1987; Block, 1992). We trust that the cricket nervous system is no less adept at evaluating the e-vector information contained in the POL-neurone response than our simple algorithm.
Physiological significance
The light intensities used in our experiments lie more than 5 log units above both the behaviourally determined absolute threshold of polarization vision and the response threshold of the POL-neurones (Herzmann and Labhart, 1989; Petzold and Labhart, 1993). They are typical for the blue part of the spectrum in early evening twilight (McFarland and Munz, 1975; Munz and McFarland, 1973). This time of the day falls well within the activity period of field crickets (Rost and Honegger, 1987) and, because of the near-horizon position of the sun, there is a high degree of polarization in the upper part of the sky.
Even under optimal conditions (clear, dry sky at high altitude), the polarization maximum dmaxat 90 ° from the sun does not exceed 0.75 in the blue range of the spectrum. At lower altitudes, dmax is usually lower as a result of the scattering effects of non-gaseous particles (haze, aerosols, dust) in the atmosphere (Coulson, 1988). Polarimetric measurements of the sky are usually performed using probes with an aperture of only a few degrees, whereas the POL-neurones have wide visual fields of approximately 60 ° in diameter (Labhart and Petzold, 1993; J. Petzold, personal communication). Optical integration by the POL-neurones over a large area of the sky will therefore result in an even lower effective degree of polarization deff. To measure deffin the sky, we have constructed an opto-electronic model of a POL-neurone (Petzold and Labhart, 1994). Even under the best conditions (clear sky, low solar elevation), deffdid not exceed approximately 0.4 (T. Labhart, unpublished results). Therefore, it seems that insects have to cope with rather weak polarization signals. The high sensitivity of the POL-neurones allows them to exploit skylight polarization even under unfavourable conditions, when the sky is densely cluttered with clouds. Under complete overcast by thin clouds, for instance, we have observed deff-values that just exceeded 0.05.
The undesirable reduction in signal amplitude of celestial polarization caused by optical integration is compensated by a gain in signal quality: as observed with our opto-electronic model, the POL-neurones are rather insensitive to disturbances of the polarization pattern such as clouds or foliage within the visual field as the crickets make foraging or mating excursions in their grassland habitat (T. Labhart, unpublished observations). The e-vector response of POL-neurones is intensity-independent because of the polarization-opponent process (Labhart, 1988; Labhart and Petzold, 1993). POL-neurones are colour-blind since the dorsal rim area is monochromatic, containing only blue receptors (Labhart et al. 1984; Zufall et al. 1989; Labhart, 1988). Within their wide visual fields, the POL-neurones are indifferent to the position of a polarized stimulus (Labhart and Petzold, 1993). However, the POL-neurones are strongly sensitive to the orientation of the e-vector of polarized light even when the polarization signal is very weak (Herzmann and Labhart, 1989; present data). The POL-neurones of the cricket are thus typical feature detector neurones that are tuned to a specific e-vector of polarized light. Although insects, or at least bees, seem to ignore the degree of polarization (see above), the POL-neurones are not insensitive to it. However, for both a mechanism that evaluates the response maximum (scanning model) and a mechanism that compares the responses of differently tuned POL-neurones (simultaneous model), the modulation amplitudes of the e-vector response functions are, in principle, irrelevant. Only with small modulation amplitudes, when noise becomes an important factor, does the degree of polarization affect the accuracy of the e-vector detection system.
This work was supported by the Swiss National Science Foundation grant 31-28662.90. I thank Drs Rüdiger Wehner and Gábor Horváth for critical comments on the manuscript.
References
AHO, A.-C., DONNER, K., HELENIUS, S., OLESEN LARSEN, L. AND
REUTER, T. (1993). Visual performance of the toad (Bufo bufo) at
low light levels: retinal ganglion cell responses and prey-catching accuracy. J. comp. Physiol. A 172, 671–682.
BIALEK, W. (1987). Physical limits to sensation and perception. A.
Rev. Biophys. biophys. Chem. 16, 455–478.
BIALEK, W., RIEKE, F., DE RUYTER VAN STEVENINCK, R. AND
WARLAND, D. (1991). Reading a neural code. Science 252,
1854–1857.
BLOCK, M. S. (1992). Biophysical principles of sensory transduction.
In Sensory Transduction (ed. D. P. Corey and S. D. Roper), pp. 1–17. New York: Rockefeller University Press.
BRINES, M. L. ANDGOULD, J. L. (1979). Bees have rules. Nature 206,
571–573.
BRINES, M. L. ANDGOULD, J. L. (1982). Skylight polarization patterns
and animal orientation. J. exp. Biol. 96, 69–91.
BRUNNER, D. AND LABHART, T. (1987). Behavioural evidence for
polarization vision in crickets. Physiol. Ent. 12, 1–10.
BURGHAUSE, F. M. H. R. (1979). Die strukturelle Spezialisierung des
dorsalen Augenteils der Grillen (Orthoptera, Grylloidea). Zool. Jb.
COULSON, K. L. (1988). Polarization and Intensity of Light in the
Atmosphere. Hampton: A. Deepak Publishing.
EDRICH, W. AND VON HELVERSEN, O. (1987). Polarized light
orientation in honey bees: is time a component in sampling? Biol.
Cybernetics 56, 89–96.
HECHT, E. (1987). Optics. Menlo Park: Addison-Wesley Publishing
Company.
HERZMANN, D. AND LABHART, T. (1989). Spectral sensitivity and
absolute threshold of polarization vision in crickets: a behavioral study. J. comp. Physiol. A 165, 315–319.
KIRSCHFELD, K. (1972). Die notwendige Anzahl von Rezeptoren zur
Bestimmung der Richtung des elektrischen Vektors linear polarisierten Lichtes. Z. Naturforsch. 27, 578–579.
LABHART, T. (1988). Polarization-opponent interneurons in the insect
visual system. Nature 331, 435–437.
LABHART, T., HODEL, B. ANDVALENZUELA, I. (1984). The physiology
of the cricket’s compound eye with particular reference to the anatomically specialized dorsal rim area. J. comp. Physiol. A 155, 289–296.
LABHART, T. ANDPETZOLD, J. (1993). Processing of polarized light
information in the visual system of crickets. In Sensory Systems of
Arthropods (ed. K. Wiese, F. G. Gribakin, A. V. Popov and G.
Renninger), pp. 158–168. Basel, Boston, Berlin: Birkhäuser Verlag.
MCFARLAND, W. N. ANDMUNZ, F. W. (1975). The visible spectrum
during twilight and its implications to vision. In Light as an
Ecological Factor: II, The 16th Symposium of the British Ecological Society 1974 (ed. G. C. Evans, R. Bainbridge and O.
Rackham), pp. 249–287. Oxford, London, Edinburgh, Melbourne: Blackwell Scientific Publications.
MÜLLER, M. ANDHOMBERG, U. (1994). Influence of visual stimuli on
the activity of neurons in the central complex of the locust
Schistocerca gregaria. In Proceedings of the Neurobiology Conference Göttingen 22 (ed. N. Elsner and H. Breer), p. 462.
Stuttgart, New York: Thieme Verlag.
MUNZ, F. W. ANDMCFARLAND, W. N. (1973). The significance of spectral position in the rhodopsins of tropical marine fishes. Vision
Res. 13, 1829–1874.
NILSSON, D. E., LABHART, T. ANDMEYER, E. P. (1987). Photoreceptor
design and optical properties affecting polarization sensitivity in ants and crickets. J. comp. Physiol. A 161, 645–658.
PETZOLD, J., HELBLING, H. AND LABHART, T. (1995). Anatomy and
physiology of four new types of polarization-sensitive interneuron in the cricket Gryllus campestris. In Proceedings of the
Neurobiology Conference Göttingen 23 (ed. N. Elsner and H.
Breer), p. 415. Stuttgart, New York: Thieme Verlag.
PETZOLD, J. AND LABHART, T. (1993). Polarization-opponent
interneurons of crickets: absolute threshold, visual field properties and response to low degrees of polarization. In Proceedings of the
Neurobiology Conference Göttingen 21 (ed. N. Elsner and M.
Heisenberg), p. 371. Stuttgart, New York: Thieme Verlag.
PETZOLD, J. AND LABHART, T. (1994). Modelling
polarization-opponent interneurons of insects: responses to the polarization pattern of the sky. In Proceedings of the Neurobiology Conference
Göttingen 22 (ed. N. Elsner and H. Breer), p. 366. Stuttgart, New
York: Thieme Verlag.
ROSSEL, S. AND WEHNER, R. (1984). How bees analyse the
polarization patterns in the sky. J. comp. Physiol. A 154, 607–615.
ROSSEL, S. AND WEHNER, R. (1986). Polarization vision in bees.
Nature 323, 128–131.
ROST, R. ANDHONEGGER, H. W. (1987). The timing of premating and mating behaviour in a field population of the cricket Gryllus
campestris. Behav. Ecol. Sociobiol. 21, 279–289.
VON FRISCH, K. (1965). Tanzsprache und Orientierung der Bienen.
Berlin, Heidelberg, New York: Springer Verlag.
VON HELVERSEN, O. AND EDRICH, W. (1974). Der
Polarisationsempfänger im Bienenauge: ein Ultraviolettrezeptor. J.
comp. Physiol. 94, 33–47.
WEHNER, R. (1994). The polarization-vision project: championing
organismic biology. In Neural Basis of Behavioural Adaptations (ed. K. Schildberger and N. Elsner), pp. 103–143. Stuttgart, Jena, New York: Gustav Fischer Verlag.
ZUFALL, F., SCHMITT, M. AND MENZEL, R. (1989). Spectral and