J. exp. Biol. 137, 529-548 (1988) ' 5 2 9 'Printed in Great Britain © The Company of Biologists Limited 1988
EFFECT OF TEMPERATURE UPON CARBON DIOXIDE
STORES IN THE SNAKE COLUBER CONSTRICTOR AND
THE TURTLE CHRYSEMYS SCRIPTA
BY JERRY N. STINNER AND ROBERT L. WARDLE
The University of Akron, Department of Biology, Akron, Ohio 44325, USA
Accepted 25 January 1988
Summary
The effect of temperature upon respiratory exchange ratio (R) was measured in snakes (Coluber constrictor) and turtles (Chrysemys scripta). Increasing body temperature produced a transient elevation of R, and lowering body temperature transiently depressed R. These thermal effects resulted from an 'excess' and a 'deficit' CO2 elimination, respectively. Steady-state blood CO2 content (CCO2) in
C. constrictor decreased linearly with rising temperature. Plasma bicarbonate
concentration, calculated from in vivo arterial Pco2 a nd pH, followed the same
pattern. Also, time courses of blood CCo2 were consistent with the metabolic
studies. Less than half of the change in blood CCOl could be explained by shifts of
the in vitro CO2 dissociation curve; the remainder was contributed by other tissues. Blood lactate levels changed little with temperature. Based upon the blood studies, the predicted quantity of CO2 eliminated from the extracellular space when temperature increases is about 29 % of the excess CO2 eliminated
from the snakes. Thus, Cc o, in other tissues also decreases with rising
tempera-ture. It is concluded that reptiles function as open systems with respect to CC O l,
which does not agree with alphastat control. Systemic arterial Po, and Pc o,
increased with rising body temperature in C. constrictor. The mechanisms producing these increases are discussed.
Introduction
Beginning largely with the work by Robin (1962) on the turtle Pseudemys scripta (now Chrysemys scripta), investigators have found that in vivo plasma p H varies inversely with body temperature in ectotherms (see reviews by Reeves, 1977; Heisler, 1986). The actual change in p H varies considerably among species. For
example, over a wide temperature range p H changes by —0-005 units°C~j in the
lizard Varanus exanthematicus (Wood, Johansen, Glass & Hoyt, 1981) but in the
turtle Chelydra serpentina p H changes by about —0-016units°C~1 (Howell,
Baumgardner, Bondi & Rahn, 1970). In addition, the thermal dependence of plasma p H is not linear in many species; typically p H changes less at lower
temperatures (Robin, 1962; Kraus & Jackson, 1980; Ackerman & White, 1980; Nolan & Frankel, 1982; Heisler, 1984; Glass, Boutilier & Heisler, 1985).
In air-breathing ectotherms, declining plasma pH is achieved primarily by reducing ventilation relative to CO2 production so that PCo2 varies directly with temperature. Most investigators report little or no change in plasma bicarbonate concentration (see Jackson, 1978; Heisler, 1986). Since bicarbonate represents about 95 % of the total plasma CO2 content (CCo2) it appears that CCo2 is als o n t tle affected by temperature. This apparently stable CCo2 is a central tenet of the widely cited alphastat hypothesis (Reeves, 1972). Reeves proposed that protein imidazole groups are by far the most important buffer of CO2 in the extracellular fluid. Consequently, assuming there are no changes in fixed acids, a constant CCo2 implies the maintenance of a constant net protein charge (termed alpha). He later extended the alphastat hypothesis to intracellular fluid and argued that a constant alpha is biologically important for maintaining enzyme activity, buffer properties and Donnan equilibria across cell membranes (Reeves, 1976b; Malan, Wilson & Reeves, 1976).
More recent work, particularly by Heisler and his coworkers (see Heisler, 1986; Boutilier, Glass & Heisler, 1987), clearly shows that the temperature-dependence of pH in most ectotherm tissues cannot be explained by the alphastat hypothesis. In addition, the use of improper pK^ values to calculate plasma bicarbonate concentration has contributed to the view that CCO2 is little affected by tempera-ture. As recognized by Nolan & Frankel (1982) and by Nicol, Glass & Heisler (1983) the frequently used equation developed by Reeves (1976a) for estimating pK^ does not correct for pH. Consequently, the rise in plasma pH in vivo as body temperature falls in ectotherms is not accounted for and the predicted pK'j is too high. This error has a large effect upon calculated bicarbonate concentration because of the exponential relationship between pKj and bicarbonate concen-tration (see Table IV of Howell & Rahn, 1976).
Carbon dioxide stores in reptiles 531
for his results. These findings, like those of Kayser, strongly suggest that blood Cco2 a nd whole-body CO2 stores are dependent upon temperature in at least some air-breathing ectotherms.
In the light of these two opposing views concerning CCo2> the following study was undertaken primarily to investigate the relationships between body tempera-ture, whole-body CO2 stores and blood CCo2- We measured arterial CCO2, Pco2> lactate concentration and plasma pH as well as PQ2 over a wide temperature range in resting snakes (Coluber constrictor) ranging in size from 104 to 336 g. These results are compared with the effects of changing temperature upon R and upon blood CCo2 in vitro. Additional measurements of R were made in turtles,
Chrysemys scripta, weighing about 1-85 kg.
Materials and methods
Animals
Black racers (Coluber constrictor) and pond sliders (Chrysemys scripta) were purchased from commercial suppliers and flown to Ohio. Subsequently they were kept in cages provided with light sources that produced basking sites of about 35 °C. Racers were fed mice and small rats weekly and water was available at all times. The turtles were fed canned dog food and lettuce each week and had access to a 250-1 water tank. All animals used in this study appeared in excellent health. Food was withheld for 1 week prior to experimentation.
Respiratory exchange ratio
The effects of temperature upon O2 consumption (Vo,) and CO2 production (VcoO were determined in a closed-circuit apparatus. Snakes were placed individually in 2-1 flasks that were housed in darkened cabinets in which temperature could be regulated to within ± 0-7°C. The same set-up was used for the turtles except that the metabolism chamber measured 91. A pump outside the cabinet recirculated air at about SOOmlmin"1 through the metabolism chamber, incurrent and excurrent air lines, a water absorbant (Drierite), and O2 and CO2 analysers (Applied Electrochemistry S-3A and CD-3A). A Mylar balloon in the excurrent air-line prevented pressure changes that would have resulted from changing the temperature of the closed-circuit system. Oxygen uptake was calculated from the equation:
VO2 = (V - Vw) (Fj - Fe)/[1 - Fe(l - R ) ] , (1)
where V and Vw are the volumes of gas and water vapour in the chamber at the beginning of an experimental period, Fj and Fe are the fractions of oxygen in the chamber at the beginning (i) and end (e) of an experimental period, and R is Ithe respiratory exchange ratio. The term [1 — Fe(l — R)] corrects for differences
1987). Vc o, was calculated from the product of R and VO v Metabolic rates are reported in jitlsTPDg"1!!"1.
Metabolic rate was measured in each snake or turtle over a 3-week period. During this time an animal was kept at 30°C for the first few days, then body temperature was lowered to near 5°C where it remained for 1-2 weeks. Subsequently body temperature was returned to 30 °C and measurements were continued for a few more days. Body temperature was monitored by means of a radiotransmitter (Mini-mitter Corp.) that had been force-fed to each animal prior to the metabolic studies. The metabolism chamber was periodically flushed with room air so that O2 did not fall below 19 % and CO2 did not rise above 1 %.
During the 3-week study period the animals were left undisturbed and were not given food or water. They lost approximately 10% of their initial body mass, presumably due mostly to evaporative water loss, but appeared in excellent condition at the end of the study.
Blood studies
Po2, Pco2, PH and [HCO3~]
For surgery snakes were chilled in crushed ice, and lidocaine (2 %) was injected at the site of incision. A PE10 cannula filled with heparinized saline (1000 units ml"1) was tied occlusively into a branch of the dorsal aorta near the cloaca. The cannulae were inserted through a small (approx. 1 cm) ventral incision and passed to the exterior on the dorsal surface of the tail. Snakes were then allowed to recover for about 1 week at 30 °C. During this time water was available but the snakes were not fed. Following recovery, 13 snakes were taped to sticks and placed inside temperature cabinets (for details see Stinner, 1987a). The trailing ends of the cannulae were left outside the cabinets so that blood could be sampled without disturbing the snakes. An additional seven cannulated snakes were left unrestrained inside temperature cabinets and were picked up at the time of blood sampling. Each snake was tested at 2-3 temperatures and usually 24 h (minimum of 10 h) was allowed for thermal equilibration.
Carbon dioxide stores in reptiles 533
Lactate and CO2 content
Snakes were cannulated as described above and allowed to recover for 1-3 weeks inside cages provided with heat lamps. Water was available at all times and the snakes were occasionally fed mice. Subsequently the snakes were placed inside individual plastic containers. To prevent movement of the cannulae, a relatively small amount of restraint was employed by taping an 8 cm section of the snake near its tail to the container floor. The container and snake were placed inside a darkened temperature cabinet and blood (approx. 300^1) was sampled from undisturbed snakes as described above.
Cco2 was immediately determined manometrically on a 30-/il sample of blood using a Natelson microgasometer (Rolant, 1969). For lactate measurements, a 200-jtd sample of blood was immediately deproteinized by adding 400/^1 of an 8 % perchloric acid solution. The supernatant was then stored for not more than 1 week at 2-3°C before analysis with an enzymatic test kit (Sigma no. 826) and Coleman Jr II Model 6/20 spectrophotometer.
Lactate concentration and CCO2 were measured in 12 snakes and each snake was tested at 2-3 temperatures. Before sampling blood at each temperature, sufficient time was allowed for completion of transients in R caused by changing body temperature (see below). This meant that snakes were at 5°C for 4-5 days and at higher temperatures (13-36°C) for 2-3 days before measurements were made.
In addition to steady-state measurements, we examined the time course of CCo2 changes. In four snakes, serial blood samples were taken when body temperature was lowered from 30 to 5°C and then returned to 30 °C. The experimental set-up was like that used for the lactate and CO2 studies except that body temperature was monitored using a temperature probe (Yellow Springs Instrument Co.) inserted into the cloaca. Twenty-five 50-^al blood samples were taken from each snake over 5 days. The blood samples were immediately analysed for CCo, using the Natelson microgasometer.
All blood sampling was done between 07.00 and 20.00h local time. At the completion of these experiments the snakes appeared in good health and generally began feeding within a few days to 1 month. The tape and cannulae were removed when the snakes shed their skins and many of the snakes were later released.
In vitro blood studies
vivo PCo2 m C. constrictor. After an equilibration period of at least 20min, mean blood Cco2 f °r e a c n flask w a s determined from 2-3 measurements using the Natelson microgasometer. In addition, blood in the equilibrated tonometers was drawn into capillary tubes that were then sealed and spun for 5min in a microcapillary centrifuge (International Equipment Co.). Haematocrit and plasma Cco2 were measured. We then calculated Ceo? °f the red blood cells from the relationship:
CCO2,B
— Fc x C
Co
2,c + F
Px Cco
2,p , (2)
where the subscripts B, C and P refer to blood, red blood cells and plasma, and F is fractional volume.
Results Metabolism
Minimal rates of VQ2 for the four snakes at 5 and 30-5 °C were 4-1 ±0-8
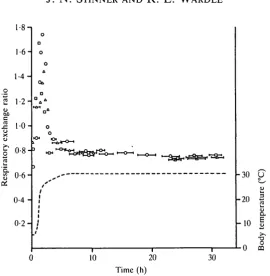
( X ± S . D . ) and 57-5 ± 13-5 jitlsTPDg"^"1 (x mass = 291 g, range 238-336g). Mean±s.D. for R during steady-state conditions was 0-75 ±0-06 at 5°C and 0-75 ± 0-02 at 30-5°C. Lowering temperature in C. constrictor produced a marked decrease in R (Fig. 1). R fell to between 0-15 and 0-36 in the first few hours during which temperature was falling, then gradually increased back to steady state by about 60 h. Elevating body temperature from 5 to 30-5°C produced a rapid two- to three-fold increase in R (Fig. 2). Within about 6h R had fallen back to below 0-8 and by about 24 h it reached steady-state values near 0-75. These large changes in R suggest that total body CO2 stores are higher at lower temperatures. In the four snakes, the average change in CO2 stores, ± S . D . , predicted from the transients in R is 4-50 ± 1-72 mmol kg"1. This value represents the difference between the animal's actual CO2 elimination and the CO2 elimination that would have occurred if R had remained at steady state (i.e. 0-75) when temperature was changed. The calculated change in CO2 stores was dependent upon the absolute change in temperature (J. N. Stinner & R. L. Wardle, unpublished results) but was unaffected by the direction of the temperature change.
R followed the same general pattern in the turtles (Figs 3, 4). The change in CO2 stores predicted by the transients in expired CO2 is 2-81 ± 0-94mmolkg~1.
Blood studies
Total CCo2 °f whole blood in 16 snakes was inversely related to body temperature (Fig..5). From 5 to 35°C, CCO2 fell by more than 30 %. Least-squares regression analysis yields CCO2 = 22-9 - 0-230TB (P < 0-01, N = 16, x mass = 167 g, range 128-226 g), where CCo2 is in mmoll"1 and TB is in °C. The large decrease in CCo2 cannot be explained by the amount of hydrogen ions equivalent to changes in lactate concentration. From 15 to 35°C there was a relatively smal
1
18 -i -3 0 -2 0 -1 0 -0
atui tempei Body
Cart
o 3 a.5
'
l-8-i
1-6-
1-4-
1-2-
1-0-0-8
0-6-
0-4-
0-2--30 U
-20 3
-10
10 20 Time (h)
[image:8.595.165.436.142.419.2]30
Fig. 2. Effect of raising body temperature from about 5 to 30°C upon the respiratory exchange ratio of three Coluber constrictor. Symbols as in Fig. 1.
yields [lactate] = 0-18 ±0-0377TB (P<0-05, N=12, x mass = 162g, range 128-202 g), where [lactate] is in mmoll"1. Near 5°C, lactate concentration appears to be higher and exhibits considerably more scatter. Mean±s.D. for lactate concentration in C. constrictor at 1-7°C is 2-60 ± 1-68mmoll"1.
Time course of CCo2 change
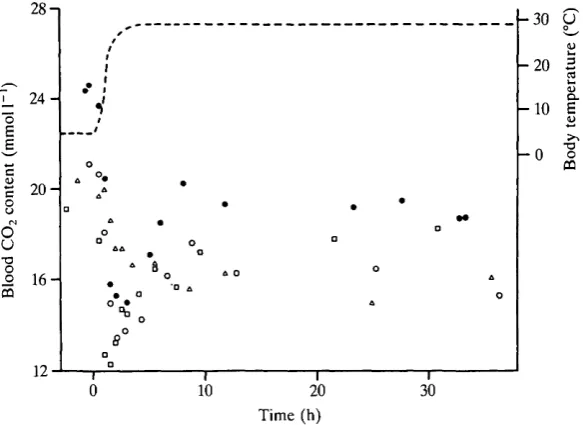
Lowering the body temperature of the snakes from 30 to 5°C produced a gradual rise in blood Ceo, (Fig- 7). Initially this increase was relatively rapid and corresponded to the time of falling temperature (approx. 3 h). Subsequently, when body temperature was low, there appeared to be a monoexponential rise in Cco2 until steady state was reached at about 45-50 h. Elevating body temperature from 5 to 30°C produced a very rapid decrease in Cco2 (Fig- 8). In three snakes, Cco2 fell to about 63 % of its initial value and then increased to steady-state values. This 'overshoot' was not evident in the fourth snake in which CCo2 appears to have decreased in a simple exponential fashion. Approximately 7h was required to reach steady state in the four snakes.
In vitro CCo, and lactate
l-8-i -3 0 U 16 0
o Si en
222 0
-
1-
1-6-S
1-4-00
c
"6
1-2-u
I
1-0-'5.
I
0-8-
0-6-
040 2
-m o
-30
-20
-10
- 0
ratur
e
<u
Q .
E
<u
>,
TJ O CO
0 10 20 30
Time (h)
Fig. 4. Effect of elevating body temperature from 5 to 30°C upon the respiratory exchange ratio of two Chrysemys scripta. Symbols as in Fig. 3.
temperature was significant (P<0-01, paired Mest) but is considerably less than the 4 - 6 m m o i r1 decrease that occurs in vivo. Lactate concentration was signifi-cantly lower (P<0-05, paired Mest) at 15°C than at 35°C, averaging 1-44±0-19 and 3-20 ± 0-74mmoll~1, respectively. In 10 blood samples (five at 15°C and five at 35°C) the ratio Cco2>c/Cco2,p averaged 0-57 ±0-14 and was not significantly different at the two temperatures ( P > O 0 5 , paired Mest).
Po2, Pco2> pH and bicarbonate concentration
Carbon dioxide stores in reptiles
539
25-o
i
20"
1 5
-0 1-0 2-0 3-0 Body temperature (°C)
Fig. 5. Thermal dependence of steady-state blood CO2 content in 16 Coluber
constrictor. Snakes remained at temperatures near 5°C for 4-5 days and at higher
temperatures for 2-3 days before measurements were made.
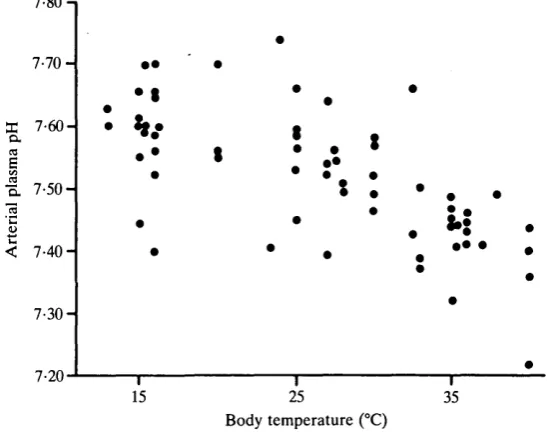
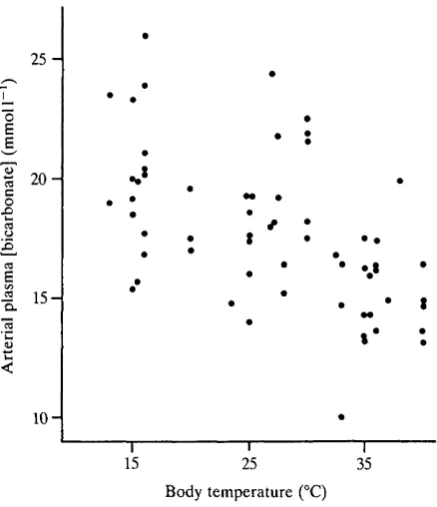
0-0085 units "Cr1. As with Pco2> there was no significant difference between pH in taped and handled snakes (ANCOVAR). The quadratic polynomial expression for the combined data is pH = 7-508 + 0-0115TB-0-00038TB2 (P<0-01). Plasma bicarbonate concentration was linearly affected by temperature from about 2 2 m m o i r1 at 15°C to about 16mmoirJ at 40°C (Fig. 11). Linear regression yields bicarbonate concentration (mmoir1) = 25-0-0-224TB (P<0-01). Thus
6
-o
1 4
2
-15 25 Body temperature (°C)
35
both declining bicarbonate concentration and rising PCO2 produce the negative temperature dependence of plasma pH.
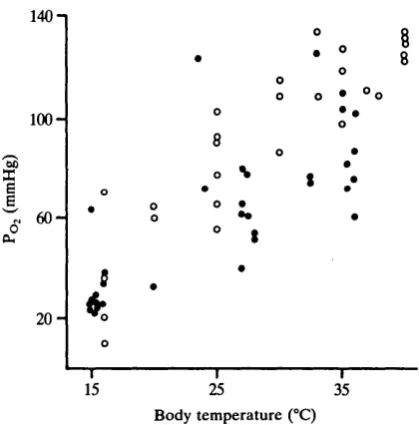
Systemic arterial PO2 was markedly affected by temperature in snakes (Fig. 12). In undisturbed (taped) snakes PO2 nearly tripled when temperature was increased by 20°C, rising from roughly 32 mmHg at 15°C to 89 mmHg at 35°C. Least-squares
28 -i
o 24 E
a 20
8
d
u
o 16 •
o
5
12
-20 2
HO
- 0
o o
10 20 30 40
Time (h)
[image:12.595.98.505.245.440.2]50 60 70
Fig. 7. Response of blood CO2 concentration to lowering body temperature from
about 30 to 5°C in four Coluber constrictor. Each animal is represented by a different symbol. Body temperature (dashed line) was monitored by means of a temperature probe inserted into the cloaca.
28 -i
2 4
-S 2 0
-- 3 0 U
- 2 0 2
- 1 0 E
30
Time (h)
[image:12.595.154.446.506.718.2]Carbon dioxide stores in reptiles
541
regression analysis yields Po, = 2-87TB- 11-33 (P<0-01, N=ll, x mass = 156g, range 115-200g). Unlike PCO2 and pH, PO2 was significantly affected by handling the snakes (P< 0-001, ANCOVAR). Linear regression of data from handled snakes between 15 and 35°C yields FOl = 4-39TB - 30-31 (P<0-01, TV = 7, x mass = 168g, range = 104-260g). Thus, although disturbing the snakes at 15°C
4 0
-0
B 2 0
1 0
-«.
' • * .
15 25 35
[image:13.595.160.403.247.457.2]Body temperature (°C)
Fig. 9. Temperature-dependence of arterial CO2 tension in 20 Coluber constrictor.
X
Q. 7-80 n
7-70-
7-60-o.
7-50-< 7-40'
7-30-
7-20-15 25
1
35
Body temperature (°C)
[image:13.595.159.435.503.721.2]2 5
-| 20 H
o
4
15-
10-15 25
Body temperature (°C) I
[image:14.595.192.411.166.420.2]35
Fig. 11. Temperature-dependence of arterial plasma bicarbonate concentration in 20
Coluber constrictor. Bicarbonate concentration was calculated from simultaneously
measured in vivo CO2 tension (Fig. 9) and pH (Fig. 10). Solubility coefficients used were those of Severinghaus (1965) and pK'i values were those of Siggaard-Andersen (1974).
had little effect upon PO i, predicted Po, at 35 °C was 34mmHg higher in the handled snakes.
Discussion
The rise in Pc o, (Fig. 9) and fall in plasma pH (Fig. 10) that occurs in C.
constrictor is a now familiar response of reptiles and amphibians to rising body
Carbon dioxide stores in reptiles
54300
X B
o
OH
140-1
1006 0
-
20-o o o o
8 o \
o • o
t •
15 25
[image:15.595.193.403.164.377.2]Body temperature (°C) 35
Fig. 12. Response of arterial O2 tension to changing body temperature in 11 undisturbed Coluber constrictor (•) and in seven handled Coluber constrictor (O). Note the large increase in O2 tension caused by disturbing snakes at temperatures of 25-36°C.
One mechanism partly responsible for changing CCo> a t least in C. constrictor, is thermally induced shifts of the blood CO2 dissociation curve. When in vitro blood samples at physiological Pc o, were warmed by 20°C, Cc o, fell by roughly 2-0mmol I"1. Since blood Ceo, in VIVO falls by about 4-6 mmol I"1 when the snakes are warmed by 20°C, it is apparent that shifting the CO2 dissociation curve is responsible for approximately 43 % of the total in vivo blood CCo, change. The remaining 57 % is presumably due to exchange between extracellular fluid and other tissues (e.g. skeletal muscle). It has also been reported that in blood from tortoises (T. graeca) and frogs (R. temporaria) Cc o, falls by about 0-5 mmol 1~' per °C rise in temperature (Kayser, 1940), which is about five times higher than that in C. constrictor blood. The higher value probably results from the use of the same equilibration gas (PCo, ~ 45 mmHg) at the different temperatures.
Elevating C. constrictor's body temperature by 25°C results in about 4-50 mmol CO2 kg~' being eliminated in excess of that predicted from an R of 0-75, although blood Ceo, in vivo falls by 5-75 mmol I"1. The following calculations show that the estimated change in CCo2 of extracellular fluid and red blood cells is not great enough to account for the excess CO2 elimination. Interstitial CCo, is close to that of plasma Ceo,- I" blood taken from C. constrictor, the Ceo, of red blood cells (CCo2,c) averaged 57% of that in plasma (Cco,,p), which agrees closely with Jesuits from oxygenated human blood (see fig. 4 of Van Slyke & Sendroy, 1928). Py substituting 0-57CCo,.p for Cco,.c m equation 2, plasma Ceo, c a n be calculated
if blood Cco2 (CCO2,B)
a r |d haematocrit (100 x F
C. constrictor haematocrit is about 23 % (Stinner, 1987a) and predicted CCO,.B is 21-75 mmol I"1 at 5°C and 16-0 mmol I"1 at 30°C. Thus, plasma (and interstitial fluid) CCo2 equals M 1 X CCO2. B SO that at 5 and 30°C, CCO2 is 244 and 17-8 mmol I"1, respectively. Assuming that the interstitial fluid volume represents 15 % of the body mass and blood volume is 6 % of the body mass, then warming a 1-kg snake from 5 to 30°C should produce an excess CO2 elimination of 0-945 mmol from the interstitium and 0-345 mmol from the blood. Thus, less than one-third (29 %) of the 4-50 mmol comes from the extracellular fluid and red blood cells. Obviously, CCO2 of other tissues is inversely affected by temperature. Despite the large effect of temperature upon Cc o, of tortoise and frog blood in
vitro obtained by Kayser (1940), he also concluded that CCo2 of other tissues must be inversely proportional to body temperature.
CCo2 changes in tissues other than blood could explain why R does not appear to be at steady state although blood Ceo, is constant. When C. constrictor's body temperature was reduced from 30 to 5°C approximately the same amount of time was required to reach steady-state R and blood Ceo, values (compare Figs 1 and 7). The gradual rise in CCo, and R may be limited by the low metabolic rate and hence slow accumulation of CO2 at 5°C. Alternatively, the rise in CO2 could be limited by transmembrane bicarbonate transfer processes, i.e. ion pumps. When temperature was increased back to 30°C, blood Cco2 achieved steady state in about 7h (Fig. 8). However, R did not appear to reach steady state until approximately 24 h (Fig. 2). This time difference may reflect continued CO2 elimination from intracellular fluid.
As discussed in the Introduction many investigators have concluded that blood Cc o, is relatively unaffected by temperature in reptiles and amphibians. We believe that at least four factors have contributed to this view. The first is the use of incorrect pKi values to calculate plasma bicarbonate concentration from the Henderson-Hasselbalch equation (see Introduction). Plasma pK^ values have not been determined for C. constrictor but, in a study of Chrysemys picta, Nicol et al. (1983) found close agreement between their measured pK] values and those predicted by the equation of Siggaard-Andersen (1974). Use of this equation to estimate bicarbonate concentration in C. constrictor yields values that agree well with directly measured Ceo. (compare Figs 5 and 11). The regression equations for bicarbonate concentration and Ccc,2 demonstrate about the same thermal depen-dence (0-224 and 0-230, respectively) and predicted plasma bicarbonate concen-tration is about 2-2 mmol 1~' higher than whole-blood Ceo,- The lower blood CCo, is expected because of the much lower CCo, in red blood cells compared with plasma (Southworth & Redfield, 1925; Van Slyke & Sendroy, 1928). In C.
constrictor blood the plasma CCo ,w a s found to be 1-11 x CCO,,B (see above). Since predicted CCO2.B is 19-5 mmolP
Carbon dioxide stores in reptiles 545
A second factor that can affect the outcome of Cc o, measurements is the wide variation in CCo, normally encountered among different individuals kept at the same temperature (Fig. 5). Thermal effects can easily be obscured by individual differences if Ceo, is not investigated over a wide temperature range (for example 20°C) in the same animal. Third, it is obvious from Figs 7 and 8 that to make an accurate estimate of the influence of temperature upon CCo, sufficient time must be allowed for reaching steady-state conditions. A fourth factor that can influence Cc o, measurements is struggling by the experimental animals. However, this problem might be especially significant at higher body temperatures. The result would be elevated lactate and reduced bicarbonate concentrations. Hence the thermal dependence of blood CCo, would be overestimated. This may be responsible for the larger changes in blood CCo2 obtained by Kayser (1940) (see Introduction) since blood was collected by heart puncture. Anaerobic metabolism does not appear to be elevated in our study because lactate values are well within those reported for resting reptiles (Bennett & Dawson, 1976).
Systemic arterial Po, in C. constrictor rises sharply with increasing body temperature (Fig. 12). The rise in Po, is due to a rightward shift of the O2 dissociation curve in the presence of a right-to-left intracardiac shunt (Wood, 1984; Wood & Hicks, 1985; Stinner, 1987/?; Boutilier et al. 1987). The displacement of the O2 dissociation curve is a direct effect of rising temperature as well as increasing H+ concentration and Pc o, (Bohr effect). It is evident from Fig. 12 that Po2 also increases when the snakes are disturbed by handling. This increase is probably due to a rightward shift of the O2 dissociation curve caused by some metabolic acidosis (J. N. Stinner & R. L. Wardle, unpublished results). However, the decrease in pH is relatively small; pH values in the handled snakes are not significantly different from those in the undisturbed snakes.
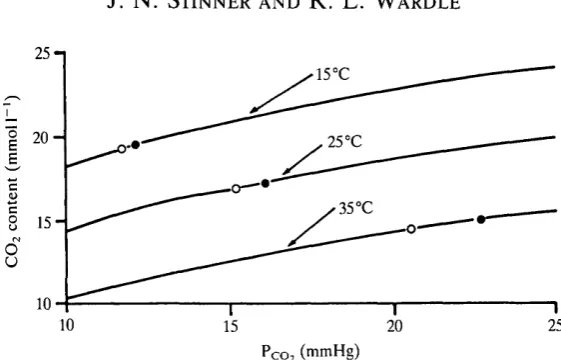
The rise in arterial Pc o, with temperature in C. constrictor (Fig. 9) is not caused by the same mechanism as that for Po2. Because of the greater slope of the CO2 dissociation curve compared with the O2 dissociation curve within the physiologi-cal range of gas tensions, even a relatively large intracardiac shunt does not appreciably affect systemic arterial Pco,- Fig. 13 illustrates this point. The three CO2 dissociation curves were constructed using the formulae given by Weinstein, Ackerman & White (1986) in a study of Chrysemys blood at 15, 25 and 35 °C. Haematocrit, and presumably haemoglobin concentration, are similar in
Chry-semys scripta and Coluber constrictor. Hence their non-bicarbonate blood
buffer-ing is quantitatively similar. Consequently, if allowance is made for differences in blood CCo^ then CO2 dissociation curves in the two species should be comparable. Based upon this reasoning, adjustments were made for the lower CCo, in C.
constrictor by substituting the appropriate in vivo Pco2 a nd steady-state Ceo, values into the formulae of Weinstein et al. (1986) and then solving for the intercepts. Also shown in Fig. 13 are pulmonary venous and systemic arterial values. The pulmonary venous points were estimated using the arterial — venous
f)2 content differences measured in C. constrictor (Stinner, 1987a), an R of 0-75,
25-1
§ 20 E
§ 15'
d
u
10 15 20 25I
[image:18.595.157.438.153.333.2]PCo2 (mmHg)
Fig. 13. Effect of shifting the CO2 dissociation curve in the presence of a right-to-left intracardiac shunt upon the systemic arterial-pulmonary venous Pco, difference. Systemic arterial points are represented by filled circles and pulmonary venous points are designated by unfilled circles. Note that the Pc o, differences are about 0-5 mmHg at 15°C, 1-0 mmHg at 25°C and 2-0mmHg at 35°C. See text for further explanation.
can be seen that this relatively large shunt has little effect upon arterial Pco,- At 15 °C systemic arterial PCO2 is only about 0-5 mmHg higher than in pulmonary venous blood and at 35°C there is a roughly 2-0mmHg difference. Thus, the rightward displacement of the CO2 dissociation curve in the presence of the shunt produced a 1-5 mmHg rise in Pco- This is less than 15 % of the total increase in PCo2 that occurs when C. constrictor is warmed from 15 to 35 °C. Systemic arterial PCo2 is therefore determined primarily by lung ventilation, and CCo2 is dependent upon the PCo2 a nd the position of the CO2 dissociation curve. In contrast, systemic arterial Po, is dependent upon the arterial O2 content (which is a function of the shunt) and the position of the O2 dissociation curve (Wood, 1984).
The primary goal of this study was to examine the thermal dependence of total body CO2 stores in reptiles. In agreement with earlier work, notably by Kayser (1940), we found that CO2 stores vary inversely with temperature in a snake (C.
constrictor) and a turtle (C. scripta). In the snakes about 10% of the change in
Carbon dioxide stores in reptiles 547
to maintain a constant CCO2 in the face of changing body temperature. Our findings support the view that the alphastat hypothesis does not explain acid-base regulation in these animals.
References
ACKERMAN, R. A. & WHITE, F. N. (1980). The effects of temperature on acid-base balance and ventilation of the marine iguana. Respir. Physiol. 39, 133-147.
BENNETT, A. F..& DAWSON, W. R. (1976). Metabolism. In Biology of the Reptilia, vol. 5 (ed. C. Gans & W. R. Dawson), pp. 127-223. New York, London: Academic Press.
BICKLER, P. E. (1981). Effects of temperature on acid-base balance and ventilation in desert iguanas. /. appl. Physiol. 51, 452-460.
BOUTILIER, R. G., GLASS, M. L. & HEISLER, N. (1987). Blood gases, and extracellular/ intracellular acid-base status as a function of temperature in the anuran amphibians Xenopus
laevis and Bufo marinus. J. exp. Biol. 130, 13-25.
BOUTILIER, R. G., HEMING, T. A. & IWAMA, G. K. (1984). Appendix: Physicochemical
parameters for use in fish respiratory physiology. In Fish Physiology (ed. W. S. Hoar & D. J. Randall), pp. 403-430. New York, London: Academic Press.
DONTCHEFF, L. & KAYSER, C. (1937). Les effets des variations de la temperature ambiante sur le quotient respiratoire et le reserve alcaline de la tortue. C. r. hebd. Seanc. Soc. Biol. 124, 364-366.
GLASS, M. L., BOUTILIER, R. G. & HEISLER, N. (1985). Effects of body temperature on respiration, blood gases and acid-base status in the turtle Chrysemys picta bellii. J. exp. Biol.
114, 37-51.
HEISLER, N. (1984). Role of ion transfer processes in acid-base regulation with temperature changes in fish. Am. J. Physiol. 246, R441-451.
HEISLER, N. (1986). Comparative aspects of acid-base regulation. In Acid-Base Regulation in
Animals (ed. N. Heisler), pp. 397-450. Amsterdam: Elsevier Biomedical Press.
HICKS, J. W., ISHIMATSU, A. & HEISLER, N. (1987). Oxygen and carbon dioxide transport characteristics of the blood of the Nile monitor lizard (Varanus niloticus). J. exp. Biol. 130, 27-38.
HOWELL, B. J., BAUMGARDNER, F. W., BONDI, K. & RAHN, H. (1970). Acid-base balance in
cold-blooded vertebrates as a function of body temperature. Am. J. Physiol. 218, 600-606. HOWELL, B. J. & RAHN, H. (1976). Regulation of acid-base balance in reptiles. In Biology of the
Reptilia, vol. 5 (ed. C. Gans & W. R. Dawson), pp. 335-363. New York, London: Academic
Press.
JACKSON, D. C. (1978). Respiratory control in air-breathing ectotherms. In Regulation of Ventilation and Gas Exchange (ed. D. G. Davies & C. D. Barnes), pp. 93-130. New York,
London: Academic Press.
KAYSER, C. (1940). Le quotient respiratoire chez quelques especes poikilothermes. Annls
Physiol. physicochim. Biol. 16, 1-68.
KINNEY, J. L., MATSUURA, D. T. & WHITE, F. N. (1977). Cardiorespiratory effects of temperature in the turtle, Pseudemys floridana. Respir. Physiol. 31, 309-325.
KRAUS, D. R. & JACKSON, D. C. (1980). Temperature effects on ventilation and acid-base balance of the green turtle. Am. J. Physiol. 239, R254-258.
MALAN, A., WILSON, T. L. & REEVES, R. B. (1976). Intracellular pH in cold-blooded vertebrates as a function of body temperature. Respir. Physiol. 28, 29-47.
NICOL, S. C , GLASS, M. L. & HEISLER, N. (1983). Comparison of directly determined and calculated plasma bicarbonate concentration in the turtle Chrysemys picta bellii at different temperatures. J. exp. Biol. 107, 521-525.
REEVES, R. B. (1976a). Temperature-induced changes in blood acid-base status: pH and Pco, in a binary buffer. J. appl. Physiol. 40, 752-761.
REEVES, R. B. (1976ft). Temperature-induced changes in blood acid-base status: Donnan rC| and red cell volume. J. appl. Physiol. 40, 762-767.
REEVES, R. B. (1977). The interaction of body temperature and acid-base balance in ectothermic vertebrates. A. Rev. Physiol. 39, 559-586.
ROBIN, E. D. (1962). Relationship between temperature and plasma pH and carbon dioxide tension in the turtle. Nature, Lond. 195, 249-251.
ROLANT, F. (1969). Improvements in blood gas analysis with the Natelson microgasometer.
Microchem. J. 14, 141-149.
SEVERINGHAUS, J. W. (1965). Blood gas concentrations. In Handbook of Physiology, section 3, vol. II (ed. W. O. Fenn & H. Rahn), p. 1475. Washington, D.C.: Am. Physiol. Soc. SIGGAARD-ANDERSEN, O. (1974). The Acid-Base Status of the Blood, 4th edn. Copenhagen:
Munksgaard.
SOUTHWORTH, F. C , JR & REDFIELD, A. C. (1925). The transport of gas by the blood of the turtle. J. gen. Physiol. 9, 387-403.
STINNER, J. N. (1982). Ventilation, gas exchange and blood gases in the snake, Pituophis
melanoleucus. Respir. Physiol. 47, 279-298.
STINNER, J. N. (1987a). Cardiovascular and metabolic responses to temperature in Coluber
constrictor. Am. J. Physiol. 253, R222-227.
STINNER, J. N. (1987ft). Thermal dependence of air convection requirement and blood gases in the snake Coluber constrictor. Am. Zool. 27, 41-47.
VAN SLYKE, D. D. & SENDROY, J., JR (1928). Studies of gas and electrolyte equilibria in blood. XV. Line charts for graphic calculations by the Henderson-Hasselbalch equation, and for calculating plasma carbon dioxide content from whole blood content. J. biol. Chem. 79, 781-798.
VLECK, D. (1987). Measurement of O2 consumption, CO2 production, and water vapor production in a closed system. J. appl. Physiol. 62, 2103-2107.
WEINSTEIN, Y., ACKERMAN, R. A. & WHITE, F. N. (1986). Influence of temperature on the CO2 dissociation curve of the turtle Pseudemys scripta. Respir. Physiol. 63, 53—63.
WOOD, S. C. (1984). Cardiovascular shunts and oxygen transport in lower vertebrates. Am. J.
Physiol. 247, R3-14.
WOOD, S. C. & HICKS, J. W. (1985). Oxygen homeostasis in vertebrates with cardiovascular shunts. In Alfred Benzon Symposium: Cardiovascular Shunts: Phylogenetic, Ontogenetic and
Clinical Aspects (ed. K. Johansen & W. Burggren), pp. 354-366. Copenhagen: Munksgaard.