AGE-DEPENDENT CHANGES IN VOLUME AND
HAEMOGLOBIN CONTENT OF ERYTHROCYTES IN THE
CARP (CYPRINUS CARPIO L.)
BY W. SPECKNER1, J. F. SCHINDLER2 AND C. ALBERS1
1
Institut fur Physiologie der Universitdt Regensburg and 2
Institut fur Anatomie der Universitdt Regensburg, 8400 Regensburg, Federal Republic of Germany
Accepted 24 August 1988
Summary
Carp erythrocytes were fractionated by angle-head centrifugation which yielded fractions with a linear increase in density. Haematological examinations revealed that the heavier red blood cells of carp had greater volumes (MCV), more haemoglobin (MCH) and higher haemoglobin concentrations (MCHC) than light ones. The same experiments with human red cell fractions yielded a decrease in MCV, constant MCH and an increase in MCHC. Haemoglobin content in individual erythrocytes was also determined by scanning stage absorbance cytophotometry to establish the frequency distribution of the cellular haemo-globin contents. In carp, the distribution was symmetrical with the means increasing with density. No such change with cell density was found in human erythrocytes.
Both carp and human erythrocytes incorporated [2-14C]glycine in vitro. After gel filtration, radioactivity was detected in carp, but not in human, haemoglobin fractions. 14C was found in all three haemoglobin fractions, obtained by isoelectric focusing, and was present in the haem and in the globin. [2-14C]glycine-labelled erythrocytes were reinjected into chronically cannulated carp and followed in vivo for several months. With time, the main peak of scintillation counts shifted from red cell fractions of low to high density.
This is considered as evidence that density and age of red cells in carp are positively correlated and that erythrocytes can synthesize haemoglobin while circulating in the peripheral blood.
Introduction
Carp (Cyprinus carpio L.) erythrocytes, like the red blood cells in all non-mammalian vertebrates, retain their nucleus and some cytoplasmic organelles while circulating in the peripheral blood (Yasuzumi & Higashizawa, 1955; Weinreb, 1963; Sekhon & Beams, 1969; Iuchi & Yamamoto, 1983). Whether
134 W. SPECKNER, J. F. SCHINDLER AND C. A L B E R S
these erythrocytes solely transport idle ballast at the expense of cell deformability and maximum load, and if they are still capable of synthesizing haemoglobin, are not yet known.
Fish erythrocytes appear in the peripheral blood at rather early stages of development (Haider, 1967; Yamamoto & Iuchi, 1976; Hardig, 1977; Kreutzmann & Jonas, 1978). Thus, normal fish blood usually contains a small proportion of immature red cells, easily identifiable from their circular rather than elliptical shape. In individuals that have previously suffered respiratory stress (i.e. hypoxia or bleeding), this population may be increased temporarily and with a latency of some days, whereas an increase in mature red cells in cyprinids seems to be unusual (Krzymowska et al. 1960; Zanjani et al. 1969; Chudzik & Houston, 1983; Schindler & de Vries, 1986). Intravascular differentiation into mature red cells involves changes in the shape, loss of various organelles, changes in the concentrations of bioactive substances, changes in physical properties and an accumulation of haemoglobin (Sekhon & Beams, 1969; Iuchi & Yamamoto, 1983; Lane & Tharp, 1980; Lane et al. 1982). Differentiation between mature and immature cells would be even more difficult if maturity were defined as the stage of terminated haemoglobin synthesis.
From the present paper it is clear that circulating carp erythrocytes continue to synthesize haemoglobin. This evidence is based on experiments using 14C-labelled glycine in vivo and in vitro and separating the erythrocytes by density fraction-ation.
Materials and methods Blood sampling
Genetically uniform carp (Cyprinus carpio, approx. 2000g) were obtained from a state-controlled hatchery and acclimatized for at least 4 weeks in a large, well-aerated tank (30001) supplied with running tap water at 180lh"1 at 14-16°C and with oxygen. Maintenance and surgical procedures for chronic cannulation of the dorsal aorta followed Hughes et al. (1983). Tricaine methane sulphonate (MS 222, Sandoz; 0-1 gl"1) served as anaesthetic during surgery. Blood was sampled from free-swimming specimens after a minimum of 3 days of recovery. Care was taken not to perturb the fish. To prevent coagulation, 150i.u. of sodium heparin (Vetren, Promonta, FRG) was added to 5 ml of blood. With less heparin, clotting of carp blood was not completely inhibited and the erythrocytes tended to aggregate.
To compare carp erythrocytes with non-nucleated mammalian erythrocytes, all tests, except for in vivo labelling, were also performed with human blood obtained from healthy volunteers.
Density centrifugation
physiological carp saline (PCS), using the method of Imamura (1979), and modified to give a total osmolarity of 280mosmoll~1 and pH7-9: PCS contains (in m m o i r1) : NaCl, 141-1; KC1, 1-43; CaCl2, 0-99; NaHCO3, 2-64; glucose, 6-16. Washing, suspending and diluting procedures were always carried out in the appropriate saline. Resuspended erythrocytes, adjusted to a haematocrit of approximately 0-8, were transferred to special, long narrow polypropylene tubes (length 90 mm, diameter 4 mm, volume 0-9 ml) using capillary syringes. Centrifu-gations were performed for 40min in a Sorvall RC2B-SS34 rotor (Du Pont, Wilmington, USA), either at 15°C and 20000g for carp red cells or at 25°C and 20 000g for human red cells. The columns of red cells were each separated into five or six equal parts by means of glass capillaries stuck to plastic syringes. The syringes were filled with the resuspension medium to give a haematocrit of about 0-4. In some experiments specimens were used some weeks after bleeding. These samples showed a typical light red zone at the top which represented very young red cells. This light red zone was removed and treated as a fraction on its own.
Estimation of density, MCV, MCH and MCHC
After separation, densities of fractionated red cells and nonfractionated red cells of the whole blood were measured by centrifuging parts of the fractions in density gradients composed of dimethyl phthalate and dibutyl phthalate at a ratio resulting in 10 steps of specific gravity between 1-0869 and 1-1278 (Danon & Marikovsky, 1964).
The haematocrit (Hct) was determined by means of a Heraeus Christ microfuge HC101 (Osterode, FRG). The haemoglobin concentration was determined by the haemoglobin-cyanide method (Betke & Savelsberg, 1950; van Kampen & Zijlstra, 1961) using an Eppendorf photometer 1101M (Hamburg, FRG). The red cell count (RBC in 10~121) was obtained by Coulter counter model D (Harpenden, Herts, UK).
From these data the following variables were calculated: mean corpuscular volume (MCV) = Hct/RBC (in fl = 10~15l); mean corpuscular haemoglobin content (MCH) = haemoglobin concentration/RBC (in pg red blood cell"1); mean corpuscular haemoglobin concentration (MCHC) = haemoglobin concen-tration/Hct (in g I"1 red blood cells).
Scanning stage absorbance cytophotometry
136 W. SPECKNER, J. F. SCHINDLER AND C. A L B E R S
Afterwards, the suspensions were centrifuged and the pellets resuspended in 20 ml of 0-5 mmol I"1 phosphate buffer (pH7-5). Washing was repeated four times. The suspensions of fixed erythrocytes were stored at —80°C.
Preparations were made by spraying the thawed samples with an atomizer onto slides immediately followed by drying in a stream of compressed air. About 100 single cells of each fraction were measured and the results plotted as a frequency distribution. In scanning cytophotometry of individual cells, the integrated absorbance value (the sum of local absorbance values after subtraction of the mean background value) was recorded, together with the number of object points. The integrated absorbance of fixed cells at 411 nm (Soret band of methaemoglo-bin) represents physically the amount of haemoglobin within the cells and, for convenience, is given in arbitrary units (AU).
Isotope labelling and measurements of l4C-radioactivity
For examination of the fate of [2-14C]glycine-labelled erythrocytes in vivo, blood samples of 20 ml were taken from six carp. After removal of the plasma and washing twice, the red cells were incubated in PSC, the suspensions being adjusted to the original haematocrit of each specimen, supplemented with 20/iCi of [2-14C]glycine (52 mmol I"1, Amersham, Braunschweig, FRG) at 18°C for 10 h in a shaking water bath. Afterwards, the cells were washed three times, resuspended in the original plasma at 4°C and reinjected into the dorsal aorta.
In the course of 7 months, blood samples of about 5 ml were taken from each carp at irregular intervals. One of the six fishes died after 210 days. After density separation, radioactivity and cell counts were estimated in each fraction using a Tricarb liquid scintillation counter (Packard, Illinois, USA) and Coulter counter, respectively. Combustion in a Tricarb oxidizer preceded liquid scintillation counting. The radioactivity of each fraction was determined as counts per minute per 109 cells and expressed as a percentage of the total.
Red cells from human heparizined venous blood (10 ml) were washed and incubated in vitro with 5 //Ci of [2-14C]glycine in Ringer's solution enriched with 6 mmol I"1 glucose at 37°C for lOh. The erythrocytes were washed three times, resuspended in the original plasma (supplemented with heparin, 30i.u. ml"1) and erythrocyte fractions were examined 2 days after labelling.
Gel filtration technique, IEF, splitting of haem from globin
samples as described before. Gel filtration was carried out immediately after the labelling procedure in haemolysates of carp and man. In carp, gel filtration was also performed 35 days after reinjection of labelled cells.
Another part of the carp haemolysate was diluted with S m m o l F1 Tris-HCl buffer pH8-3, to give a final concentration of approx. 0-02gI"1 haemoglobin. To avoid autoxidation, this solution was flushed with carbon monoxide for lOmin. Thin-layer polyacrylamide gel electrofocusing (Drysdale et al. 1971; Albers et al. 1981; Albers, 1985) was done with commercially available Servalyt Precotes p H 5 - 8 , 125mmxl25mmxO-15mm, T5C3 (Serva, Heidelberg, FRG). With a distance between the anode and the cathode of 100 mm and electrode solutions of 40mmoll~a DL-glutamic acid (anode), O-lmoll^NaOH (cathode), sample papers containing 5/xl of pretreated haemolysate were placed 30 mm from the cathodal contact strip. Temperature was 4°C (Haake T52 thermostat), pre-focusing time was 1 h and sample running time was 6 h using an LKB 2117 Multiphor II electrophoresis unit (LKB, Grafelfing, FRG). An LKB 2103 power supply was set at a constant 1-5 W, maximum voltage of 2kV and maximum current of 8 mA. Detection was by staining with Coomassie Blue R-250 (Serva Blue-G); 14C radioactivity on the electropherogram was scanned with an Isomess (IsotopenmeBgerate, Straubenhardt, FRG) and autoradiography of the electro-pherogram was done with X-ray screen blue base film and Rontgenschnell-Kodak developer.
To test whether 14C was present in haem as well as in the protein fraction of haemoglobin, the following procedure was used. Part of the haemolysate of carp blood taken 35 days after labelling was dialysed against distilled water. After ultrafiltration, a 20:1 (v/v) excess of 0-2 mol I"1 HCl/acetone was added drop by drop at -20°C. The solution was kept at —20°C for lOmin with occasional stirring. The precipitate was washed in distilled water (Rossi Fanelli et al. 1958). The method of Lowry et al. (1951) was employed for determination of protein concentration in this solution. The filtrate was analysed by photometry at wavelengths from 400nm to 650nm using an LKB Ultra Spec 4050 (LKB, Grafelfing, FRG) to identify the chlorhaemin. 14C radioactivity was measured in both the globin and the haemin solution.
Statistical tests
Two-way analysis of variance including the F-test, the standard error of fraction means (S.E.M.), Fisher's least significant difference (LSD), and the multiple f-test (Holm, 1979) was used for all comparisons of fraction means (Sachs, 1984). The levels of significance calculated by algorithm 8.9 of Cooke et al. (1982) are shown in the tables. In addition, multiple regression (analysis of covariance) was calculated by standard procedures.
Results
Density, MCV, MCH and MCHC in red cell fractions
138
W. SPECKNER, J. F. SCHINDLER AND C. ALBERSB | C | D | E
1 2 3 4 5 6
109
f-Fig. 1. Average densities of erythrocytes in five equal-sized fractions (A-E; top-bottom) of carp blood (O, N=6) and in six equal-sized fractions (1-6; top-top-bottom) of human blood ( • , N=5). Lines (PB) indicate average densities of non-fractionated cells.
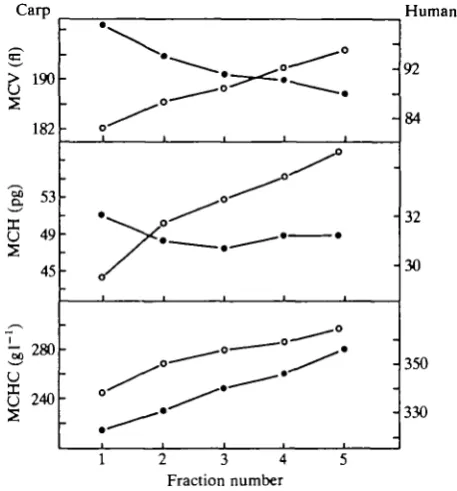
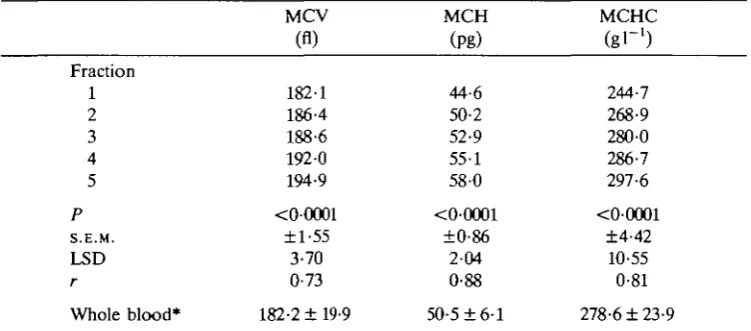
are shown in Fig. 1. The linear gradients obtained from both species indicate that the population of red cells consists of subpopulations with different specific gravity. The two-way analysis of variance yielded a standard error of fraction means of ±00012. The least significant difference for P<0-05 was 0-0027. All adjacent pairs of points in Fig. 1 are significantly different, except for fractions 3 and 4 in human red cells. Haematocrit and haemoglobin concentration in the resuspended fractions of erythrocytes provided arbitrary data only; the resulting quotients for MCV, MCH and MCHC were suitable for haematological character-ization. For carp, MCV, MCH and MCHC values in fractions increased from top to bottom, whereas in human erythrocyte fractions MCV decreased, MCHC increased and MCH remained constant from top to bottom (Fig. 2; Table 1). The mean values for whole blood of carp (A7 =45) are also given in Table 1. The correlations between density and the haematological parameters in Table 1 were highly significant. The result of the Holm test was identical with the least significant difference test for adjacent pairs.
Scanning stage absorbance cytophotometry
Carp Human
1 2 3 4 5
[image:7.451.110.339.77.323.2]Fraction number
Fig. 2. Comparison of mean corpuscular volume (MCV), mean corpuscular haemo-globin (MCH) and mean corpuscular haemohaemo-globin concentration (MCHC) of fraction-ated carp (N= 10) and human (N = 5) blood cells (fractions 1-5; top-bottom).
other fractions contained almost exclusively cells that were slightly elliptical to elongated.
140 W. SPECKNER, J. F. SCHINDLER AND C. ALBERS
Isotope labelling in vitro
[2-14C]glycine was incorporated into mature red blood cells of both carp and man during incubation in vitro. In five density fractions of a human blood sample pulse-labelled for 10 h and analysed after 26 h in unlabelled plasma, liquid scintillation counts were almost equally distributed and similar to the plasma value. In contrast, after extracorporal pulse-labelling of carp (TV = 5) blood, reinjection and examination 2 days later, the intraerythrocytic radioactivity even in the bottom fractions was about 15 times greater than the plasma value. In addition, decreasing values were obtained in fractions of increasing density (Table 3).
For identification of 14C-labelled soluble constituents in erythrocytes, haemoly-sates were prepared from carp and human blood immediately after labelling with [2-14C]glycine in vitro. After gel filtration, radioactivity and haemoglobin concen-trations were estimated in numerous fractions of the eluate. From human samples, 14
C-labelled substances were mainly retrieved as low MT solutes, probably glycine
[image:8.451.39.415.368.533.2](Fig. 5A). In carp haemolysates, considerable radioactivity was found in fractions of the eluate rich in haemoglobin (Fig. 5B). That the first peak in Fig. 5B was haemoglobin was confirmed by its spectral properties and by the fact that
Table 1. Haematological characterization of density-separated carp erythrocytes; mean values from 10 specimens
Fraction 1 2 3 4 5 P S.E.M. LSD r Whole blood* MCV (fl) 182-1 186-4 188-6 1920 194-9 <00001 ±1-55 3-70 0-73
182-2 ± 19-9
MCH (Pg) 44-6 50-2 52-9 55-1 58-0 <0-0001 ±0-86 2-04 0-88 50-5 ±6-1 MCHC
(gr
1)
244-7 268-9 280-0 286-7 297-6 <0-0001 ±4-42 10-55 0-81
278-6 ± 23-9
Fraction numbers; 1 is the top fraction, 5 the bottom fraction. MCV, mean corpuscular volume.
MCH, mean corpuscular haemoglobin content. MCHC, mean corpuscular haemoglobin concentration. P is the level of significance from F-tesi.
S.E.M. is the standard error of fraction means from two-way analysis of variance. LSD is the least significant difference at the 5% level.
Table 2. Haemoglobin content of individual erythrocytes of density-separated carp blood; mean values for 100 cells
Fraction 1 2 3 4 5 6
Haemoglobin 36-6
45-19 50-97 55-15 59-01 62-76
absorbance*
P< 00001 S.E.M. ± 1-65
LSD = 4-23 r = 0-95
Projected 62-5
6 9 0 69-8 71-2 73-4 73-3
area (//m2)
P < 0 0 2 5 S.E.M. = ±1-82
LSD = 4-66
* Integrated absorbance at 411 nm of one cell (arbitrary units; one unit corresponds roughly to 0-8pg of haemoglobin).
The projected area is for one cell.
70
i= 60
40
Carp = C
H , = » Human H2 = +
H3= x
3 4 Fraction number
Fig. 3. Mean haemoglobin content of individual erythrocytes in carp and human blood (N = 3) obtained by cytophotometry; bars indicate standard deviation of 100 randomly chosen cells (1 = top fraction; 6 = bottom fraction).
no other substance present in red cell haemolysates can react with K3Fe(CN)6 and KCN to form cyanmethaemoglobin.
142
W. SPECKNER, J. F. SCHINDLER AND C. ALBERS 30 10 30 10 30 g. 10 c u I 30 10 30 10 30 10 Carp Human;
JL
:
i
;
ill
i,
Hi.
i,
I " ! " " !1 1" ! 12 30 60 91)
:
,l
• 1
"J
~
"ll
I.
ll,
ll,.
I . I
Fl F2 F3 F4 F5 F6
22 40 58
Arbitrary units
Fig. 4. Typical frequency distribution of total haemoglobin absorbances in individual carp and human erythrocytes obtained by cytophotometry (Fl = top fraction; F6 = bottom fraction).
Table 3. Percentage distribution of radioactivity of density-separated erythrocytes, 2 days after labelling with [2-14C]glycine
Fraction 1 2 3 4 5 X2*
P Carp blood (N=5) 46-1 20-2 13-8 11-3 8-6 46-27 6xlO"7 Human blood (N=l) 21-3 20-1 19-8 19-7 19-1 0-13 NS
Values for carp blood are means of five specimens.
0-8
0-6
0-4
0-2
E
8
20 60 100 140
[Haemoglo
b
o do
0-6
0-4
0-2 B
-O
o
*
r- ^
*
*
• •
I — V - . - . J J ^ 1—
-•
-300
200
100 7
•a.
- 80 --B
- 60
- 40
- 2 0
20 60 100
Elution volume (ml)
[image:11.451.81.376.48.423.2]140
Fig. 5. Distribution of haemoglobin concentration (O) and 14C scintillation counts (•) in the eluate of gel filtration obtained from (A) human and (B) carp haemolysates after incubation with [2-14C]glycine in vitro.
Isotope labelling in vivo
Extracorporal labelling of carp erythrocytes with [2-14C]glycine, and subsequent reinjection of the washed and resuspended cells, provided accurate isotopic dating of this cell type; direct injection of the marker would distribute the glycine widely in the amino acid pool. The mean values obtained in five specimens are summarized in Fig. 7. After 7 days, more than 60 % of the radioactivity was found in the two top fractions and only 7-3 % in the bottom fraction. With time, the radioactivity decreased in the top fraction and increased in the heavier fractions. The pattern of distribution of radioactivity was reversed within about 3 months. However, radioactivity was still present in the light fractions even after 203 days, indicating reutilization of [2-14C]glycine.
144 W. SPECKNER, J. F. SCHINDLER AND C. ALBERS
6A B
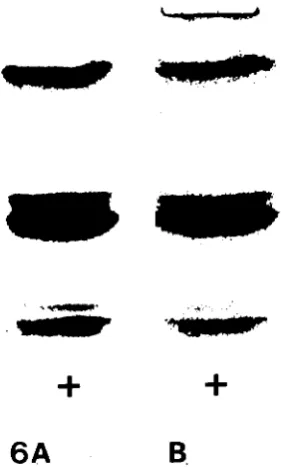
Fig. 6. (A) Analytical thin-layer electrofocusing of radiolabelled carp haemolysate; (B) autoradiograph of A.
counts co-eluted with haemoglobin (Fig. 8). In addition, separation of haemo-globin into the haem and haemo-globin moieties revealed that [2-14C]glycine was incorporated into both components. The ratio of scintillation counts in haemin and globin was approximately 1:2. In two experiments the percentages of radioactivity in haemin were 35-7 and 31-7%. Chlorhaemin (haem in acetone/HCl) was identified by its absorption spectrum in the visible range. Correspondingly, 64-3 % and 68-3 % of the radioactivity was found in the globin fraction.
Discussion
[image:12.451.156.298.89.327.2]30
f radioac
m
o
ge
c
Percent
E
10
i
-1
I
—i
2 3 Day 7
i
. r
fM2
3 4 5I
3 4
Day 28
T |
-|Tl2
3 4X
5
r
2 3—
4 Day 51
5
i
j-|T|2 3 4 5
5
Day 70 Day 91 Day 203
Fig. 7. Percentage of radioactivity in fractions 1 (top) to 5 (bottom) in 14C-labelled carp erythrocytes in vivo from 7 to 203 days after labelling with [2-14C]glycine. Mean values of five specimens. Bars indicate standard error of fraction means from two-way analysis of variance.
such as determinations of enzyme activities, in Percoll-separated erythrocytes, we preferred Murphy's method. Lane etal. (1982) suggested velocity sedimentation at unit gravity in a buffered bovine serum albumin gradient for separating trout
E
8
BO
IT
o
0-4
0-2
20 60 100
Elution volume (ml)
140
40
20
•a
2,
146 W. SPECKNER, J. F. SCHINDLER AND C. ALBERS
(Salmo gairdneri) erythrocytes. This method gave the lowest values of MCHC in the bottom and top fractions and higher values in the intermediate fractions. Since all physical evidence suggests a positive correlation between density and MCHC, we felt this method would not be suitable for our purpose. The efficiency of our method was confirmed by the results of separation with phthalate ester gradients, as well as by the results in human erythrocytes which confirmed the well-established findings (Prentice & Bishop, 1965; Piomelli et al. 1967; Cohen et al. 1976).
A correlation between density and age has been established for non-nucleated erythrocytes by various methods involving isotopic markers (i.e. Prentice & Bishop, 1965; Bishop & Prentice, 1966; Danon et al. 1966; Piomelli et al. 1967). An analogous density-age relationship based on morphological data has been proposed for trout erythrocytes (Lane et al. 1982). However, the efficiency of the fractionation procedure and the correlation between age and density of red cells remains open to discussion (Beutler, 1985, 1986; Piomelli et al. 1986).
The same conclusion follows for carp erythrocytes from our experiments with 14
C-labelled glycine. Even if some reutilization of glycine were to occur, the fractional distribution of radioactivity and the inversion of the histogram (Fig. 7) within 200 days strongly support a correlation between age and density. Similarly, the modal increments in the distribution profiles of the haemoglobin content in individual erythrocytes (Fig. 4) provide evidence for such a correlation. These arguments are limited by the possibility of a fractional inhomogeneity with age. However, from gross morphological examinations and the nearly symmetrical frequency distributions (Fig. 4) it can be concluded that the density fractions were reasonably homogeneous.
The differences between mammalian and fish erythrocytes seem to be of importance (Fig. 2): mammalian red cells shrink in volume during ageing but retain a constant haemoglobin content. Thus, the increase in haemoglobin concentration, and therefore in density, is due to a reduction in volume. In contrast, during ageing, carp red cells increase not only in haemoglobin content but also in volume. An increase in volume in other cyprinid red cells has been reported by Weinberg et al. (1973) and Lane et al. (1982). Thus, the increases in haemoglobin concentration and density result from the haemoglobin content rising more than the volume. Erythrocytes can only increase their haemoglobin content by synthesis. From the continuous rise in haemoglobin content it is obvious that fish erythrocytes must synthesize haemoglobin after being released into the circulation.
seem to vanish during maturation, as do other organelles obligatory in biochemical syntheses (Sekhon & Beams, 1969; Yamamoto & Iuchi, 1976; Lane & Tharp, 1980; Lane et al. 1982). Such observations, however, are somewhat difficult to evaluate since ribosomes are hardly discernible from the rather dense backgrounds in cells with a very high concentration of haemoglobin. Our own, as yet unpublished, fixed morphological studies, including freeze-fracture techniques, show that all carp erythrocytes possess numerous pores in the nuclear envelope and contain several variform vacuolar compartments within the cytosol with at least some endocytic activity present on the plasma membrane. Moreover, nucleoside triphosphate contents increased continuously with ageing of red cells of rainbow trout (Lane, 1984). Taking all arguments together, the morphological evidence is not decisive about the ability of circulating erythrocytes to synthesize haemoglobin. A biochemical approach, however, seems to favour this hypothesis.
Incubations with [2-14C]glycine gave information about haemoglobin synthesis in vitro. This amino acid marker can label the globin component intratransla-tionally and is utilized in haem synthesis (Hevesy et al. 1964; Piomelli et al. 1967). Both carp and human erythrocytes took up [2-14C]glycine. Whereas the former incorporated the labelled amino acid into haemoglobin, the latter merely absorbed it (Fig. 5; Table 3). Radioactivity was present in haemoglobin-containing fractions of carp but not human gel nitrates of haemolysates. After cleavage of carp haemoglobin, 14C radioactivity was detected in both the globin and the haem component. Autoradiographic evidence suggests incorporation of [2-14]glycine into all three major components of carp haemoglobin.
The authors wish to thank B. GeS, K.-H. Gotz, M. Hamann and U. de Vries for their skilful technical assistance.
References
ALBERS, C. (1985). Gas transport properties of fish blood. In Circulation, Respiration and Metabolism (ed. R. Gilles), pp. 82-90. Berlin, Heidelberg, New York, Tokyo: Springer-Verlag.
ALBERS, C , GOTZ, K. H. & WELBERS, P. (1981). Oxygen transport and acid-base balance in the blood of the sheatfish, Silurus glanis. Respir. Physiol. 46, 223-236.
BARTOSZ, G., GACZYNSKA, M., GRZELINSKA, E., SOSZYNSKI, M., MICHALAK, W. & GONDKO, R.
(1987). Aged erythrocytes exhibit decreased anion exchange. Mech. Age Dev. 39, 245-250. BETKE, K. & SAVELSBERG, W. (1950). Stufenphotometrische Hamoglobinbestimmung mittels
Cyanhamoglobin. Biochem. Z. 320, 431-439.
BEUTLER, E. (1985). Annotation. How do red cell enzymes age? A new perspective. Br. J. Haemat. 61, 377-384.
BEUTLER, E. (1986). Correspondence. How do red cell enzymes age? Hypothesis and facts. Br. J. Haemat. 64, 408-410.
BISHOP, C. & PRENTICE, T. C. (1966). Separation of rabbit red cells by density in a bovine serum albumin gradient and correlation of red cell density with cell age after in vivo labelling with % e . J. cell. comp. Physiol. 67, 197-207.
CHUDZIK, J. & HOUSTON, A. H. (1983). Temperature and erythropoiesis in goldfish. Can. J. Zool. 61,1322-1325.
148 W. SPECKNER, J. F. SCHINDLER AND C. ALBERS
characterization of density-separated human erythrocytes. Biochim. biophys. Acta 419, 229-242.
COOKE, D., CRAVEN, A. H. & CLARKE, G. M. (1982). Basic Statistical Computing. London: E. Arnold.
DANON, D. & MARIKOVSKY, Y. (1964). Determination of density distribution of red cell population. J. Lab. clin Med. 64, 668-674.
DANON, D., MARIKOVSKY, Y. & GASKO,O. (1966). 51-chromium uptake as a function of red cell age. J. Lab. clin. Med. 67, 70-77.
DRYSDALE, J. W., RIGHETTI, P. & BUNN, F. (1971). The separation of human and animal hemoglobins by isoelectric focusing in polyacrylamide gel. Biochim. biophys. Acta 229, 42-50.
FISCHBECK, K. H., BONILLA, E. & SCHOTLAND, D. L. (1982). Freeze-fracture characterization of "young" and old human erythrocytes. Biochim. biophys. Acta 685, 207-210.
GARBY, L. & HJELM, M. (1963). Ultracentrifugal fractionation of human erythrocytes with respect to cell age. Blut 9, 284-291.
GILLEN, R. G. & RIGGS, A. (1972). Structure and function of the hemoglobins of the carp, Cyprinus carpio. J. biol. Chem. 247, 6039-6046.
GRZEUNSKA, E., BARTOSZ, G. & BARTKOWIAK, A. (1983). Ageing of the erythrocyte. XVIII. Changes in kinetic properties of acetylcholinesterase. Enzyme 30, 95-98.
HAIDER, G. (1967). Vergleichende Untersuchungen zur Blutmorphologie und Hamatopoese einiger Teleostier. I. Beobachtungen an Zellen der roten Reihe. Zool. Anz. 179, 355-384.
HARDIG, J. (1977). Maturation of circulating red blood cells in young Baltic salmon (Salmo salar L.). Actaphysiol. scand. 178, 290-300.
HEVESY, G., LOCKNER, D. & SLETTEN, K. (1964). Iron metabolism and erythrocyte formation in fish. Actaphysiol. scand. 60, 256-266.
HOFFMAN, J. F. (1958). On the relationship of certain erythrocyte characteristics to their physiological age. /. cell comp. Physiol. 51, 415-423.
HOLM, S. (1979). A simple sequentially rejective multiple test procedure. Scand. J. Statist. 6, 65-70.
HUGHES, G. M., ALBERS, C , MUSTER, D. & GOTZ, K. H. (1983). Respiration of the carp, Cyprinus carpio L., at 10 and 20°C and the effects of hypoxia. J. Fish Biol. 22, 613-628. IMAMURA, O. (1979). The formulae for animals from protozoa to vertebrata. In Physiological
Salines (ed. M. Midsukami), p. 227. Tokyo: Keigaku.
IUCHI, I. & YAMAMOTO, M. (1983). Erythropoiesis in the developing rainbow trout, Salmo gairdneri irideus: Histochemical and immunochemical detection of erythropoietic organs. J. exp. Zool. 226, 409-417.
KREUTZMANN, H.-L. & JONAS, L. (1978). Elektonenmikroskopische und ultrahistochemische Untersuchungen der Erythrozyten vom Aal {Anquilla anquilla) und von der Regen-bogenforelle (Salmo gairdneri) unter besonderer Beriicksichtigung des Segregations-apparates und des Marginalbandes. Acta histochem. 62, 282-292.
KRYZMOWSKA, H., IWANSKA, S. & WINNICKI, A. (1960). The effect of the erythropoietic factor from sheep plasma on erythropoiesis in carps (Cyprinus carpio L.). Acta physiol. pol. 11, 425-431.
LANE, H. C. (1984). Nucleoside triphosphate changes during the peripheral life-span of erythrocytes of adult rainbow trout (Salmo gairdneri). J. exp. Zool. 231, 57-62.
LANE, H. C. & THARP, T. P. (1980). Changes in the population of polyribosomal containing red cells of peripheral blood of rainbow trout, Salmo gairdneri Richardson, following starvation and bleeding. J. Fish Biol. 17, 75-81.
LANE, H. C , WEAVER, J. W., BENSON, J. A. & NICHOLS, H. A. (1982). Some age related changes of adult rainbow trout, Salmo gairdneri Rich., peripheral erythrocytes separated by velocity sedimentation at unit gravity. /. Fish Biol. 21, 1-13.
LOWRY, O. H., ROSEBROUGH, N. J., FARR, A. L. & RANDALL, R. J. (1951). Protein measurement with the Folin phenol reagent. J. biol. Chem. 193, 265-275.
MURPHY, J. R. (1973). Influence of temperature and method of centrifugation on the separation of erythrocytes. /. Lab. clin. Med. 82, 334-341.
I. Relationship between cell age and specific gravity evaluated by ultracentrifugation in a discontinuous gradient. J. Lab. din. Med. 69, 659-674.
PIOMELLI, S., SEAMAN, C. & CORASH, L. (1986). Correspondence. How do red cell enzymes age? Hypothesis and facts. Br. J. Haemal. 64, 407-408.
PRANKERD, T. A. J. (1958). The ageing of red cells. /. Physiol., Lond. 143, 325-331.
PRENTICE, T. C. & BISHOP, C. (1965). Separation of rabbit red cells by density methods and characteristics of separated layers. /. cell. comp. Physiol. 65, 113-126.
RIGAS, D. A. & KOLER, R. D. (1961). Ultracentrifugal fractionation of human erythrocytes on the basis of red cell age. /. Lab. din. Med. 58, 242-246.
Rossi FANELLI, A., ANTONINI, E. & CAPUTO, A. (1958). Studies on the structure of hemoglobin. I. Physicochemical properties of human globin. Biochim. biophys. Acta 30, 608-615.
SACHS, L. (1984). Angewandte Statistik. Berlin, Heidelberg, New York, Tokyo: Springer-Verlag.
SCHINDLER, J. F. & DE VRIES, U. (1986). Scanning cytophotometry of carp, Cyprinus carpio L., erythrocyte populations: the influence of short-term hypoxic environment and the recovery period following severe bleeding. /. Fish Biol. 28, 741-752.
SCHINDLER, J. F., DE VRIES, U. & LINDNER, E. (1985). Microspectrophotometric and scanning micTophotometric studies of carp {Cyprinus carpio L.) erythrocytes. Histochemistry 82, 483-489.
SEKHON, S. S. & BEAMS, H. W. (1969). Fine structure of the developing trout erythrocytes and thrombocytes with special reference to the marginal band and the cytoplasmic organelles. Am. J. Anat. 125, 353-374.
TRAUTSCH, CH., TANNERT, C. & MARETZKI, D. (1981). Disproportional loss of membrane constituents in the course of erythrocyte aging. Acta biol. med. germ. 40, 743-746.
VAN KAMPEN, E. J. & ZULSTRA, W. G. (1961). Standardization of hemoglobinometry. II. The hemoglobincyanide method. Clin. chim. Acta. 6, 538-544.
WEBER, R. E. & LYKKEBOE, G. (1978). Respiratory adaptations in carp blood. Influence of hypoxia, red cell organic phosphates, divalent cations and CO2 on hemoglobin-oxygen
affinity. J. comp. Physiol. 128, 127-137.
WEINBERG, S. R., SIEGEL, C. D. & GORDON, A. S. (1973). Studies on the peripheral blood cell parameters and morphology of the red paradise fish, Macropodus opercularis. Effect of food deprivation on erythropoiesis. Anat. Rec. 175, 7-14.
WEINREB, E. L. (1963). Studies on the fine structure of teleost blood cells. I. Peripheral blood. Anat. Rec. 147, 219-238.
WOLOWYK, M. W. (1982). Cell separation techniques. In Red Cell Membranes - A Methodological Approach (ed. J. C. Ellory & J. D. Young), pp. 1-11. New York, London: Academic Press.
YAMAMOTO, M. & IUCHI, I. (1976). Electron microscopic study of erythrocytes in developing rainbow trout, Salmo gairdnerii irideus, with particular reference to changes in the cell line. J. exp. Zool. 191, 407-426.
YASUZUMI, G. & HIGASHIZAWA, S. (1955). Submicroscopic structure of the carp erythrocyte as revealed by electron microscopy. Cytologia 30, 280-290.


![Fig. 5. Distribution of haemoglobin concentration (O) and 14C scintillation counts (•)in the eluate of gel filtration obtained from (A) human and (B) carp haemolysates afterincubation with [2-14C]glycine in vitro.](https://thumb-us.123doks.com/thumbv2/123dok_us/1174110.639717/11.451.81.376.48.423/distribution-haemoglobin-concentration-scintillation-filtration-obtained-haemolysates-afterincubation.webp)