COUNTRIES
Ryan D. Cronk
A dissertation submitted to the faculty at the University of North Carolina at Chapel Hill in partial fulfillment of the requirements for the degree of Doctor of Philosophy in the Department of Environmental Sciences and Engineering in the Gillings School of Global
Public Health.
Chapel Hill 2017
Approved by:
Jamie Bartram
Clarissa Brocklehurst
Richard Johnston
Peter Kolsky
Mark Sobsey
ii
© 2017
Ryan D. Cronk
ALL RIGHTS RESERVED
iii ABSTRACT
Ryan D. Cronk: Using monitoring data to identify water and sanitation service delivery improvement opportunities in low- and middle-income countries
(Under the direction of Jamie Bartram)
Universal access to basic sanitation and water services and their progressive improvement are important for human development, health, and human rights; and are
recognized in program, national, and international policies such as the Sustainable Development Goals (SDGs). Monitoring data are important for measuring progress toward universal access and improvements in service levels. In the SDG era, substantially more data will become available with new and expanded monitoring. These data can be analyzed beyond their
immediate purpose to answer policy-relevant questions. However, these data are underused for service delivery research and there are opportunities to improve the reliability and quality of monitoring. To address these challenges, I analyzed monitoring data to identify opportunities to improve monitoring and water and sanitation service delivery.
Using water supply infrastructure data from sub-Saharan Africa and Central America,
Bayesian networks predicted water system functionality and continuity increased by as many as
20 percentage points when best-observed conditions were in place. I systematically compiled
health care facility (HCF) datasets to produce the first coverage estimates for 21 indicators of
environmental conditions in HCFs in low- and middle-income countries, where 52% of HCFs
lack piped water and 30% lack improved sanitation. Statistically significant inequalities in
coverage exist between HCFs by urban-rural setting, managing authority, facility type, and
iv
indicators of water and sanitation performance. Water and sanitation performance analysis provides policymakers with a new accountability instrument for assessing country progress on meeting full realization of human rights obligations. There are many simple data collection improvement opportunities that do not add substantial cost or burden which would make
monitoring data more valuable for service delivery research. Improvement opportunities include the use of: relevant and appropriate survey questions, clear definitions, and quality
assurance/quality control measures.
Together, these studies demonstrate substantial, unrealized value that can be derived from
monitoring. Monitoring improvements and analysis of these data are major opportunities to make
better use of limited resources, inform evidence-based decision-making for better management,
policy, programming, and practice, and improve water and sanitation service delivery.
v
ACKNOWLEDGEMENTS
I would like to thank Jamie Bartram for his advising support, inspiration, and creative energy throughout my masters and PhD work. My committee members, Clarissa Brocklehurst, Richard Johnston, Pete Kolsky, and Mark Sobsey deserve additional thanks for their critical insight and feedback on drafts of this work.
Many thanks are due to my colleagues in the Department of Environmental Sciences and Engineering and the Water Institute at UNC – especially Kaida Liang, Mike Fisher, Kate
Shields, and Jeanne Luh.
I am grateful to my friends and family who have supported me throughout this process and I am particularly grateful for the support, patience, and encouragement from my wife Christina.
This work was supported by grants from the Conrad N. Hilton Foundation, the World
Health Organization, the Wallace Genetic Foundation, and by a training grant from the National
Institute of Environmental Health Sciences (Grant Number: T32ES007018).
vi
TABLE OF CONTENTS
LIST OF TABLES ... ix
LIST OF FIGURES ... xii
LIST OF ABBREVIATIONS ... xiv
CHAPTER 1: INTRODUCTION ... 1
Dissertation research questions ... 4
CHAPTER 2: LITERATURE REVIEW ... 7
Methods ... 7
Results and Discussion ... 9
Implications for policy and practice ... 39
CHAPTER 3: FACTORS INFLUENCING WATER SYSTEM FUNCTIONALITY IN NIGERIA AND TANZANIA: A REGRESSION AND BAYESIAN NETWORK ANALYSIS ... 43
Introduction ... 43
Methods ... 45
Results ... 50
Discussion ... 60
CHAPTER 4: IDENTIFYING OPPORTUNITIES TO IMPROVE PIPED WATER CONTINUITY IN HONDURAS, NICARAGUA, AND PANAMA USING BAYESIAN NETWORKS AND REGRESSION... 67
Introduction ... 67
Methods ... 71
vii
Discussion ... 83
Conclusions ... 90
CHAPTER 5: ENVIRONMENTAL CONDITIONS IN HEALTH CARE FACILITIES IN LOW- AND MIDDLE-INCOME COUNTRIES: COVERAGE AND INEQUALITIES... 91
Introduction ... 91
Methods ... 94
Results ... 101
Discussion ... 113
Conclusion ... 123
CHAPTER 6: USING MONITORING DATA TO COMPARE COUNTRY PERFORMANCE IN REALIZING UNIVERSAL ACCESS TO DRINKING WATER AND SANITATION ... 125
Introduction ... 125
Methods ... 127
Results and Discussion ... 133
Implications for policy and practice ... 150
CHAPTER 7: JOINT DISCUSSION ... 153
Deriving additional value from monitoring ... 153
Opportunities to improve monitoring ... 156
Parting thoughts... 159
APPENDIX 1 FOR CHAPTER 3 ... 160
APPENDIX 2 FOR CHAPTER 4 ... 162
APPENDIX 3 FOR CHAPTER 6 ... 177
viii
ix
Table 1. Methods of water and sanitation service delivery data collection
and their characteristics... 13 Table 2. Water and sanitation monitoring types and example
definitions ... 16 Table 3. Service delivery research types and example definitions ... 17 Table 4. The relationship between data collection methods, monitoring
types, and service delivery research types ... 20 Table 5. Examples of water and sanitation service delivery research
studies ... 23 Table 6. Examples of methods to analyze monitoring and observational
data for water and sanitation service delivery research ... 35 Table 7. Selected descriptive statistics for all water systems analyzed in
Nigeria and Tanzania. ... 52 Table 8. Unadjusted and adjusted multilevel logistic regression results for
water system functionality in Nigeria ... 54 Table 9. Unadjusted and adjusted multilevel logistic regression results for
water system functionality in Tanzania ... 55 Table 10. Guideline topics and definitions in the essential environmental
health standards in health care settings and the core indicators for WaSH and waste management in HCF, adapted from (WHO/UNICEF, 2016a;
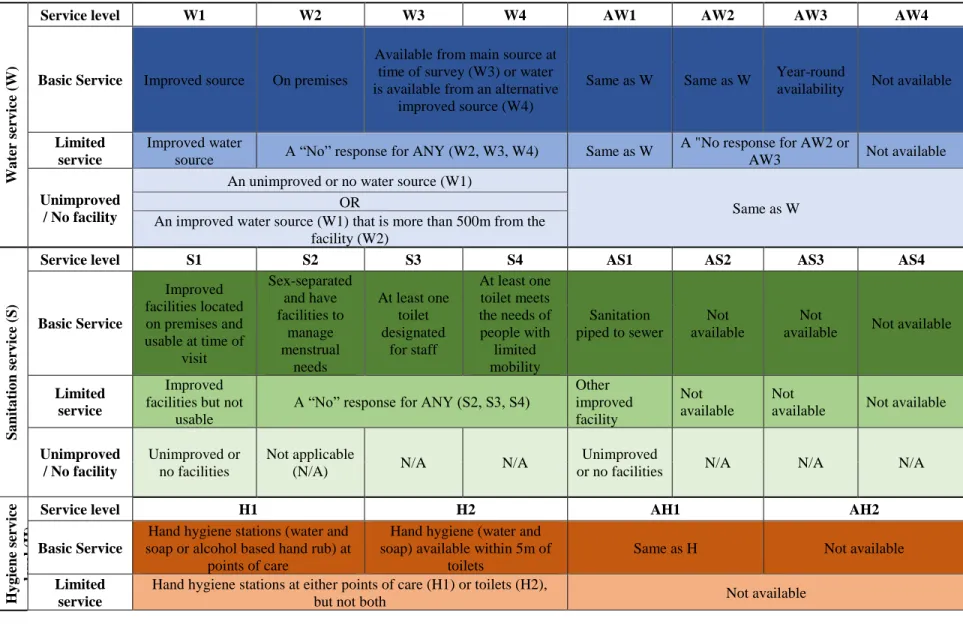
World Health Organization, 2008) ... 96 Table 11. Comparing the SDG service levels with data available in the
SPA surveys. Adapted from (WHO/UNICEF, 2016a) ... 97 Table 12. Countries included in a study of environmental conditions
and availability of standard precaution items in health care facilities
in low- and middle-income countries ... 102 Table 13. Coverage of environmental conditions and availability of
standard precautions in health care facilities based on data from 78
low- and middle-income countries... 105
x
Table 15. Differences in availability of basic water services in
Bangladesh, Haiti, Malawi, Nepal, Senegal, and Tanzania ... 110
Table 16. Unadjusted and adjusted logistic regression results for factors associated with the availability of basic water services in health care facilities in six countries ... 112
Table 17. Country characteristic and governance attributes ... 132
Table 18. Trends in country values of water access performance ... 137
Table 19. Trends in country values of water equality performance ... 142
Table 20. Trends in country values of sanitation access performance ... 147
Table 21. Trends in country values of sanitation equality performance ... 150
Table 22. Average age of water system types in Tanzania ... 160
Table 23. Sensitivity analysis for main functionality BN model – Nigeria... 160
Table 24. Sensitivity of functionality to a finding at another variable for Tanzania ... 161
Table 25. Bayesian network model evaluation results for Nigeria and Tanzania ... 161
Table 26. Selected descriptive statistics for all water systems analyzed in Honduras ... 162
Table 27. Selected descriptive statistics for all water systems analyzed in Nicaragua ... 163
Table 28. Selected descriptive statistics for all water systems analyzed in Panama ... 164
Table 29. Water system rates and sufficient collection to cover operations, maintenance, and capital costs ... 165
Table 30. Univariable and multivariable logistic regression model for
24-hour water services in Honduras ... 166
xi
Table 32. Univariable and multivariable linear regression model results
for water service continuity in Panama ... 168 Table 33. Sensitivity of 'Continuity' to a finding at another node
(Honduras) ... 171 Table 34. Sensitivity of 'Continuity' to a finding at another node
(Nicaragua) ... 172 Table 35. Sensitivity of 'Continuity' to a finding at another node
(Panama) ... 173 Table 36. Bayesian network model evaluation results for Honduras,
Nicaragua, and Panama ... 173 Table 37. Predicted 24-hour water service availability in Honduras in
different scenarios using Bayesian networks ... 174 Table 38. Predicted 24-hour water service availability in Nicaragua in
different scenarios using Bayesian networks ... 175 Table 39. Predicted water service continuity in Panama under different
scenarios using Bayesian networks ... 176
Table 40. Water and sanitation country performance values ... 177
xii
Figure 1. The relationship between operational, implementation and
WaSH systems research ... 21
Figure 2. Improving water and sanitation service delivery through monitoring and service delivery research ... 29
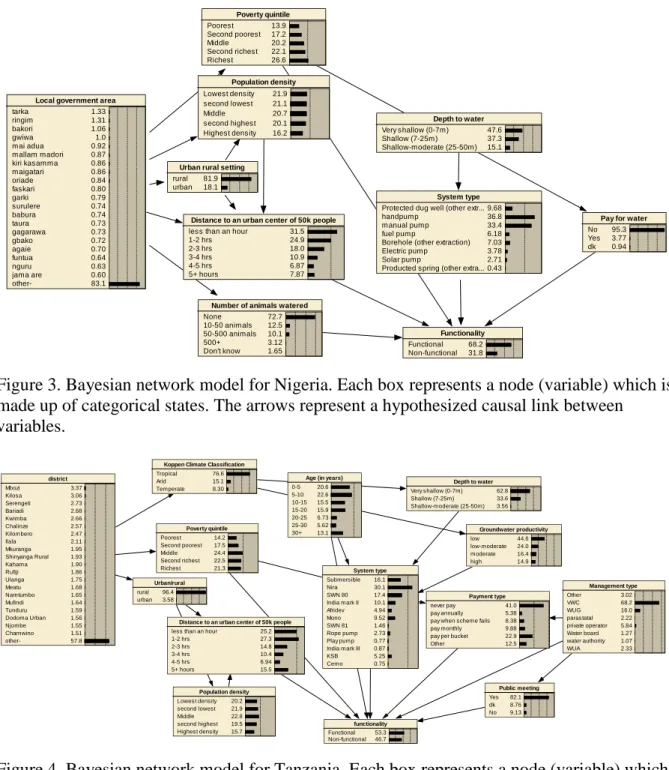
Figure 3. Bayesian network model for Nigeria. Each box represents a node (variable) which is made up of categorical states. The arrows represent a hypothesized causal link between variables. ... 57
Figure 4. Bayesian network model for Tanzania. Each box represents a node (variable) which is made up of categorical states. The arrows represent a hypothesized causal link between variables ... 57
Figure 5. Base-case Bayesian network model for Honduras. ... 82
Figure 6. SDG service levels for water, sanitation, hygiene, and waste management in Bangladesh, Haiti, Malawi, Senegal, and Tanzania ... 108
Figure 7. Water access performance: component values by country ... 133
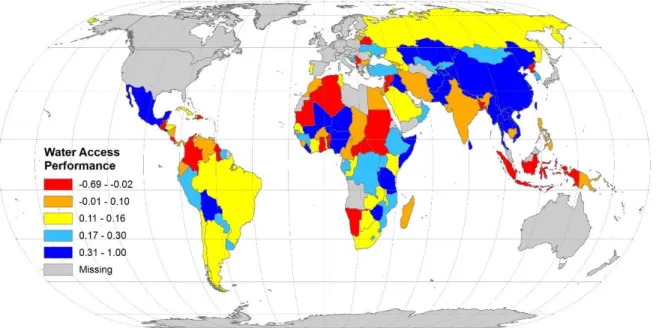
Figure 8. Global water coverage by country (percentage) ... 134
Figure 9. Performance frontier for water access based on rates of change from all countries and all times ... 135
Figure 10. Water equality performance: component values by country ... 138
Figure 11. Performance frontier for water equality based on rates of change from all countries and all times ... 139
Figure 12. Water equality performance versus GDP per capita (log)... 140
Figure 13. Water coverage equality versus GDP per capita (log) ... 141
Figure 14. Sanitation access performance: component values by country ... 143
Figure 15. Global sanitation coverage by country (percentage) ... 144
Figure 16. Performance frontier for sanitation access performance based on rates of change from all countries and all times ... 145
Figure 17. Sanitation equality performance: component values by country ... 148
xiii
Figure 19. Using the water and sanitation performance indicators as a
decision tool: an example with sanitation access performance ... 152
Figure 20. Base-case Bayesian network model for Nicaragua. ... 169
Figure 21. Base-case Bayesian network model for Panama. ... 170
xiv
BN Bayesian network
CAPI Computer assisted personal interviewing CI Confidence interval
DHS Demographic and Health Survey HCAI Health care acquired infection HCF Health care facility
IRB Institutional review board
JMP Joint Monitoring Programme for water supply and sanitation of the World Health Organization and UNICEF
LAC Latin America and the Caribbean LGA Local government area
LMIC Low- and middle-income country LSMS Living Standards Measurement Survey MICS Multiple Indicator Cluster Surveys MST Mobile survey tool
NGO Non-Governmental Organization
OR Odds ratio
PAPI Paper-and-pencil interviewing PCS Post construction support
QA/QC Quality assurance/quality control
QI Quality improvement
ROC Receiver operating characteristic
xv
SARA Service Availability and Readiness Assessment SDG Sustainable Development Goals
SIASAR Sistema de Información de Agua y Saneamiento Rural SPA Service Provision Assessment
STROBE Strengthening the reporting of observational studies in epidemiology
UN United Nations
UNICEF United Nations Children's Fund
WaSH Water, Sanitation, and Hygiene
WHO World Health Organization
1
CHAPTER 1: INTRODUCTION
Universal access to basic water and sanitation services and increased delivery and use of safely-managed services have long been recognized as important for human health, well-being, and development (Bartram & Cairncross, 2010). However, more than 2.4 billion people use unimproved sanitation facilities or defecate in the open and 663 million people use an unimproved drinking water source (WHO/UNICEF, 2015b). Many more do not use safely managed water and sanitation services (WHO/UNICEF, 2015a). When accounting for water quality, 1.8 billion people drink from a fecally-contaminated source (Bain, Cronk, Hossain, et al., 2014; Onda, Crocker, Kayser, & Bartram, 2014). Many of these people live in rural areas, use discontinuous services, and/or non-piped water sources that are distant from the home (Bain, Cronk, Wright, et al., 2014; Kumpel & Nelson, 2016; Shields, Bain, Cronk, Wright, & Bartram, 2015). An estimated 4.1 billion people use sanitation facilities where waste is not treated before it is discharged into the environment (Baum, Luh, & Bartram, 2013). More than 842,000 deaths in 2012 were attributable to inadequate drinking water, sanitation, and hygiene (WaSH) in low- and middle-income countries (LMICs) (Pruss-Ustun et al., 2014).
The substantive and well-documented water and sanitation challenges are reflected in program, local, national, and international policies, goals, and targets. In international
development policy, water and sanitation service delivery targets are established in the
Sustainable Development Goals (SDGs) through Goal 6. It includes targets for universal access
to basic WaSH services by 2030 and service level improvements (United Nations General
Assembly, 2015; WHO/UNICEF, 2015a). The WHO/UNICEF Joint Monitoring Programme for
2
6. As part of the definition of universal access, the JMP include non-household settings such as health care settings and schools. (Cronk, Slaymaker, & Bartram, 2015; United Nations General Assembly, 2015; WHO/UNICEF, 2016a, 2016b).
Monitoring data are used to identify and report on trends and patterns of water and sanitation services, including measuring progress toward universal access and service
improvements. Using information from 77 LMICs, data experts predict that at least US$1 billion will be needed annually for expanded and new country-level monitoring and statistical initiatives to measure overall SDG progress (Espey, 2015). More will be spent annually on water and sanitation-specific project, program, and sub-national monitoring initiatives (One WaSH National Program, 2013; Pena L, 2013; WPDx, 2015).
There are opportunities to improve monitoring – without adding costs or constraints – to make the data more useful for their intended purposes (reporting levels and trends in service levels) and also deliver added value through other means, such as service delivery research (i.e.
the analysis of data on water and sanitation systems to improve service delivery).
For example, there are opportunities to increase the quality and reliability of data
collection (Royston, 2011; Zachariah et al., 2009). Improved reporting of sample frames used for
monitoring increases the generalizability of the findings (Ministry of Water, 2013). Use of
specific survey questions leads to better responses and reduces the potential for under- or over-
reporting of water and sanitation service conditions (Fisher et al., 2015). Improved reporting of
data collection methods, sources of potential bias, and study limitations makes it easier for others
to interpret and use data, replicate monitoring, and learn from errors and mistakes (WPDx,
2015).
3
leaders as a means to identify and overcome service delivery challenges and bottlenecks; and identify improvement opportunities (Bartram et al., 2015; Department for International Development (DFID), 2012; WHO, 2016; World Health Organization and UNICEF, 2015).
Evidence from service delivery research helps policymakers, planners, and practitioners make better decisions about water and sanitation management and identify processes that improve the quality and sustainability of services. However, monitoring data are little used for water and sanitation service delivery research. For example, a systematic review on the use of nationally- representative Demographic and Health Surveys (DHS) in research shows that there are few studies that use DHS data to explore water and sanitation service delivery challenges. In contrast, other areas of health and development research have many studies that use DHS monitoring data.
These health and development studies reveal important insights for policy, programming, and practice (Fabic, Choi, & Bird, 2012).
Among water and sanitation service delivery research studies that do use available monitoring data, many studies only report descriptive statistics. Modeling tools are infrequently used to examine relationships between service outcomes and explanatory variables (Royston, 2011). Reports of such studies are infrequently published and made public, few undergo peer review which would add rigor and credibility to the findings, and study findings are rarely translated into actionable policy, programming, and practice recommendations (Zachariah et al., 2009).
The fundamental purpose of monitoring is to create information for action to improve
matters. More effective and relevant service delivery research could be produced from available
data by researchers for decision-makers (e.g. policymakers, program managers, planners,
4
produce salient, credible, and legitimate evidence and associated knowledge products. Saliency here refers to relevance to the decision maker, credibility refers to scientific adequacy, and legitimacy refers to fairness and balance of the process and production of the knowledge products (Cash et al., 2003). However, in water and sanitation, boundaries between actors are often poorly defined or actors work in isolation, where researchers may produce scientifically- credible service delivery research with low salience and/or legitimacy; or practitioners may produce salient findings that have low credibility and/or legitimacy (Cash et al., 2003;
Kristjanson et al., 2009).
Diverse service delivery research studies describe overlapping purposes and definitions for similar activities and actions. In the health literature, there has been substantial debate and discussion to define types of service delivery research and describe the role of each in improving health systems (Remme et al., 2010). However, there is little equivalent clarification in water and sanitation service delivery. This lack of clarity on types, definitions, and good practices
adversely affects the credibility of service delivery research studies. Inconsistencies make it difficult to evaluate and assess their individual and collective value and impedes their legitimacy and salience among decision-makers (Remme et al., 2010; White, Smith, & Currie, 2011).
Dissertation research questions
In response to these challenges and opportunities, my overarching dissertation research
questions are: (1) What examples of additional value can be derived from water and sanitation
service delivery monitoring through use in service delivery research? And (2) what opportunities
are there to improve water and sanitation service delivery monitoring – adding no or minimal
5
these questions using survey-based input-output-outcome monitoring. I use data from three types of surveys: infrastructure surveys (for example, water system level data), non-household facility surveys (for example, health care facility level data), and nationally representative household surveys. Where appropriate, hygiene and environmental health are addressed (Chapter 5 on health care facilities).
In Chapter 2, the literature review, I identify methods of data collection, types of monitoring, and types of service delivery research. Using water and sanitation service delivery studies and literature on general good practice for data collection, I identify opportunities to improve input-output-outcome monitoring collected through surveys and opportunities to improve their analysis and reporting in service delivery research studies. Jamie Bartram and Michael B. Fisher are co-authors.
In Chapters 3 and 4, I analyze water system infrastructure data using regression and Bayesian Networks to explore variables that influence water service availability. There are few studies that use Bayesian networks to quantitatively explore water service availability. Jamie Bartram is a co-author. As of submission of this dissertation, Chapter 3 is under review at Environmental Science & Technology and Chapter 4 is under review at the Journal of Cleaner Production.
In Chapter 5, I use nationally- and sub-nationally representative health care facility data,
to produce the first coverage estimates of environmental conditions and standard precautions in
HCFs in low- and middle-income countries (LMICs); and explore factors associated with low
coverage. Jamie Bartram is a co-author. As of submission of this dissertation, Chapter 5 is under
review at the International Journal of Hygiene and Environmental Health.
6
survey data into indicators of country performance on water and sanitation to explore which countries are high and low performers on improving water and sanitation services. Jamie Bartram is a co-author.
In Chapter 7, the joint discussion, I synthesize the findings of the preceding chapters and
describe their implications for improving monitoring and generating further value through
analysis to inform policy, programming, and practice.
7
CHAPTER 2: LITERATURE REVIEW Literature review objectives
I conducted a literature review to:
• Identify and document methods of data collection and types of monitoring
• Identify, document, characterize, and clarify types of service delivery research
• Identify examples of water and sanitation service delivery research studies
• Identify literature documenting good practice for data collection
• Use good practices for data collection to identify opportunities to improve: input-output- outcome monitoring collected through surveys; the analysis and reporting of these data in service delivery research studies; and the salience, credibility, and legitimacy of studies
Methods
Literature review of monitoring and service delivery research
A systematic review was not practical because service delivery research is broadly defined and associated terms, such as operational research and implementation science, are inconsistently used in water and sanitation (Datta, 1993; Royston, 2011; White et al., 2011).
Literature searches were conducted in PubMed and Google Scholar. The search strategy
combined terms associated with monitoring and service delivery research; terms associated with
water and sanitation (hygiene studies were not reviewed to reduce the scope), global health, or
international development; terms associated with data collection; and low- and middle-income
8
middle-income country”). Global health and international development literature reviews were reviewed (Datta, 1993; Royston, 2011; White et al., 2011; Zachariah et al., 2009). To ensure inclusion of literature published by actors such as governments and external support agencies (e.g. multi-lateral agencies, non-governmental organizations), relevant information repositories were searched such as the knowledge databases of IRCWASH and the Water, Engineering and Development Centre (IRC WASH, 2016; WEDC, 2016).
Types and definitions of monitoring and service delivery research and examples
Methods of data collection, types and definitions of monitoring, and types and definitions of service delivery research employed in the selected studies were compared to explore overlap and interrelationships. Existing definitions from selected studies were used to more clearly define service delivery research and draw boundaries around types for water and sanitation.
Water and sanitation service delivery studies were tabulated. Service delivery research studies were selected if they were:
• About water and sanitation service delivery in LMICs;
• Collected or used monitoring data, observational data (qualitative or quantitative), and/or data for the purpose of improving a process or program; and
• Analyzed these data and used the results to make policy, practice and/or programming
recommendations related to service delivery improvements.
9
Quality improvement (QI) frameworks are widely used in fields such as manufacturing and health care (Juran & Riley, 1999; Shewhart & Deming, 1939). Generally, steps in a quality improvement framework where good practice (i.e. practices that lead to better quality data and/or evidence) may be applied are “define, measure, analyze, improve, and control” (Borror, 2009).
The Strengthening the Reporting of Observational Studies in Epidemiology (STROBE) criteria are a checklist of good practice reporting items for cross-sectional observational studies and Hales et al. (2016) developed reporting guidelines for implementation and operational research (Hales et al., 2016; Von Elm et al., 2007). Good practice components of the QI framework, STROBE criteria, and implementation and operational research reporting guidelines were used to organize good practices in input-output-outcome monitoring collected through surveys and opportunities to improve the analysis and reporting of these data in service delivery research studies (the frameworks, criteria, and guidelines are described in (Hales et al., 2016; Juran &
Riley, 1999; Von Elm et al., 2007)). Good practices were categorized as applicable: before, during, and after data collection. We also identified examples of ‘boundary objects’ i.e.
collaborative knowledge products such as maps and models, which can be used to improve the salience, credibility, and legitimacy of service delivery research products (Cash et al., 2003).
Results and Discussion
First the methods of data collection, types of monitoring, and types of service delivery
research were identified; and then the relationships between the three were identified to show
opportunities where monitoring data can be used for service delivery research.
10
There are several methods of water and sanitation service delivery data collection, and these can be used for monitoring or for an expressed purpose such as evaluation (“the systematic and objective assessment of an on-going or completed project, program or policy, its design, implementation and results”(Kusek & Rist, 2004)) or research (defined as “the systematic investigation into and study of materials and sources in order to establish facts and reach new conclusions” (Oxford English Dictionary)). Types include qualitative, surveys (household, non- household facility, and infrastructure surveys), sample collection and testing, and active and passive remote sensing (Table 1).
Qualitative data collection is used for in-depth exploration, for example of the enablers of and barriers to water and sanitation service delivery. Qualitative data collection instruments include interviews, focus groups, mapping, structured observations, and photography. It is useful for developing theories and hypotheses using a small ‘n’ size population, however these findings cannot necessarily be generalized to larger populations. Findings from qualitative might be tested in large scale quantitative studies (Denzin & Lincoln, 1994).
Surveys are “a research method…to empirically and scientifically study and provide information about people and phenomena” (Lavrakas, 2008a) and they are widely used in global health, international development, and water and sanitation service delivery. Surveys are
conducted at the household-level (e.g. The DHS Program’s Demographic and Health Survey),
non-household (e.g. health care facility, school) facility-level (e.g. WHO’s Service Availability
and Readiness Assessment), and/or infrastructure-level (e.g. SIASAR, the rural water and
sanitation information system for the Latin America and Caribbean region). Household and non-
household facility surveys are typically conducted by a data collection actor collecting data from
11
professional judgement of a water and sanitation system through an inspection or information from the system operator such as a water committee member or service utility. There is overlap between survey types, where facility or household surveys may include an infrastructure observation component.
Surveys are usually conducted using paper and pencil interviewing (PAPI) or computer assisted personal interviewing (CAPI). For PAPI, an interviewer uses paper surveys to record answers from survey respondents (Lavrakas, 2008b). With wide availability of mobile
computers, phones, and internet access, computer assisted personal interviewing (CAPI) is now more commonly used than PAPI. CAPI is “survey data collection by an in-person interviewer (i.e. face-to-face interviewing) who uses a computer to administer the questionnaire to the respondent and captures the answers onto the computer” (Olsen, 2008). PAPI is inferior to CAPI in several ways, as survey complexity is limited by PAPI and PAPI increases the potential for data entry errors (e.g. no feedback mechanism if the interviewer records data that are logically inconsistent or impossible) and/or data compilation errors when the data from surveys are aggregated for analysis (MacDonald et al., 2016). CAPI can use mobile survey tools (MSTs) such as SurveyCTO and mWater (mWater, 2017; SurveyCTO, 2017). MSTs and other mobile technologies and their use in water and sanitation are described elsewhere (Fisher, Mann, et al., 2016; Hutchings et al., 2012; MacDonald et al., 2016; Thomson, Hope, & Foster, 2012b)
Sample collection and testing is the collection of environmental samples and testing these
in the field or in a laboratory (Bartram & Ballance, 1996). Sample collection and testing can be
combined with other data collection methods (e.g. household, facility, or infrastructure surveys)
12 water infrastructure type; geospatial location).
Active remote data collection systems include crowd-sourcing and fault reporting systems where “end users act as monitoring agents to alert authorities or service providers of operational problems” (Thomson et al., 2012b). Crowdsourcing is “the practice of obtaining needed services, ideas, or content by soliciting contributions from a large group of people and especially from the online community rather than from traditional employees or suppliers” (Merriam-Webster, n.d.).
These systems are dependent upon the subset of the population who will report the problem to the service authority. This requires a person to recognize a problem, know that the problem can be reported, and be able to report the problem (e.g. a person has a mobile phone or access to a web service to submit the problem to the service authority).
Remote sensing includes remote sensors, satellites, and drones that use telemetry to collect data about water and sanitation services (Thomson, Hope, & Foster, 2012a; Thomson et al., 2012b). These are useful for collecting real-time, longitudinal data about specific service processes (e.g. handpump use) or variables related to water and sanitation services (e.g.
groundwater levels). Remote sensors can be placed in water and sanitation infrastructure and
transmit data on outcomes of interest.
13
instruments used obtained population practice Qualitative Interviews, focus
groups, mapping exercises, observations, photographs
Data collector obtaining information from respondent
Small population under study
Qualitative study on processes to improve sustainability of community-managed water systems (Behnke N, 2017)
Surveys – household Computer assisted personal interviewing (CAPI), paper and pencil interviewing (PAPI)
Data collector obtaining information from respondent
Households USAID’s
Demographic and Health Surveys (DHS) and UNICEF’s Multiple Indicator Cluster Surveys (MICS) (The DHS Program, 2015) Surveys – non-
household facility
CAPI, PAPI Data collector obtaining information from facility administrator
Non-household facilities
Service Provision Assessment (SPA) for health care facilities) (The DHS Program, 2011)
Surveys - infrastructure
CAPI, PAPI, sanitary inspection
Data collector making a professional judgment about the infrastructure
Water or sanitation infrastructure
SIASAR rural water supply monitoring initiative (Borja-Vega, Pena, & Stip, 2017).
Sample collection and testing
Water quality test kits, environmental swabbing
Environmental samples collected on site and processed using a mobile test kit or transported to a laboratory for processing
Households or water and sanitation infrastructure
Compartment bag test (for water quality measurement) (Gronewold, Sobsey,
& McMahan, 2017)
Active remote data collection systems
Crowdsourcing systems, online web portals to report service problems
User reports service conditions to the service delivery authority
Not representative of population
Crowdsourcing water quality data (Borden, Borden, & Mistry, 2016)
Remote sensing Remote sensors, satellite measurement and imagery
Remote devices collect data about services
Representative of population under study
The Waterpoint Data Transmitter uses a microprocessor, accelerometer and GPS to transmit data about handpump use (Thomson et al., 2012a).
14
Monitoring is defined as “the task of observing and checking the status, progress, and quality of [water and sanitation services]; and it is a regular, ongoing activity” (Oxford English Dictionary). There are many terms used to describe water and sanitation service delivery monitoring and distinct types include: quality control, surveillance, and input-output-outcome monitoring (Table 2).
Quality control is an internal process conducted by a service provider to ensure it is meeting service delivery standards, such as drinking water standards (i.e. the purpose is to demonstrate the absence of sub-standard services) (WHO, 2011). Fault reporting is a type of quality control.
Adapting available definitions in Table 2, surveillance in a water and sanitation service delivery context is the continuous, systematic collection of data related to water and sanitation service delivery by an independent and/or external agency to determine the occurrence and distribution of service delivery problems and identify actions to improve services to minimum standards. Surveillance is complementary to quality control. The primary distinction is that surveillance is conducted by a separate, independent (oftentimes a government) agency to oversee service provider operations and ensure the reliability and safety of water and sanitation service delivery (Rahman, Crocker, Chang, Khush, & Bartram, 2011).
Input-output-outcome monitoring (sometimes called process or activity monitoring) is the process of measuring water and sanitation service delivery inputs (e.g. human resources,
finances), outputs (e.g. number of water committee meetings held in the past six months), and/or
outcomes (e.g. percent of the population using safely managed sanitation services) to document
status, levels and trends (Kusek & Rist, 2004; Menon, Karl, & Wignaraja, 2009). Information
15
the purpose of input-output-outcome monitoring is to observe changes in the population, systems, and/or services under study (i.e. checking whether policy/program targets and
objectives are being met or not) without eliciting a response from an external actor. Surveillance may have a predefined risk mitigation plan whereas input-output-outcome monitoring does not.
Based on data collection methods currently available, input-output-outcome monitoring is often
conducted less frequently than surveillance (Carrel & Rennie, 2008). Impacts (“positive and
negative, primary and secondary, long-term effects produced by a development intervention,
directly or indirectly, intended or unintended”) are sometimes collected as part of input-output-
outcome monitoring; however, impacts are typically used for research and evaluation and are
therefore beyond the scope of monitoring) per se (Kusek & Rist, 2004; Oxford English
Dictionary).
16
Water and sanitationmonitoring types
literature Surveillance Public health
surveillance
“Public health surveillance is the continuous, systematic
collection, analysis and interpretation of health-related data needed for the planning, implementation, and evaluation of public health practice”(WHO, 2017).
Water supply surveillance
Water supply surveillance is an “investigative activity that is designed to identify faults in water supplies, evaluate their importance to health and identify appropriate actions to improve the water supply”(WHO, 1976) and is conducted by “a
surveillance agency responsible for independent (external) surveillance through periodic audit of all aspects of safety and/or verification testing” (WHO, 2011).
Input-output-outcome monitoring
Performance monitoring
“A continuous process of collecting and analyzing data to compare how well a project, program, or policy is being implemented against expected results”(Kusek & Rist, 2004).
Implementation monitoring
“Implementation monitoring tracks the means and strategies (that is, those inputs, activities, and outputs found in annual or multiyear work plans) used to achieve a given outcome. These means and strategies are supported by the use of management tools, including budgetary resources, staffing, and activity planning” (Kusek & Rist, 2004)
Process/activity monitoring
“Process/activity monitoring tracks the use of inputs and
resources, the progress of activities and the delivery of outputs. It examines how activities are delivered – the efficiency in time and resources.” (Kusek & Rist, 2004)
Quality control Quality control monitoring
“In general, it is the responsibility of the local water authority to ensure that the water it produces meets the quality defined in drinking water standards” (WHO, 1984)
Operational monitoring
“the conduct of planned observations or measurements
to assess whether the control measures in a drinking-water system are operating properly. It is possible to set limits for control measures, monitor those limits and take corrective action in response to a detected deviation before the water becomes unsafe”
(WHO, 2011)
Fault-reporting “A maintenance concept that increases operational availability and that reduces operating costs through three mechanisms: reduce labor intensive diagnostic evaluation, eliminate diagnostic testing downtime and provide notification to management for degraded operation” (US Navy Operations, n.d.)
Types and definitions of service delivery research
Several types and many definitions of service delivery research are used in global health and international development (Table 3). The principal types are operational research,
implementation research, and health systems research (Remme et al., 2010).
17
delivery research andaudience
from the literature Operational research
Intended audience: local government,
implementing
organizations, program managers
Action research “disciplined process of inquiry conducted by and for those taking the action. The primary reason for engaging in action research is to assist the “actor” in improving and/or refining his or her actions.” (Sagor, 2000)
Operations research
“The discipline of applying advanced analytical methods, such as mathematical models, to help make better decisions” (Institute for Operations Research and Management Sciences)/
Operational evaluation
“Examines how effectively programs were implemented and whether there are gaps between planned and realized outcomes”
(Khandker, Koolwal, & Samad, 2010) Operational
research
Uses an existing resource – the data routinely collected by programs – to provide ways of improving program operations and thereby delivering more effective, efficient and equitable care (Hales et al., 2016)
Operational research
“The search for knowledge on interventions, strategies, or tools that can enhance the quality, effectiveness or coverage of programs” (Zachariah et al., 2009)
Operational research
“Any type of improvement-oriented investigation into a program’s operations” (Royston, 2011)
Continuous Quality Improvement
“Enlisting an entire organization to work toward a goal of continuous improvement in quality as defined by the needs and wants of the customer [Or end user]” (Kritchevsky & Simmons, 1991).
Management science
“Interdisciplinary branch of applied mathematics, engineering and sciences that use various scientific research-based principles, strategies, and analytical methods including mathematical modeling, statistics and algorithms to improve an organization's ability to enact rational and meaningful management decisions.”
(Institute for Operations Research and Management Sciences) Implementation research
Intended audience: local government,
implementing
organizations, program managers
Implementation science
“Study of methods to promote the systematic uptake of research findings into routine clinical practice” (Eccles & Mittman, 2006).
Implementation research
“Implementation research often focuses on the strategies needed to deliver or implement new interventions called 'implementation strategies', a term used to distinguish them from clinical and public health interventions.” (Peters, Tran, & Adam, 2013) Process
evaluation
“Explore the way in which the intervention under study is implemented, can provide valuable insight into why an intervention fails or has unexpected consequences, or why a successful intervention works and how it can be optimized.”
(Craig et al., 2008) Process
evaluation
“An evaluation of the internal dynamics of implementing organizations, their policy instruments, their service delivery mechanisms, their management practices, and the linkages among these” (Kusek & Rist, 2004)
Process evaluation
“Process evaluation examines how programs operate and focuses on problems of service delivery.” (Khandker et al., 2010) WaSH systems research Health policy and
systems research
“Production of new knowledge to improve how societies organize themselves to achieve health goals.” (Bennett, Ghaffar, Mills, Yesudian, & Mandelbaum-Schmidt, 2007)
18
makers systems, organizational structures and processes, health
technologies, and personal behaviors affect access to health care, the quality and cost of health care, and ultimately our health and well-being. Its research domains are individuals, families, organizations, institutions, communities, and populations.” (Lohr
& Steinwachs, 2002) Health policy and
systems research
“Health policy and systems research (HPSR) is an emerging field that seeks to understand and improve how societies organize themselves in achieving collective health goals, and how different actors interact in the policy and implementation processes to contribute to policy outcomes. By nature, it is inter- disciplinary, a blend of economics, sociology, anthropology, political science, public health and epidemiology that together draw a comprehensive picture of how health systems respond and adapt to health policies, and how health policies can shape − and be shaped by − health systems and the broader determinants of health.” (Bennett et al., 2007)
The purpose of operational research is to use project or program data, or sub-national administrative data (e.g. district, region) to aid decision-making in complex service delivery problems (Remme et al., 2010). Characteristics of operational research include the use of
routinely collected data (e.g. monitoring data) and/or data collection related to the program under study; the use of analytical models such as optimization modelling, network modelling, and forecasting to identify performance or operations improvement opportunities (Hales et al., 2016;
Institute for Operations Research and Management Sciences; Khandker et al., 2010; Zachariah et al., 2009). Data used in operational research may be quantitative or qualitative (Monks, 2016).
Continuous quality improvement, which uses methods such as Lean Six Sigma, is a type of operational research that uses data to identify improvements addressing a problem defined at the outset of each improvement cycle (Breyfogle III, 2003). Operational research sometimes
involves collaboration between researchers and practitioners on the design and planning of the data collection; and the analysis and reporting of findings. In some instances, the practitioner and researcher may be the same actor; in other cases, a researcher may analyze secondary data
without having contributed to the design of the data collection. Cross-sectional, case-control, and
19
randomized controlled trials (RCTs) are not (Zachariah et al., 2009).
The purpose of implementation research is to use data to explore efficiency,
effectiveness, and impact of processes and programs to scale programs or interventions (Remme et al., 2010). Implementation research is sometimes called process evaluation (Centers for Disease Control, 2005). Implementation research studies may include two phases: the first consisting of formative research to explore implementation challenges and a second quantitative, experimental phase (Peters et al., 2013; Remme et al., 2010). Findings from operational research or the formative implementation research might be tested at scale. Data for implementation research studies are usually collected specifically for the research. Like operational research, implementation research usually involves collaboration between practitioners and researchers.
Unlike operational research, experimental study designs are often used in implementation science and studies are designed such that results are transferable outside the geographic area of study (Remme et al., 2010).
Health systems research, or for this context, WaSH systems research, is broad in utility and is used to examine questions associated with the “enabling environment” such as
governance, policy, financing, and human resources factors that influence water and sanitation service delivery (Amjad, Ojomo, Downs, Cronk, & Bartram, 2015; Remme et al., 2010). Studies are usually descriptive and use secondary data, such as monitoring data. Researchers are
typically not involved in the design or collection of the data used in systems research. Like
operational research, different methods can be used for analysis. Systems research is usually
conducted at a larger-scale than other types of service delivery research and may include country
20
systems research study designs are non-experimental (Remme et al., 2010).
Table 4 describes the relationship between data collection methods, monitoring types, and service delivery research types. Figure 1 describes the relationship between operational, implementation, and WaSH systems research.
Table 4. The relationship between data collection methods, monitoring types, and service delivery research types
Data collection method
Type of monitoring where the data collection method can be used
Type of Service Delivery Research where the data collection method can be used
Qualitative data
collection Input-output-outcome monitoring Operational research Surveys – household Surveillance, Input-output-outcome
monitoring
Operational research, implementation research, systems research
Surveys - non- household facility
Surveillance, Input-output-outcome monitoring
Operational research, implementation research, systems research
Surveys - infrastructure
Surveillance, Input-output-outcome monitoring, quality control
Operational research, implementation research, systems research
Active remote data
collection systems Surveillance Operational research
Remote sensing Surveillance, Input-output-outcome
monitoring, quality control Operational research, implementation research Sample collection
and testing
Surveillance, Input-output-outcome monitoring, quality control
Operational research, implementation research, systems research
21
Definition and characteristics of water and sanitation service delivery research
Building on available definitions, we define water and sanitation service delivery
research as the collection, use, and analysis of data on water and sanitation systems to improve
service delivery. Data used in water and sanitation service delivery research are obtained from
monitoring and/or they are collected for a specific purpose (e.g. evaluation, research). This may
include data (such as GIS layers) collected and managed for wholly independent purposes. Data
for service delivery research may be quantitative or qualitative. In good practice, data end-users
(e.g. researchers, policy makers) work with data collectors early in the data collection design
process. Examples of variables related to water and sanitation service delivery include water
system functionality, costs of services, availability of safely managed services, use and
effectiveness of water safety plans, and failure points and modes of failure of projects and/or
programs. Water and sanitation service delivery research typically does not examine health
22
laboratory-based studies lacking a field component (e.g. assessing the effectiveness of a household water filter in removal of viruses in a laboratory setting), perceptions (unless they explicitly relate to service delivery improvements), or any basic research related to water and sanitation. Data analysis can be used to identify improvement pathways and failure modes, for example, exploring the relationship between a service delivery outcome or process and variables hypothesized to have an association with the outcome or process in order to identify patterns and/or test hypotheses (Breyfogle III, 2003).
Examples of water and sanitation service delivery studies
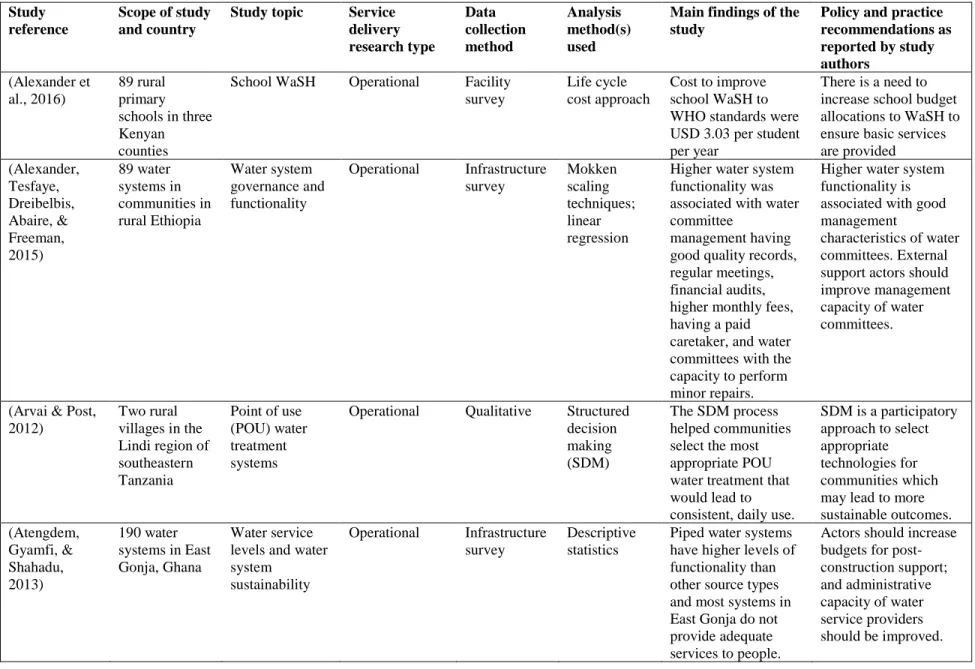
Table 5 presents a selection of water and sanitation service delivery studies (meeting the
inclusion criteria described in the methods) that demonstrate the breadth of topics and methods
of analysis. Studies listed were conducted in diverse settings such as schools and communities,
and in different countries and geographic contexts. The service outcomes examined include
water system functionality, the use of shared sanitation facilities, and country performance on
drinking water and sanitation. Methods such as Bayesian network modeling, frontier analysis,
structural equation modeling (SEM), factor network analysis, and logistic regression were used
by study authors to analyze data.
23
Table 5. Examples of water and sanitation service delivery research studies
Study reference
Scope of study and country
Study topic Service delivery research type
Data collection method
Analysis method(s) used
Main findings of the study
Policy and practice recommendations as reported by study authors
(Alexander et al., 2016)
89 rural primary schools in three Kenyan counties
School WaSH Operational Facility survey
Life cycle cost approach
Cost to improve school WaSH to WHO standards were USD 3.03 per student per year
There is a need to increase school budget allocations to WaSH to ensure basic services are provided (Alexander,
Tesfaye, Dreibelbis, Abaire, &
Freeman, 2015)
89 water systems in communities in rural Ethiopia
Water system governance and functionality
Operational Infrastructure survey
Mokken scaling techniques;
linear regression
Higher water system functionality was associated with water committee
management having good quality records, regular meetings, financial audits, higher monthly fees, having a paid caretaker, and water committees with the capacity to perform minor repairs.
Higher water system functionality is associated with good management
characteristics of water committees. External support actors should improve management capacity of water committees.
(Arvai & Post, 2012)
Two rural villages in the Lindi region of southeastern Tanzania
Point of use (POU) water treatment systems
Operational Qualitative Structured decision making (SDM)
The SDM process helped communities select the most appropriate POU water treatment that would lead to consistent, daily use.
SDM is a participatory approach to select appropriate technologies for communities which may lead to more sustainable outcomes.
(Atengdem, Gyamfi, &
Shahadu, 2013)
190 water systems in East Gonja, Ghana
Water service levels and water system
sustainability
Operational Infrastructure survey
Descriptive statistics
Piped water systems have higher levels of functionality than other source types and most systems in East Gonja do not provide adequate services to people.
Actors should increase budgets for post- construction support;
and administrative capacity of water service providers should be improved.
24
(Barstow, Nagel, Clasen,
& Thomas, 2016)
70 of the 96 sectors in the Western province of Rwanda (101,000 households)
Adoption of household water filtration through private financing
Implementation research (process evaluation)
Household survey
Descriptive statistics and process evaluation
Reported use of water filters was higher than 90%; water filter present was observed in 76% of households
Private financing of public health
interventions can lead to large scale adoption of high levels of household water filtration (Chatterley et
al., 2014)
16 schools in Meherpur, Bangladesh
Post-
implementation management of school sanitation
Operational Facility survey
Qualitative comparative analysis (QCA)
Characteristics of well-managed school sanitation include quality construction of sanitation,
financial support from communities and government, a maintenance plan, and an active management committee.
Financial support and supportive local actors are necessary for well- managed sanitation and may lead to better sanitation-related outcomes in schools.
(Divelbiss, Boccelli, Succop, &
Oerther, 2013)
286 households in rural Guatemala
Household water treatment
Operational Household survey
Structural equation modeling
Personal hygiene practice promotes proper operations and maintenance of household water filters.
There are synergistic effects of operations and maintenance and other household factors on filter quality.
(Fisher et al., 2015)
1,509 water systems in the Greater Afram Plains, Ghana
Water system functionality
Operational Infrastructure survey
Logistic regression;
Bayesian network modeling
Synergistic effects of optimal management and tools substantially increase the
likelihood that a water system is functional.
There is a need to improve water system management and repair times to improve pathways to speed the time of repairs.
(Foster, 2013) National-scale analysis in Liberia, Sierra Leone, and Uganda
Handpump functionality
Operational Infrastructure survey
Logistic regression
System age, distance from the district capital, and the absence of fee collection were significantly associated with
There is a need to strengthen post- construction support;
operations and maintenance; and evaluate alternate water
25
handpump non- functionality.
system management models.
(Heijnen, Rosa, Fuller,
Eisenberg, &
Clasen, 2014)
National-scale analysis in 84 LMICs
Determinants of shared sanitation
Operational Household survey
Meta- analysis;
regression
Shared sanitation is more common in urban areas; results vary geographically;
and is more often used by poorer people. Most sanitation facilities are shared with acquaintances rather than the public.
Uniform national policies on shared sanitation may be difficult to implement within different countries due to varied use by economic status and geographically.
(Jordanova et al., 2015)
12
municipalities in Nicaragua
Water and sanitation in schools
Operational Facility survey
Logistic regression
Coverage of water and sanitation in schools in Nicaragua is low; many water systems and toilets are non-functional.
There are substantial sub-national
inequalities in coverage of water and sanitation in schools.
(Kaminsky, 2015)
National-scale analysis in 21 countries
The role of culture in sanitation technology choice
Systems Household
survey
Linear regression
Cultural dimensions of uncertainty avoidance, masculinity- femininity, and individualism- collectivism have statistically significant relationships to sanitation technology choice.
Local culture influences
infrastructure choice; it is important to consider local cultural
preferences in intervention activities which may lead to greater use and uptake of sanitation.
(Karon A, 2017)
Three provinces in Indonesia
Water and sanitation in schools
Implementation Facility survey
Logistic regression
Schools with toilet operation and maintenance funds were more likely to have functional toilets; government monitoring data were comparable to
Indonesian government monitoring data may be a reliable source of data for reporting the SDGs.
26
independently collected survey data.
(Katsi, Siwadi, Guzha, Makoni, &
Smits, 2007)
Three districts in rural Zimbabwe
Multiple water source use
Operational Qualitative Participatory rural appraisal
People need water for productive uses. Use of water for more than drinking is dependent on a number of factors, such as distance to sources, quantity, and quality of water available.
Service providers should consider the water needs of people beyond drinking; to include water for productive uses.
(Luh &
Bartram, 2016)
National-scale analysis in 73 countries
Country progress on sanitation and drinking water
Systems Household
survey
Frontier analysis;
regression
Most countries are making progress towards universal access to water and sanitation. One-third of countries showed a level of progress that was half the
achievable level.
Progress was not related to many national indicators.
Water and sanitation progress does not appear to be linked to social and economic characteristics of countries; rather they may be linked to variations in policies and institutional commitment.
(Mellor, Smith, Learmonth, Netshandama,
& Dillingham, 2012)
Limpopo province, South Africa
Household water filtration
Operational Household survey
Agent-based modeling (ABM)
Improved filter maintenance may contribute to higher microbial compliance.
Filters are ineffective after three years.
Consistent use and maintenance of household filters are important to maintain the durability of ceramic water filters.
(Nagel, Beach, Iribagiza, &
Thomas, 2015)
Three provinces in rural Rwanda
Handpump maintenance models
Operational Infrasturcture survey;
remote sensing
Fractional logit regression
Ambulance and circuit rider models for post-construction support led to higher
Water system asset investment should shift to service delivery
27
water system functionality than nominal maintenance models.
models rather than installation models.
(Sandiford, Gorter, Smith,
& Pauw, 1989)
Rural Nicaragua
Drinking water quality
Operational Household survey
Analysis of covariance (ANCOVA)
An association between rainfall and contamination was observed, and an association between community size and water quality was observed.
Community characteristics are a determinant of water quality. Certain water source types provide greater protection from fecal contamination.
(Saunders et al., 2016)
19 households in informal settlement in Suva, Fiji
Water and sanitation marking exchanges
Operational Qualitative Participatory action research;
systems mapping
The community identified a need for a committee to oversee WaSH activities;
sharing of WaSH maps with actors; and including other WaSH actors in a community forum.
Systems mapping of WaSH can empower community-level collective action and planning.
(Walters &
Chinowsky, 2016)
Two
municipalities in Nicaragua
Rural water service planning
Operational Qualitative Factor network analysis
water system sustainability challenges in a district related to water committee management;
challenges in another district related to finances and community capacity building by external support.
A complex set of factors interrelate and contribute to the sustainability of water services.
28
(Neely &
Walters, 2016)
Rural village in Timor-Leste
Drivers of sustained functionality in rural water services
Operational Household surveys and qualitative
System dynamics modeling;
causal loop diagramming
Robust, reliable water system technologies have an impact on community
satisfaction and water service sustainability.
Incentives are needed to encourage NGO staff to value participatory
approaches rather than just building
infrastructure.