FRAILTY PREVALENCE, ONE-YEAR RISK, AND THE EFFECT OF SMOKING AMONG WOMEN WITH AND WITHOUT HIV INFECTION
Terra Victoria Fatukasi
A dissertation submitted to the faculty of the University of North Carolina at Chapel Hill in partial fulfillment of the requirements for the degree of Doctor of Philosophy in the
Department of Epidemiology in the Gillings School of Global Public Health.
Chapel Hill 2018
Approved by:
Adaora A. Adimora
Stephen R. Cole
Andrew J. Edmonds
Jessie K. Edwards
Deborah R. Gustafson
Ó 2018
Terra Victoria Fatukasi
ALL RIGHTS RESERVED
ABSTRACT
Terra Victoria Fatukasi: Frailty prevalence, one-year risk, and the effect of smoking among women with and without HIV infection
(Under the direction of Adaora A. Adimora)
The gap in life expectancy between people with HIV and the general population is diminishing. However, evidence suggests that people with HIV may be experiencing aging- related conditions at earlier ages. The objective of this dissertation was to estimate the prevalence of frailty, a syndrome of physical vulnerability, estimate the one-year risk of frailty, and examine the effect of smoking on the one-year risk of frailty among women with and at risk for HIV. This project used data from the Women’s Interagency HIV Study
between October 2015 and September 2017. The Fried Frailty Index was used to define frail status as exceeding the threshold for at least three of five frailty components:
slowness, weakness, unintentional weight loss, exhaustion, and low physical activity.
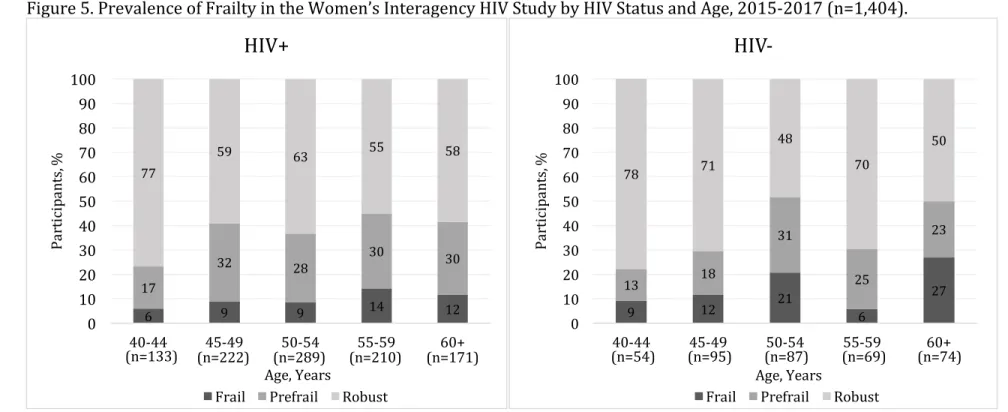
Among 1,404 women with a median age of 52 years (interquartile range: 47-57), we found that frailty prevalence was 11.5% (15.3% HIV-, 10.1% HIV+). The most common frailty components were low physical activity and exhaustion. The one-year risk of frailty was 6.6% (95% confidence interval: 4.1, 9.1) and similar for women with and without HIV.
After adjustment for confounding, current smokers were 1.68 times as likely to become frail compared to non-smokers (95% CI: 0.69, 4.06). Women with high cumulative smoking exposure were 2.72 times as likely to become frail compared to women with low
cumulative smoking exposure (95% CI: 0.96, 7.67), and this latter effect appeared to be
more pronounced among women with HIV (adjusted RR = 4.10; 95% CI: 1.22,
13.78). In a low income, predominately black population of women in their mid-fifties with
and without HIV infection, the prevalence and risk of frailty is comparable to women in the
general population at least 65 years old. Reported smoking exposure is independently
associated with increased frailty risk in this population, even over a one-year period of
follow-up. These findings demonstrate that modifiable risk factors, such as smoking, could
play a crucial role in preventing frailty, especially among people with HIV. Future studies
are needed to investigate trends in frailty risk over time and to examine the long-term
impacts of smoking on frailty among people with HIV.
ACKNOWLEDGEMENTS
I would like to say thank you to my advisor and dissertation committee chair, Adaora Adimora, who has been instrumental in my progress and it has been an honor to learn from her during this process. I would also like to say thank you to my entire
committee, for sharing their time and expertise in helping me with this project and my training as an epidemiologist. Thank you to the researchers, project staff, and participants in the WIHS who have also given their time and insight in helping to refine this project.
Thank you to my friends and family who have shown me tremendous support, kindness,
encouragement, and love throughout this journey. Lastly, a special dedication to my
grandparents, who have overcome so many obstacles and modeled such resiliency that it
inspires me, I am forever grateful.
TABLE OF CONTENTS
LIST OF TABLES ……….. viii
LIST OF FIGURES ……….….. ix
LIST OF ABBREVIATIONS ………... x
CHAPTER 1. BACKGROUND ....………. 1
CHAPTER 2. SPECIFIC AIMS ..……… 11
CHAPTER 3. METHODS ...………. 12
DATA SOURCE ………....……… 12
INCLUSION AND EXCLUSION CRITERIA ……… 16
OUTCOME ………. 18
EXPOSURE ……… 21
COVARIATES ………... 21
STATISTICAL ANALYSIS ……….. 26
CHAPTER 4. PREVALENCE AND ONE-YEAR RISK OF FRAILTY (AIM 1 AND AIM 2) ………. 30
INTRODUCTION ……… 30
METHODS ………. 32
RESULTS ……… 36
DISCUSSION ………. 37
TABLES AND FIGURES ……….. 43
CHAPTER 5. EFFECTS OF SMOKING ON ONE-YEAR RISK FRAILTY RISK (AIM 3) .…….…… 50
INTRODUCTION ……… 50
METHODS ………. 52
RESULTS ……… 56
DISCUSSION ………. 57
TABLES ………... 62
CHAPTER 6. CONCLUSION ………. 67
SUMMARY OF FINDINGS ………. 67
LIMITATIONS ………. 69
IMPLICATIONS AND FUTURE DIRECTIONS ……… 71
REFERENCES ……….. 74
LIST OF TABLES
Table 1. The Fried Frailty Index and operationalization of each frailty
component in the Women’s Interagency HIV Study……… 20
Table 2. Baseline Characteristics of Women’s Interagency HIV Study
Participants, 2015-2017……… 43
Table 3. One-Year Crude and Age-Adjusted Risk Ratio and Risk Difference
for Frailty in the Women’s Interagency HIV Study, 2015-2017……… 49
Table 4. Baseline Characteristics of Sample Participants by Current
Smoking Status in the Women’s Interagency HIV Study, 2015-2017……… 62
Table 5. One-Year Crude and Adjusted Risk Ratios and Risk Differences for
Frailty by Current Smoking Status in the Women’s Interagency HIV Study
Using Inverse Probability of Treatment Weighting, 2015-2017 (n=377)………….. 63
Table 6. One-Year Crude and Adjusted Risk Ratios and Risk Differences for Frailty by Cigarette Smoking Pack-Years in the Women’s Interagency HIV Study Using Stabilized Inverse Probability of
Treatment Weighting, 2015-2017 (n=377)……….. 64
Table 7. One-Year Crude and Adjusted Risk Ratios and Risk Differences for Frailty by Cigarette Smoking Pack-Years Among Women with HIV in the Women’s Interagency HIV Study Using Stabilized Inverse
Probability of Treatment Weighting, 2015-2017 (n=276)……….. 65 Table 8. One-Year Crude and Adjusted Risk Ratios and Risk Differences
for Frailty by Cigarette Smoking Pack-Years Using Alternate Definition in the Women’s Interagency HIV Study and Stabilized
Inverse-Probability-of-Treatment Weighting, 2015-2017 (n=377)……….. 66
LIST OF FIGURES
Figure 1. WIHS Sites, 2018………... 15
Figure 2. Flow Diagram of Study Eligibility, 2015-2017……… 17
Figure 3. Conceptual Model………. 24
Figure 4. Directed Acyclic Graph (DAG) for Smoking and Frailty……… 25
Figure 5. Prevalence of Frailty in the Women’s Interagency HIV Study by
HIV Status and Age, 2015-2017 (n=1,404)……….. 45
Figure 6. Distribution of Frailty Components among Prevalence Sample
in the Women’s Interagency HIV Study by Frailty Status and HIV Status 2015-2017 (n=1,404)……… 46
Figure 7. Most Common Combinations of Frailty Components among Prevalence Sample in the Women’s Interagency HIV Study by
Frailty Status, 2015-2017 (n=1,404)………... 47
Figure 8. Severity of Low Physical Activity and Exhaustion among Prevalence Sample in the Women’s Interagency HIV Study by
Frailty Status, 2015-2017 (n=1,404)………... 48
LIST OF ABBREVIATIONS ART Antiretroviral Therapy
BMI Body Mass Index
CD4 Cluster of Differentiation 4 CHS Cardiovascular Health Study CI Confidence Interval
DAG Directed Acyclic Graph FFI Fried Frailty Index
HIV Human Immunodeficiency Virus IQR Interquartile Range
MACS Multicenter AIDS Cohort Study mL Milliliter
mm
3Millimeter RD Risk Difference RR Risk Ratio
WIHS Women’s Interagency HIV Study VL Viral Load
US United States
CHAPTER 1. BACKGROUND
Many high-income countries, including the United States (US), have seen a shift in population demographics to older ages
[1, 2]. Between 1970 and 2015, US life expectancy at birth increased from 70.8 years to 78.8 years
[3]. According to the Census Bureau, in 1970, 10% (20 million) of the US population was at least 65 years old
[4]. The most recent census in 2010 estimated this figure to be 13% (40 million), but it is projected to be over 20% by 2030 (73 million)
[5]. As early as 2035, older adults are projected to outnumber children for the first time in US history
[5]. One major driving factor for these changes over time has been declining mortality in late-life from leading causes of death, including cardiovascular
disease and cancer
[6].
Despite these strides, certain populations still demonstrate marked disparities in
life expectancy and mortality
[5, 7, 8]. For example, the life expectancy for black non-Hispanics
was 75.1 years in 2015
[7]. Between 2001 and 2014, the gap in life expectancy between the
poorest 1% and richest 1% of individuals was 15 years for men and 10 years for women
[9].
During this same period, life expectancy increased by three years for those in the highest
quartile of the income distribution, while it remained the same for those in the lowest
quartile
[9]. Social and structural factors play a critical role in shaping patterns of healthcare
access and health-related behaviors among these populations
[10].
The life expectancy for people with HIV has rapidly improved over recent years due to the increased effectiveness and use of antiretroviral therapy (ART)
[8, 11]. One recent study estimated that 20-year-olds on ART can expect to live into their early 70s
[8]. There are currently over 1.2 million adults and adolescents living with HIV infection in the US
[12]. In 2014, 45% of people with HIV in the US were aged 50 and older
[13]. This is projected to increase to more than 50% by 2020
[14-16]. Even with advancements in treatment, there are still disparate outcomes in life expectancy and mortality for people with HIV compared to the general population
[8].
Earlier in the HIV/AIDS epidemic, differences in life expectancy between HIV- seropositive and HIV-seronegative individuals were mostly attributed to AIDS-related conditions
[8, 11]. However, since the introduction of ART, incidence rates for AIDS-related conditions have declined, but incidence rates for non-AIDS-related conditions among people with HIV has been increasing
[11, 15]. One study estimated that among a cohort of nearly 40,000 patients initiating ART between 1996 and 2006, over 50% of causes of death were not AIDS-related
[17]. Another study estimated that 70% of causes of death were not AIDS-related among a cohort of nearly 50,000 individuals in Europe, Australia, and the US receiving care between 1999 and 2011
[18]. Among non-AIDS-related deaths, the leading causes of death were non-AIDS malignancies, cardiovascular disease, and liver disease
[17,18]
. Reducing non-AIDS-related conditions continues to be an important priority for improving health outcomes and survival among people with HIV.
Evidence suggests that relative to the general population, people with HIV are at an
increased risk for many non-AIDS conditions that are associated with aging, and these
include cardiovascular disease, some cancers, renal disease, lung disease, liver disease,
osteoporosis, neurocognitive disorders, and frailty
[19]. Many of these increased risks among people with HIV persist even after accounting for treatment and traditional risk factors
[19]. From 1992 to 2003, a US prospective cohort study of 54,780 individuals found higher incidence rates for anal, colorectal, liver, lung, renal, and vaginal cancer; Hodgkin lymphoma, leukemia, and melanoma for those with HIV than in the general population after adjustment for age, sex, and race
[20]. A systematic reviewed estimated that the risk ratio for cardiovascular disease comparing people with HIV not on ART to the general population was 1.61 [95% CI: 1.43, 1.81], while it was 2.00 [95% CI: 1.70, 2.37] comparing people with HIV on ART to the general population
[21]. There is also concern that people with HIV may also be experiencing some aging-related conditions at earlier ages
[15, 19]. A case-control study with over 10,000 Italian participants who were 46 years old on average between 2002 and 2009, found that the prevalence of noninfectious comorbidities for each age stratum was higher for those with HIV than in matched controls
[19].
The exact mechanisms for these differences remain unclear, but researchers
hypothesize that accelerated aging processes in people with HIV are likely to occur through
processes that influence immunodeficiency and chronic inflammation
[15, 22]. Specifically a
combination of processes that include oxidative stress, telomere inhibition, telomere
shortening, and lamin A mutations and accumulations are likely to result in increased risks
for many of these aging processes and conditions among people with HIV
[22]. A study
among 486 South Africans examined two validated biomarkers of aging, and found shorter
telomere length and higher CDKN2A, both reflective of older age, among HIV-seropositive
individuals compared to HIV-seronegative individuals
[23]. These processes could result
from the presence of HIV infection itself, the side effects of ART, or an increased burden of risk factors that promote aging among people with HIV
[15, 22, 23].
One aging-associated condition, frailty, is a syndrome of physical weakness that has been associated with higher risks of falls, hospitalization, institutionalization, and death
[24,25]
. The Fried Frailty Index (henceforth, FFI), a tool validated in the Cardiovascular Health Study (CHS), is one measure used to operationalize the frailty phenotype based on five components: weakness, slowness, unintentional weight loss, low activity, and
exhaustion
[24]. Frailty, disability, and comorbidity are often thought to be synonymous and highly concordant. Defined by the FFI, 46% of frail adults had at least one comorbid
condition, 6% had activity daily living (ADL) disability, 22% had both comorbidity and ADL disability, and 27% did not have comorbidity or ADL disability
[24]. Frail adults were at an increased risk for several outcomes, even after adjustment for age, gender, race, subclinical and clinical disease, disability, socioeconomic status, health status, depressive symptoms, income, and smoking status
[24]. The adjusted hazard of death over a three-year period of follow-up among 5,317 individuals at least 65 years of age in the CHS was 1.63 for frail adults compared to non-frail adults [95% CI: 1.27, 2.08]
[24]. Frailty, a syndrome of physical weakness, is an aggregate expression of decreased physiological function that is associated with age or disease
[24, 26].
Another prospective cohort study with over 40,000 participants in the Women’s
Health Initiative- Observational Study (WHI-OS) aged 65-79 found that over three years of
follow-up, frail women had 1.71 times the hazard of death [95% CI: 1.48, 1.97] and 1.57
times the hazard of hip fracture [95% CI: 1.11, 2.20], adjusting for other factors including
comorbid conditions
[25]. Over the same period of follow-up, frail women had 1.95 times the
risk of number of average hospitalizations [95% CI: 1.72, 2.22] and 3.15 times the risk of incident ADL disability [95% CI: 2.47, 4.02] compared to non-frail women, adjusting for other factors
[25]. Among 1230 participants from aging injection drug users (IDUs) in the AIDS Linked to the IntraVenous Experience (ALIVE) cohort, HIV-negative frail IDUs had 2.63 times the rate of death compared to HIV-negative non-frail IDUs [95% CI: 1.23, 5.66], while HIV-positive non-frail IDUs had 3.29 times the rate of death [95% CI: 1.85, 5.88], and HIV-positive frail IDUs had 7.06 times the rate of death [95 CI: 3.49, 14.30], after
adjustment for age, gender, race, education, and comorbid conditions
[27].
Frail adults also have higher healthcare expenditures relative to the non-frail
[28, 29]. A recent study of a cohort of older people from two Australian states found that healthcare costs increased 22% and 43% over a six-month period for individuals with intermediate and high frail status, respectively, compared to non-frail individuals
[29]. Another recent study of a cohort of older Germans aged 50-75 found an association between frailty and increased healthcare costs, adjusting for socio-demographic factors and comorbidity
[28]. This study found that the average total healthcare costs for non-frail individuals over a three-month period were €642, followed by €1014 for pre-frail individuals, €1616 for frail individuals with three components, and €3659 for frail individuals with four or five
components
[28].
A systematic review of twenty-one community-based cohorts of individuals aged 65
and older shows that global frailty prevalence in the general population varies widely,
ranging from 4% to 59%, with a weighted average of 10.7%
[30]. One study among a
nationally representative sample of 7,439 Medicare enrollees aged 65 years and older in
the National Health and Aging Trends Study estimated US frailty prevalence at 15% in
2011
[31]. Research on interventions among frail individuals have targeted the prevention of worsening frailty and the improvement of clinical outcomes following the onset of frailty
[32,33]
. Using the FFI, limited studies in the general population of women aged 70-79 have found slowness, weakness, and low physical activity to be the most common frailty
criteria
[24, 33]. Some studies suggest that exercise and nutritional interventions can delay the onset of frailty and improve its symptoms
[34-37]. One study among 216 frail participants in Sydney, Australia who were 83 years old on average treated by clinicians working within rehabilitation and aged care services, found that tailored interventions targeting identified characteristics of frailty reduced frailty and improved mobility over a 12-month period compared to usual care
[33]. For example, these tailored interventions for meeting each individual frailty component could include consultation with a dietitian for weight loss, referral to a psychiatrist for exhaustion, home-based physiotherapy sessions for weakness, or several other interventions
[33]. Studies show that resistance exercise training can
increase strength in older adults, despite age-associated decreases in muscle mass
[34]. In addition to older adults, women, racial/ethnic minorities, those with low socioeconomic status, and people with HIV are more likely to be frail
[24, 31, 38]. After
validating the FFI, the CHS estimated baseline frailty prevalence was higher among women
than men (7% vs. 5%)
[24]. Among participants in the National Health and Aging Trends
Study frailty prevalence was also higher among women than men (17% vs. 13%)
[31]. The
same study estimated that the prevalence of frailty among Hispanics and black non-
Hispanics was 25% and 23%, respectively, while it was 14% for white non-Hispanics
[31].
Another cross-sectional analysis in the Women’s Health and Aging Studies among 727
women aged 65 and older, observed that women with less than a high school education
were 3.0 times as likely to be frail than those with more than a high school education [95%
CI: 2.0, 4.5], adjusting for age, race, insurance status, smoking status, and comorbidities
[39]. Women with an annual household income less than $10,000 were 2.0 times as likely to be frail [95% CI: 1.3, 3.2], adjusting for other factors
[39]. This study observed that blacks were more likely to be frail than whites in unadjusted models, race was no longer associated with frailty after including measures of socioeconomic status in adjusted models (OR = 0.98 [95% CI: 0.64, 1.98])
[39].
A systematic review focusing on cohorts of people with HIV primarily in the US found that frailty prevalence ranged from 5% to 29%
[40]. However, in this review, the highest median age was 57 years, compared to the previous review estimating a weighted frailty prevalence of 11% among adults aged 65 and older in the general population. In studies with HIV-seronegative controls, the prevalence of frailty was consistently higher at earlier ages for people with HIV
[40]. A recent cross-sectional analysis of the Women’s Interagency HIV Study (WIHS) among 2,028 women who were on average 39 years of age using frailty data from 2005 found 17% and 10% frailty prevalence among women with HIV and women at risk for HIV, respectively
[38]. These data suggest that frailty is more common among people with HIV, and the prevalence of frailty among younger people with HIV may be comparable to those aged 65 and older in the general population.
There are limited studies describing the distribution and most common
combinations of frailty components in the general population, but this remains unknown
for PLWH in the US. The Australian study among receiving rehabilitation and aged care
services, found that low physical activity and exhaustion were the most common frailty
components at 65% and 63%, followed by weakness at 7% among older adults with a
mean age of 83 years
[33]. Given that in this population, tailored interventions targeting individual frailty components reduced frailty and improve mobility over a 12-month period among frail adults, it is important to examine and identify whether similar frailty
components can be targeted among people with HIV
[33]. Identification of common frailty components among people with HIV can serve as targets in pinpointing those who could benefit from interventions that help prevent frailty among non-frail adults and lessen the severity of frailty among frail adults.
There are limited longitudinal studies of frailty in the US general population. The original study validating the FFI among 5,317 men and women at least 65 years old in the CHS reported the four-year risk of frailty was 7%
[24]. The Women’s Health Initiative
Observational Study (WHI-OS) among a nationally representative sample of 40,657 women in the general population aged 65-79 reported the three-year risk of frailty was 15%
[25]. To our knowledge there are only two longitudinal studies of frailty in people with HIV, and both were conducted in the MACS cohort which includes only men
[41, 42]. In the MACS, assessing data on 2,150 men from each six-month visit collected between 1994 and 1996, men with HIV across all durations of infection had a higher prevalence of frailty than men without HIV
[41]. Looking across all visits, this study estimated that men with HIV were 11.0 times (95% CI: 6.4, 18.9) as likely to be frail compared to men with HIV, and men with longer durations of HIV were associated with increased frailty prevalence
[41]. The
estimated frailty prevalence for a 55-year-old man who had been living with HIV infection
no more than four years was 3.4% (95% CI: 1.3, 8.6), and the same as an HIV-uninfected
man of the same race/ethnicity and education who was at least 65 years old
[41]. Another
MACS analysis on 1,946 men found that between 2007 and 2011, the odds of developing
frailty was associated with a history of AIDS but not with HIV infection alone
[42]. After adjustment for other factors, men with HIV and a history of AIDS were 2.3 times as likely to become frail over the next study visit compared to men without HIV (95% CI: 1.5, 3.4)
[42]. Though women are more likely to develop frailty, there are no longitudinal studies of frailty among women with HIV and the risk of frailty remains unknown in this population
Some studies have suggested there may be a link between smoking and frailty
[25, 38,42, 43]
. Cross-sectional studies have reported higher frailty prevalence among smokers than in non-smokers among those 65 years and older
[25, 38, 44]. Limited longitudinal data on smoking and frailty have suggested that smoking is an independent risk factor for frailty in the general population
[25, 43]. Smoking is a cause of many chronic diseases associated with aging, including cardiovascular disease, respiratory disease, and cancer
[45, 46]. For example, among a nationally representative sample of US adults aged 35 and older, it was estimated that in 2011, 48.5% of deaths from 12 cancer sites were attributable to cigarette smoking;
these sites included cancers of the colorectum, esophagus, kidney and renal pelvis, larynx, liver and intrahepatic bile duct, myeloid leukemia, oral cavity and pharynx, pancreas, stomach, urinary bladder, uterine cervix, and lung, bronchus, and trachea
[47]. The CDC estimates that 33% of deaths from cardiovascular disease are attributable to cigarette smoking
[46]. There are several pathways by which smoking causes a variety of diseases, which can include increased levels of inflammatory markers and enhanced oxidative stress
[48].
Smoking is more common among people with HIV than in the general population
[49,50]
. A nationally representative study among over 30,000 US adults from the Medical
Monitoring Project and National Health Interview Survey estimated that while smoking
prevalence was 21% among US adults in the general population in 2009, it was 42% among people with HIV receiving medical care
[49]. People with HIV who smoke are at increased risk for many HIV-related and non-HIV-related conditions compared to people with HIV who do not smoke, a few of which include bacterial pneumonia, lung cancer, heart disease, and COPD
[51-53]. As mentioned previously, HIV infection is also an important risk factor for many of these aging-associated conditions, independent of traditional risk factors such as smoking
[54]. It is presumed that one pathway by which smoking and HIV infection can cause aging-related disease is through their independent associations with increased levels of inflammatory markers
[54]. It is plausible that some of the same mechanisms by which smoking causes aging-related disease among people with HIV can similarly result in increased frailty among this population
[53].
Smoking is a modifiable risk factor that could have a high impact for reducing frailty among people with HIV, where smoking is highly prevalent. To our knowledge, there are no US studies estimating the independent effect of smoking on incident frailty. In the WHI-OS cohort, current smokers were 2.9 times as likely to develop frailty over a three-year period of follow-up compared to never smokers (95% CI: 2.4, 3.6)
[25]. However, though a risk factor for frailty, the independent effect of smoking on the risk of frailty adjusting for other confounding factors was not determined. One recent longitudinal study among a nationally representative sample of 2,542 adults aged 60 and older in England found an independent association between current smoking and the four-year risk of frailty (OR = 1.60; 95% CI:
1.02, 2.51)
[43]. The effect of smoking on frailty among people with HIV remains unknown.
CHAPTER 2. SPECIFIC AIMS
This project will use data from a prospective, interval cohort of participants in the Women’s Interagency HIV Study (WIHS). Comparing women with HIV and women without HIV, this research aims to:
Aim 1: Evaluate the distribution of frailty components among both frail and non- frail women. Using current data, we hypothesize that the most common frailty component and most common combination of frailty components will differ between women with HIV and women without HIV due to potential differences in the processes of biological aging.
Aim 2: Assess the one-year risk of frailty. Using existing data from 2015 to 2017, we hypothesize that the incidence of frailty will be higher in women with HIV compared to women at risk for HIV, due to accelerated aging processes among the expanding population of people with HIV.
Aim 3: Estimate the effect of smoking on the one-year risk of frailty. Using existing data from 2015 to 2017, we hypothesize that the effect of smoking on incident frailty will be higher for women with HIV compared to women at risk for HIV due to smoking-related increases in the risk of both HIV-related and non-HIV-related conditions, including
premature death, among people with HIV.
CHAPTER 3. METHODS
DATA SOURCE
This project will use observational data from the WIHS cohort. The WIHS was
established in August 1993, making it the largest U.S. cohort study of women with or at-risk for HIV infection
[55]. Until 2012, the WIHS was comprised of six consortia, some of which comprised multiple clinical subsites
[55]. These six WIHS sites were located in
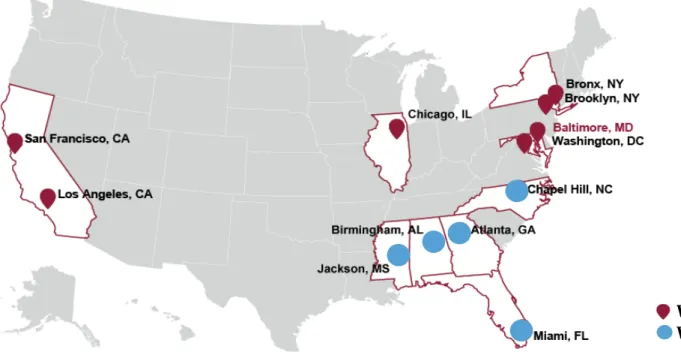
Bronx/Manhattan, NY; Brooklyn, NY; Los Angeles/Southern California/Hawaii; San Francisco, CA; Chicago, IL; and Washington, DC (shown in Figure 1). The WIHS initially enrolled 2,059 HIV-positive women and 569 HIV-negative women between October 1, 1994 and November 15, 1995, and another 738 HIV-positive women and 403 HIV-negative women between October 1, 2001 and September 30, 2002
[55, 56]. Beginning in 2013, the WIHS closed its Los Angeles/Southern California/Hawaii consortium and added four new Southern sites, including Atlanta, GA; Chapel Hill, NC; Miami, FL; and Birmingham,
AL/Jackson, MS (Figure 1)
[57].
The WIHS is a prospective, interval cohort with semi-annual follow-up visits
[64, 65].
The WIHS includes interview, physical examination, and laboratory data from HIV-positive
women and HIV-negative women, aged 18 years and older, recruited from primary care
clinics, hospital-based programs, research programs, community outreach sites, women’s
support groups, drug rehabilitation programs, HIV testing sites, and referrals from enrolled
participants
[55, 56]. At these semiannual visits, the following data are collected:
medication data including a detailed form on medications used as prophylaxis and/or treatment and adherence; physical and gynecologic examinations; detailed questionnaires regarding medical history, health services utilization, sexual behaviors, demographics and psychosocial characteristics; neuropsychological screening and examination; and
laboratory testing of specimens, including plasma and serum for CD4+ T-cells and HIV-1 RNA viral load
[55, 56]. Institutional review board approval was obtained at each site and written informed consent was obtained from all women.
The WIHS was actively following 2,363 women as of 2016
[57]. The median age was 51 (Interquartile Range [IQR]: 44, 56) for women with HIV and 49 (IQR: 41, 55) for women without HIV
[57]. The majority of the WIHS cohort is non-white; 72% of women are black non-Hispanic, 15% are Hispanic, 10% are white non-Hispanic, and 4% are other racial groups. Across all waves, 25% of participants have died (9% for HIV-; 31% for HIV+) and 8% were lost to follow-up (12% for HIV-; 7% for HIV+)
[57]. About one-third of the cohort has less than a high school education (31% for HIV-; 33% for HIV+) and the majority of participants report an annual household income no more than $18,000 (56% for HIV-; 64%
for HIV+)
[57]. Women with HIV are more likely to report having health insurance (95%) than women without HIV (79%). The proportion of women who reported injection drug use (IDU) at study entry is 15%, but only 1% of women reported current IDU in the past six months
[57].
With respect to clinical characteristics of the WIHS cohort, the median CD4 cell
count is 628 (IQR: 435, 853) for women with HIV compared to 1011 (IQR: 815, 1280) for
women without HIV
[57]. The majority of women with HIV have an undetectable viral load
that is less than 20 copies/mL (69%)
[57]. Among all women in the cohort, 21% have diabetes, 15% have history of an adverse cardiovascular event, and 5% have history of cancer
[57]. Lastly, 9% of women have active hepatitis C virus (HCV) infection confirmed by positive HCV RNA testing (7% for HIV-; 10% for HIV+)
[57].
Figure 1. WIHS Sites, 2018.
WIHS I – IV (1994)
WIHS V (2013)
15
INCLUSION AND EXCLUSION CRITERIA
The analyses for this project was restricted to women at least 40 years of age with at least one frailty assessment in the study period between October 1, 2015 and September 30, 2017, corresponding to WIHS visits 43 through 46. Of 1,669 women, there were 265 women with missing data on at least one component of the frailty outcome (Figure 2).
Consequently, there were 1404 women in the study sample for aim 1; 378 women in the study sample for aim 2; and 377 women in the study sample for aim 3.
Figure 2. Flow Diagram of Study Eligibility, 2015-2017.
Aim 3. Smoking and Frailty Risk n = 377
Aim 1. Prevalence n = 1404
Excluded:
• Missing grip strength and/or walking speed measurement (n=242)
• Missing both (n=150)
• Missing grip strength (n=30)
• Missing walking speed (n=62)
• Missing at least one of other three frailty components (n=23)
Aim 2. Frailty Risk n = 378
Excluded:
• Did not have two frailty assessments (n=500)
• Did not have two frailty assessments taken at baseline and a one-year period of follow-up (n=480)
• Frail at baseline visit (n=46)
Excluded:
• Missing data on income (n=1) Assessed for Eligibility
n = 1669
OUTCOME
For all three aims of this project, the outcome of interest was frailty. As a prospective, interval cohort, the WIHS has set dates for each six-month visit interval.
Starting at WIHS visit 43, coincident with October 1, 2015, the WIHS protocol has included measurement of frailty components and assigned frailty status among women who are 40 years of age and older. The Fried Frailty Index (henceforth, FFI), a tool validated in the Cardiovascular Health Study (CHS), is used to operationalize the frailty phenotype based on five components: weakness, slowness, unintentional weight loss, low activity, and
exhaustion
[24]. Frail status was defined as exceeding the component-specific threshold (Table 1) for at least three frailty components, pre-frail status was defined as exceeding the threshold for two frailty components, and robust status was defined as exceeding the threshold for no more than one frailty component
[24]. As in the CHS, two performance- based measures, grip strength and walking speed, operationalized the FFI components of weakness and slowness. Grip strength was measured by squeezing a Jamar dynamometer with maximum force using the dominant hand, and the highest value (greatest strength) of three attempts was used for analysis. Walking speed was measured in seconds by a timed four-meter walk, and the fastest time of two attempts was used for analysis. Three ongoing, prospectively collected self-reported measures in the WIHS operationalized the FFI
components of unintentional weight loss, low activity, and exhaustion
[38].
Performance-based measures are assessed at least every other semiannual visit.
Exhaustion and low physical activity are assessed at every other semiannual visit and
unintentional weight loss is assessed at each semiannual visit. For this project, the most
recent performance-based measurement estimated frailty prevalence, and the most recent
two performance-based measurements estimated the one-year risk of frailty. If any of the self-reported frailty components were missing, the closest previous or subsequent value that occurred within two visits of each performance-based measurement was used. For this project, women who had missing data on grip strength and/or walking speed, and women who did not have self-reported measures within two visits of the performance-based measurement were considered incomplete cases and excluded (Figure 2).
Table 1. The Fried Frailty Index and operationalization of each frailty component in the Women’s Interagency HIV Study.
Frailty Component WIHS Operationalization
Unintentional weight
loss Since your last visit, have you had unintentional weight loss of at least 10 pounds?
a. Yes
a,bb. No
Exhaustion During the past 4 weeks, as a result of your physical health, have you had difficulty performing your work or other activities?
a. All of the time
a,bb. Some of the time
ac. None of the time
Low physical activity Does your health now limit you in vigorous activities, such as running, lifting heavy objects, or participating in strenuous sports?
a. Limited a lot
a,bb. Limited a little
ac. Not limited at all Slowness
(same as CHS) 4-meter walk at usual pace:
a. ≥ 6.13 seconds for height ≤ 1.59 meters
a,bb. ≥ 5.25 seconds for height > 1.59 meters
a,bc. All other values
Weakness
(same as CHS)
Grip strength measured by Jamar dynamometer:
a. ≤ 17.0 kilograms for BMI ≤ 23
a,bb. ≤ 17.3 kilograms for 23 < BMI ≤ 26
a,bc. ≤ 18.0 kilograms for 26 < BMI ≤ 29
a,bd. ≤ 21.0 kilograms for BMI >29
a,be. All other values
Abbreviations: WIHS, Women’s Interagency HIV Study; CHS, Cardiovascular Health Study;
BMI, Body Mass Index
a
Indicates frailty component threshold met (main definition)
b
Indicates frailty component threshold met (restricted definition)
EXPOSURE
For aim three, the two primary exposures of interest were current cigarette
smoking status (smoker or non-smoker) and the number of cigarette smoking pack-years at the baseline visit. At each semiannual visit, women self-report smoking status, with women classified as current smokers if they answer “yes” to the following question: “Since your study visit on…have you smoked cigarettes?” Additional smoking data are collected at each semiannual visit and smoking pack-years were determined based on participants’
self-reported average number of cigarettes or packs smoked per day. To calculate the number of smoking pack-years, the number of packs smoked per day was averaged across all visits with non-missing values and was multiplied by the number of years having smoked. As a sensitivity analysis, we compared our results with those using an alternate definition for smoking pack-years. If the self-reported average number of cigarettes or packs smoked per day at any semiannual visit was missing, the previous non-missing value was carried forward until it was replaced by the next non-missing value. To calculate the number of smoking pack-years using the alternate definition, the number of packs smoked per day across each visit was averaged and multiplied by the number of years having smoked.
COVARIATES
Covariates were determined at the performance-based measurement in prevalence analyses and at the baseline visit of the two performance-based measurements in analyses of frailty risk. If any values for covariates were missing, the last reported value was used.
The following characteristics were used to describe participants:
• HIV status: based on results from enzyme-linked immunosorbent assay and western blot
o indictor for HIV+ diagnosis
• Age: based on year of birth
• Race/ethnicity: based on participants’ self-report
o categorized as white non-Hispanic, black non-Hispanic, other non-Hispanic, Hispanic
• Education: based on participants’ self-report
o categorized as less than high school, high school, more than high school
• Annual household income: based on participants’ self-report
o categorized as ≤$6,000, $6,001-12,000, $12,001-18,000, $18,001-24,000,
>$24,000
• Region: based on geographic location of participants’ WIHS site o categorized as Midwest, Northeast, South, West
• Current cigarette smoking status: based on participants’ self-report o categorized as smoker, non-smoker, former smoker
• Weekly alcohol use: based on participants’ self-report
o categorized as 0 drinks, 0.1-7 drinks, 7.1-12 drinks, > 12 drinks
• Other substance use: based on participants’ self-report o indicator for use of the following recreational drugs:
§ crack cocaine, cocaine, heroin, methadone, methamphetamines,
amphetamines, marijuana, prescription drug abuse, or other
recreational drug use
• Active hepatitis C infection: based on results from HCV RNA testing o indicator for HCV+ result
• HIV viral load: based on results from HIV RNA quantification assays
• CD4 cell count: based on results from flow cytometry
For aim three, a conceptual model (Figure 3) informed by the literature provided a foundation for hypothesized relationships between the exposure of smoking, the outcome of frailty, and various factors. The conceptual model was used to build a directed acyclic graph (DAG) (Figure 4), and the following covariates were included in analyses as potential confounders: age (continuous), race/ethnicity (black non-Hispanic, all other races),
education (<high school, high school, and >high school), annual household income
(≤12,000, >$12,000), region (Midwest, Northeast, South, and West), heavy weekly alcohol use (≤7 drinks, >7 drinks), and any other recreational drug use (yes, no).
Figure 3. Conceptual Model.
24
Figure 4. Directed Acyclic Graph (DAG) for Smoking and Frailty.
Smoking Frailty
Education Age
Heavy Alcohol Use Substance Use HIV Status
Income Race/Ethnicity
Comorbidity
Geographic Region
Health Insurance
Gender
25
STATISTICAL ANALYSES
AIM 1
For aim one, participant characteristics were summarized using counts and
percentages, by HIV status. Frailty prevalence was calculated as the proportion of women who exceeded the threshold for at least three of five frailty components within the study period. We conducted two sensitivity analyses, first to assess the robustness of results to our chosen definition of frailty by using a restricted definition of frailty (shown in Table 1) that includes only the highest values for exhaustion and low physical activity. For example, women had to respond “all the time” to the question, “During the past 4 weeks, as a result of your physical health, have you had difficulty performing your work or other activities?”
in meeting the component-specific threshold for exhaustion. Also, in contrast to the previous WIHS analysis,
[38]we chose to use the cut points for grip strength and walking speed that were validated in the general population by Fried (shown in Table 1), rather than using the highest and lowest quintiles of the distributions from our HIV-seronegative population for walking speed and grip strength, respectively. As a second sensitivity analysis, we compared our results to results obtained when using the average cut points in the previous WIHS analysis for the highest and lowest quintiles for the grip strength and walking speed measures, respectively. Data analyses were performed using SAS software version 9.3 (SAS Institute, Inc., Cary, NC).
AIM 2
For aim two, participant characteristics were summarized using counts and
percentages, by HIV status. The one-year risk of frailty was estimated as the proportion of women from the population at-risk who developed frailty over the one-year risk period.
Log-binomial models were used to estimate crude and age-adjusted one-year frailty risk ratios with 95% confidence intervals (CIs), comparing women with HIV to women without HIV. Linear binomial models were used to estimate crude and age-adjusted one-year frailty risk differences with 95% CIs, comparing women with HIV to women without HIV. Data analyses were performed using SAS software version 9.3 (SAS Institute, Inc., Cary, NC).
AIM 3
For aim three, participant characteristics were summarized according to current smoking status using percent or median with interquartile range (IQR), as appropriate.
Potential confounders were hypothesized from the literature and identified using a directed acyclic graph (Figure 4)
[58]. Stabilized inverse-probability-of-treatment weights were used to produce estimates for the one-year risk of frailty comparing current smokers to non-smokers, and were constructed using two logistic regression models. The first model estimated the unconditional probability of being a current cigarette smoker, and the second model estimated the probability of being a current cigarette smoker conditional on measured covariates. The final stabilized weight for the exposed was the marginal
probability of being a current cigarette smoker divided by the participant’s conditional probability of being a current cigarette smoker. The final stabilized weight for the
unexposed was the marginal probability of not being a current cigarette smoker divided by
the participant’s conditional probability of not being a current cigarette smoker. Key confounders were chosen to be included in the most parsimonious final weighted (adjusted) models if they were associated with the exposure in the conditional logistic regression model (p<0.05). A weighted log-binomial model was used to estimate
multivariable-adjusted risk ratios (RR) for the one-year risk of frailty comparing current smokers to non-smokers. A weighted linear-binomial model was used to estimate
multivariable-adjusted risk differences (RD) for the one-year risk of frailty comparing current smokers to non-smokers. Confidence intervals (CIs) were based on the robust (Huber-White) variance estimator. Smoking pack-years was categorized into quintiles to relax linearity assumptions. The two highest quintiles of the exposure distribution
demonstrated a similar magnitude of effect on the one-year risk of frailty and were chosen as the cutoff for the final contrast comparing high to low cumulative smoking exposure in pack-years (≤7.5, >7.5). As described above, stabilized inverse probability of treatment weights were similarly used to estimate the one-year risk of frailty comparing women whose cumulative smoking exposure was greater than 7.5 pack-years to women whose cumulative smoking exposure was no more than 7.5 pack-years and were constructed using two logistic regression models. The first model estimated the unconditional
probability of smoking >7.5 pack-years and the second model estimated the probability of
smoking >7.5 pack-years conditional on measured covariates. The final stabilized weight
for the exposed was the marginal probability of smoking >7.5 pack-years divided by the
participant’s conditional probability of smoking >7.5 pack-years. The final stabilized weight
for the unexposed was the marginal probability of smoking ≤7.5 pack-years divided by the
participant’s conditional probability of smoking ≤7.5 pack-years. After adjustment for key
confounders, weighted log-binomial and linear binomial models were used to estimate multivariable-adjusted RRs and RDs for the one-year risk of frailty comparing women whose cumulative smoking exposure was greater than 7.5 pack-years to women whose cumulative smoking exposure was no more than ≤7.5 pack-years.
As a sensitivity analysis, we compared our results with those using an alternate definition for smoking pack-years. If the self-reported average number of cigarettes or packs smoked per day at any semiannual visit was missing, the previous non-missing value was carried forward until it was replaced by the next non-missing value. To calculate the number of smoking pack-years using the alternate definition, the number of packs smoked per day across each visit was averaged and multiplied by the number of years having smoked. Data analyses were performed using SAS software version 9.3 (SAS Institute Inc.,
Cary, NC).
CHAPTER 4. PREVALENCE AND ONE-YEAR RISK OF FRAILTY
Introduction
Many high-income countries, including the United States (US), have seen a shift in population demographics to older ages
[1, 2]. Between 1970 and 2014, US life expectancy at birth increased from 70.8 years to 78.9 years
[3]. People with HIV are also living longer due to the increased effectiveness and use of antiretroviral therapy (ART)
[8, 11]. One recent study estimated that 20-year-olds on ART can expect to live into their early 70s
[8]. By 2020, it is estimated that more than half of people with HIV in the US will be age 50 or older
[14, 59]. Despite increased life expectancy, some evidence suggests that people with HIV may be experiencing aging-related conditions at earlier ages relative to the general population
[15,38]
.
One of these aging-related conditions, frailty, is a syndrome of physical weakness that has been associated with higher risks of falls, hospitalization, institutionalization, and death
[24, 25]. Frail adults also have higher healthcare expenditures relative to the non-frail
[28,29]
. One study among a nationally representative sample of 7,439 Medicare enrollees aged 65 years and older in 2011 estimated frailty prevalence at 15%
[31]. In addition to older adults, people with HIV, women, racial/ethnic minorities, and those with low
socioeconomic status (SES) are more likely to be frail
[24, 31, 38]. A recent analysis of the
Women’s Interagency HIV Study (WIHS) among 2,028 women who were on average 39
years of age using frailty data from 2005 found 17% and 10% frailty prevalence among women with HIV and women at risk for HIV, respectively
[38].
There are few longitudinal studies of frailty, and to our knowledge only two were conducted among people with HIV; both were conducted in the Multicenter AIDS Cohort Study (MACS), which includes only men
[41, 42]. Given that women are more likely to develop frailty, it is important to determine whether frailty incidence is similar between women with and without HIV. Though we know the characteristics of adults who are more likely to develop frailty, data are limited on the components of the frailty outcome itself, and the distribution of frailty components remains unknown among people with HIV in the US
[24,33]