THE INFLUENCES OF SOCIOECONOMIC STATUS, LIFESTYLE, AND GENETIC INHERITANCE ON WAIST CIRCUMFERENCE
Caiping Wei
A thesis submitted to the faculty at the University of North Carolina at Chapel Hill in partial fulfillment of the requirements for the degree of Master of Arts in the Department of Sociology
in the College of Arts and Sciences
Chapel Hill 2017
Approved by:
Guang Guo Francois Nielsen
Mike J. Shanahan
© 2017 Caiping Wei ALL RIGHTS RESERVED
ABSTRACT
Caiping Wei: The influences of socioeconomic status, lifestyle and genetic inheritance on waist circumference
(Under the direction of Guang Guo)
Waist circumference is a convenient measure of obesity, abdominal obesity and fat distribution and it is a more efficient predictor than BMI for diseases including type 2 diabetes and cardiovascular disease. In this study, we investigate the GxE interplay in influencing waist circumference among the elderly males using the data from the Health and Retirement Study (HRS) that includes 4,944 males whose waist circumferences are measured at five different time points, mostly aged 50 to 100. We generate “top-hits” polygenic scores using genetic variants associated with waist circumference from previous studies and whole-genome polygenic score using whole-genome genetic variants from GIANT consortium. By incorporating the polygenic scores, socioeconomic status (SES), and lifestyle, we found that the genetic influence on waist circumference for people who do less physical activity is higher than for those who do more physical activity.
ACKNOWLEDGEMENTS
I would like to express my gratitude to the members of the Master Thesis Committee, Guang Guo, Francois Nielsen and Mike J. Shanahan for the immense help through the learning process of this master thesis. I would like to thank my family and friends, who have been
supportive during this process. Special thanks to my husband Zeyuan Chen as well as my friends Hexuan Liu, David Braudt, George Hayward and Meng-Jung Lin.
TABLE OF CONTENTS
LIST OF TABLES ... vi
LIST OF FIGURES ... vii
CHAPTER 1: INTRODUCTION ... 1
CHAPTER 2: BACKGROUND ... 4
Waist Circumference ... 4
Fundamental Social Causes ... 6
Genetic Studies on Obesity ... 7
INfluences from Lifestyle and Social Context ... 8
GxE Interaction... 9
CHAPTER 3: DATA AND MEASURES ... 12
CHAPTER 4: METHODS ... 15
“Top-hits” and Whole-genome Polygenic Scores ... 15
Regression Models Predicting Waist Circumference ... 17
CHAPTER 5: RESULTS ... 19
Main Effects of Polygenic Scores... 19
Social Control and GxE Interaction on Waist Circumference ... 21
CHAPTER 6: DISCUSSION ... 27
REFERENCES ... 31
LIST OF TABLES
Table 1 Means (standard deviation) and percentage distributions ... 13
Table 2 Correlations between Waist Circumference and BMI ... 14
Table 3 Coefficients (p-value) of Random Effects Linear Models Assessing the Genetic Association with Waist Circumference Using HRS Data ... 20 Table 4 Coefficients (p-value) of Random-Effects Models of Waist
Circumference Controlling BMI among Elderly Males: Social
Control, Genetic Propensities and GxE Influence (HRS) ... 22
LIST OF FIGURES
Figure 1 The Observed Waist Circumferences Differences Showing that
Genetic Predisposition Depends on Physical Activity... 24
Figure 2 Genetic Association with Waist Circumference for Individuals with Differential Physical Activity Controlling BMI ... 25
CHAPTER 1: INTRODUCTION
Obesity is one of the most serious and pressing health concerns of our time (Christakis and Fowler 2007, Flegal et al. 2009). More than two thirds grown individuals in United States are overweight (National Center for Health Statistics 2016). Body Mass Index (BMI) is widely used as a measure of obesity as it is readily available across different datasets and its
measurement is non-invasive. However, BMI has major weaknesses since it does not take the body fat distribution in to consideration, and it fails to relate fat distribution to health outcomes (Poirier and Després 2003, Zhu et al. 2002). For example, football players generally have high BMIs that may be comparable to the BMIs of obese people because of their high volumes of muscles and low fat levels (Smith et al. 2016, Steffes et al. 2010). This kind of fallacy is due to lack of regard for fat distribution.
In this article, we use waist circumference to measure obesity. Waist circumference is a convenient measure of obesity and body fat established by National Institutes of Health (NIH) for assessing health risk and it takes fat distribution into consideration (Janssen, Katzmarzyk and Ross 2004). A person with strong muscles and a person with large waist circumference may have the same BMI but their waist circumferences could reveal the salient differences between their health statuses. In addition, waist circumference is illustrated to be more predictive than BMI for heart disease and diabetes (Freemantle et al. 2008, Janssen, Katzmarzyk and Ross 2002, Poirier and Després 2003, Zhu et al. 2002). The odds of hypertension and the diabetes increase with high waist circumference values within all BMI categories from normal to obese (Janssen, Katzmarzyk and Ross 2002). Japan, the country with the highest life expectancy, made it a national law that companies and local governments must encourage and supervise people to meet
a maximum waistline size of 85cm for men and 90cm for women to advance national health (Nakamura 2010, Onishi 2008).
Like BMI, waist circumference is likely subject to genes, social contextual influences and lifestyle. Gene-environment interaction (GxE) studies, characterized as the interplay between genetic risks and environmental influences, have revealed the complex mechanism of body mass increment (Boardman et al. 2012, Boardman et al. 2013, Guo et al. 2015b, Liu and Guo 2015).
Despite abundance of GxE studies on BMI, much less is known about waist circumference.
Empirical studies on waist circumference have generally shown that socioeconomic status (SES), adversity, levels of sugary intake and exercises are deterministic to waist circumference (Atella and Kopinska 2014, Cort et al. 2013, Ferraro and Kelley-Moore 2003, Garcia et al. 2014, Harrington and Elliott 2009, Miech et al. 2015, Phelan, Link and Tehranifar 2010, Zhu 2004). In addition to social influences, a number of GWAS targeted on waist
circumference have found ten genetic variants (Frayling et al. 2007, Hofker and Wijmenga 2009, Shungin et al. 2015, Stower 2014). These empirical studies and genome-wide studies made GxE analysis on waist circumference possible. In this article, we contribute to the scant literature on how environmental factors and human genomic work interactively affect waist circumference.
The purpose of the present study is investigating the gene and environment interactions (GxE) in influencing waist circumference among elderly males. We use data of the Health and Retirement Study (HRS) that includes 4,944 males, mostly aged 50 to 100, whose waist circumferences are measured at five different time points. In the analysis, we include three genetic variants: “top-hits” polygenic scores generated using ten SNPs illustrated associated with waist circumference from previous studies; categorical high genetic risk, defined as “top-hits”
polygenic score belonging to the fourth quartile; and whole-genome polygenic score using
whole-genome genetic variants. By incorporating the polygenic scores, socioeconomic status (SES), and personal lifestyle, we are able to investigate the influences from genetic
predisposition, SES, and lifestyle on waist circumference as well as the interactions among them.
CHAPTER 2: BACKGROUND
Waist Circumference
Waist circumference is a convenient measure of obesity, regularly used both for research purposes and medical purposes (Janssen, Katzmarzyk and Ross 2004). It has been shown to be an efficient measure of intra-abdominal fat mass (IAFM) and total fat as percentage body fat is more strongly correlated with waist circumference than with BMI (Flegal et al. 2009).
Highlighting the strong association with risk of morbidity that are related to obesity, waist circumference is illustrated to be a more efficient predictor than BMI for diseases including diabetes, heart diseases and metabolic syndrome (Freemantle et al. 2008; Janssen, Katzmarzyk and Ross 2002; Poirier and Després 2003, Zhu et al. 2002).
Metabolic syndrome is the diagnosed when an individual have three or more out of five symptoms that increase the possibilities of having cardiovascular disease, diabetes etc., which is by definition highly associated with diabetes according to International Diabetes Federation (IDF 2005). According to IDF (2005), diabetes, waistline obesity, cholesterol levels and blood
pressure levels are the five criteria for metabolic risk. Because central obesity is the key criterion of metabolic syndrome, in 2008, Japan made it a national law to include waist line measurement as part of the annual physical check for individuals who are mid-aged or older than mid-aged (Nakamura 2010, Onishi 2008).
In addition to metabolic syndrome, waist circumference also plays an important role in
larger waist circumference (10 cm larger than baseline) had a hazard ratio of type 2 diabetes of 1.7 comparing to individuals with normal waist circumference (Biggs et al. 2010). The link between abdominal obesity and diabetes is biologically justifiable. Intra-abdominal fat mass (IAFM) directly affect a number of factors including non-esterified fatty acids and
adipocytokines, which are key factors that increases the risk of diabetes (Freemantle et al. 2008).
Besides association with type 2 diabetes, waist circumference is also strongly related with cardiovascular diseases and biomarkers related to cardiovascular diseases (CVDs). Waist
circumference of 38 inches or more among women is associated with more than a two-fold higher risk of coronary heart disease (CHD) (Rexrode et al. 1998). The odds of hypertension are also increased with high waist circumference values within all BMI categories from normal to obese (Janssen, Katzmarzyk and Ross 2002).
As we mentioned before, abdominal obesity is strongly associated with health and waist circumference is illustrated to be a good predictor of CVDs and CVD related diseases. Since CVD is the top killer, and people with hypertension, diabetes and metabolic syndrome are at high cardiovascular risk, waist circumference could be a good predictor for mortality as well. For instance, Pischon et al. (2008) show that the relative risks of mortality of individuals who have the top 20% largest waist circumference were about twice of the individuals who have the bottom 20% largest waist circumference, which is higher than the relative risks of mortality in the top 20% largest of BMI. Studies also show that the relationship between waist size and mortality is robust even control variables are added (Sui et al. 2007).
We focus on waist circumference not only because it is more closely linked to health outcomes than BMI, but also because waist circumference increases above and beyond the expected gain from BMI increase (Elobeid 2007, Stevens, Katz and Huxley 2010, Walls et al.
2011). Fat accumulation on abdominal part is a significant biomarker even accounting for general adiposity (Ford, Mokdad and Giles 2003).
Fundamental Social Causes
As social scientists, we choose waist circumference as the outcome variable because obesity and abdominal obesity could be considered as the new major intervening factor between social context and disparity in health and mortality. They are significantly affected by SES and heavily affecting health outcomes. As Link and Phelan (1996) point out in fundamental social causes theory, inequalities in health and mortality persist even though the intervening
mechanisms replace from time to time. For example, in early 20th century, infectious diseases were one of the major causes of death, especially among low SES groups, thus created a health and mortality disparity between the rich and the poor. Nowadays, obesity and cardiovascular illness have replaced deadly infectious diseases and become the new major causes of death (Flegal et al. 2009). Through either cause, inequalities continuously affect human health and longevity.
The link between obesity and socioeconomic inequalities is justified as resources of money, knowledge, and access to better medical care are critical to maintaining affordability to healthy diet and lifestyle (Conklin 2013, Phelan, Link and Tehranifar 2010). The lifestyles of high SES groups are healthier than lifestyles of low or moderate SES groups, such as more physical activities, less fast food and sugary beverage intake and less smoking (Cockerham 2005, Drewnowski and Specter 2004). In this study, we consider the outcome variable waist
circumference also as a mediator between social context and health disparity.
Genetic Studies on Obesity
To distinguish and compare the impact of “nurture” and “nature” in explaining the variations in body mass and waist circumference, twin studies were conducted to estimate the heritability. According to former studies, the overall heritability estimates were 56% in males and 71% in females for waist circumference (Mustelin et al. 2009) and the heritability estimates for BMI varied from 31% to 90% (Elks et al. 2012, Min, Chiu and Wang 2013), reflecting a high genetic contribution. The heriability of BMI can be attributable to variations in age, average BMI, the time period and social-environmental factors. For example, the heriability of BMI increases and peaked around 20 years old, and then decreased steadily until around 55 years old, and then afterwards gradually increased again (Min, Chiu and Wang 2013). This is due to an overlap of both genes and non-genetic variants. For the period before 20 years old, it is suggested that the onsets of some genetic variants are during the growth period, thus makes early adulthood the peak of heritability (Silventoinen and Kaprio 2009). For the period between 20 and 55, the heritability of BMI decreases due to unique environment and exposures to different lifestyle, such as smoking, drinking, diet, and physical exercises. However, twin studies are not able to observe molecular genetic variants. Also, twin studies are only valid when certain assumptions stands, which could be easily violated due to the settings of the study (Goldberger 1979).
In addition to twin studies, a number of studies identify more and more candidate genes that are associated with obesity or waist circumference. For example, FTO, DRD4, MC4R and PCSK1 are all established candidate genes related to body mass (Frayling et al. 2007, Hofker and Wijmenga 2009, Stower 2014). Candidate genes allow GxE interplay to investigate how social context and lifestyle influence individuals with different genomic predispositions (Caspi et al.
2002, Caspi et al. 2003, Daw et al. 2013, Guo et al. 2007, Guo, Roettger and Cai 2008, Mitchell
et al. 2015, Simons et al. 2011). Nevertheless, lack of robust and replicable findings has been a main critisism of candidate gene approach (Charney and English 2012, Duncan and Keller 2011).
GWAS provides a bigger picture of the influence on obesity from the human genome.
Most variants identified through GWAS have modest or small effects (Bookman et al. 2011, Chabris et al. 2015). Discoveries of specific genetic variants, Single Nucleotide Polymorphisms (SNPs) that associate with body weight and shape have been made through GWAS (Hofker and Wijmenga 2009, Locke et al. 2015, Stower 2014). An abundance of studies investigate genetic influences on waist circumference and how they compare to those that influence BMI (Chambers et al. 2008, Heard-Costa et al. 2009, Hofker and Wijmenga 2009, Lindgren et al. 2010, Locke et al. 2015, Luo et al. 2016, Polašek et al. 2009, Shungin et al. 2015, Smith et al. 2010, Speliotes et al. 2010). These genetic studies on BMI and waist circumference provide a broader view of causes of obesity and abdominal obesity, and make it possible to conduct GxE interaction analysis.
Influences from Lifestyle and Social Context
Differences of lifestyles, including eating patterns, physical activity, smoking etc. can lead to health disparity through body size and shape (Ardern et al. 2004, Beydoun and Wang 2009, Boardman et al. 2005, Chiolero et al. 2008, Conklin 2013, Crosnoe 2007). For instance, obesity and abdominal obesity are positively associated with eating frequency and snacking patterns, especially sugary beverage intake (Bigornia 2014, Funtikova 2014, Jacobs 2006, Murakami and Livingstone 2015, Qi et al. 2012b, Shroff 2013). Additionally, sedentary lifestyle significantly increases obesity (Jacobs 2006, Nelson et al. 2006), and physical activity, on the
contrary is manifested to be associated with low weigh gain and waist gain (Waller, Kaprio and Kujala 2008). Smoking was found protective against obesity (Dare, Mackay and Pell 2015, Flegal et al. 1995), however, it is also found that smoking increases the risk of metabolic syndrome and central fat accumulation (Chiolero et al. 2008).
It is important to note that lifestyles are not independent from social context. It is widely recognized that low-income people are more exposed to “cheap calories,” with high energy density, refined grains, sugary drinks, and fast food than moderate/high income people
(Drewnowski and Specter 2004). Similar to calorie consumption, physical activity is also a major mechanism through which social contexts affect obesity and further health disparity. For
example, low SES neighborhoods have lower levels of access to facilities for physical activities, which in turn negatively affects the physical activity and thus increases the obese rate of
residents in those neighborhoods (Gordon-Larsen et al. 2006). Low SES neighborhoods are also the least safe for outdoor physical activity (Loureiro et al. 2010). Above infrastructural level, high SES may allow people to make better dietary and exercise choices through the cognitive advantages, thus creates a disparity of health (Sobal and Stunkard 1989). In sum, social contexts have been the fundamental causes of health outcome, characterizing obesity as the major
intervening mechanism. Lifestyles including diet, physical activity and smoking are the main mediators through which inequality affects obesity and further health disparity.
GxE Interaction
Genetic factors are crucial to body weight and shape, but their impacts are demonstrated affected by the lifestyle and the social background of people (Boardman et al. 2012, Guo et al.
2015b, Heitmann et al. 1997, Karnehed et al. 2006, Liu and Guo 2015, Mustelin et al. 2009).
Emerging literature has presented several gene-environment interaction paradigms (Belsky and Pluess 2009, Boardman et al. 2013, Conley 2009, Guo et al. 2015a, Liu and Guo 2015,
Pescosolido et al. 2008, Shanahan and Hofer 2005, Simons et al. 2011, Simons, Beach and Barr 2012). Among all the gene-environment interaction paradigms, the frailty model, is quite intuitive and widely used. The concept of “frailty” suggests that some individuals are inherently more frail than others, even though the frailty is generally unobserved. Frailty model is widely used in the study of human health and mortality (Clayton 1978, Guo 1993, Vaupel, Manton and Stallard 1979). Other applications of frailty model can be found in GxE models regarding inherited diseases and relating biomarkers, as well as social behaviors.
A number of researches find significant results in GxE influence on obesity that can be explained using frailty model. For instance, individuals have different frailties reacting to physical activity. From another angle, the influence from genomic risk may be moderated by physical activity. For example, for individuals who regularly do physical activities, the genetic risk of obesity are much less likely to show than individuals who do not regularly do physical activities (Demerath et al. 2011, Duncan et al. 2015, Graff et al. 2016, Guo et al. 2015b, Kilpeläinen et al. 2011, Mustelin et al. 2009, Vimaleswaran et al. 2009), i.e. influences from physical inactivity on BMI are substantially bigger for individuals with genetic frailty of obesity.
As an example of physical inactivity increasing the influence from genetic frailty, high levels of screen time (TV, video, and computer games) increase the influence of genetic influence on body mass (Graff et al. 2013, Qi et al. 2012a). In addition to lifestyle, social influences on body mass are also moderated by genetic frailty. For example, it is well known that spending childhood in the ordeal associates with obesity. Nevertheless, the influence of adversity over different life
stages, and moving down the social stratification can be amplified by the genetic risk on BMI or vice versa (Liu and Guo 2015).
Despite gene and environment interplay as predictors of health, gene-environment correlations (rGEs) may exist because of the preexisting associations between genes and environments, when individuals’ genotypes are deterministic to their environmental exposure (Wagner et al. 2013). For instance, the preexisting associations between genes and educational attainment and physical activities may affect the relationship between education and obesity as various literature show the association between genetics and educational attainment (Boardman et al. 2013, Nielsen 2006, Nielsen and Roos 2015, Rietveld et al. 2013a, Rodgers et al. 2008).
CHAPTER 3: DATA AND MEASURES
HRS data are used in our study. HRS is a longitudinal study that includes information on economic, health, social, lifestyle and other aspects of retirement life. Survey data were collected every two years from 1992 to 2014. Most respondents are over age 50.
DNA samples of HRS were collected in 2006-2008. A total of 12,292 consenting individuals in HRS were genotyped, among which 7,270 are women and 5,022 are men. Our analysis sample includes only males because some GWAS results we use were only found among males. No female results can pass the genome-wide significance threshold (p-values <
5*10−8) in half of the SNPs we use. The bio-samples were collected using mouthwash in 2006 and Oragene kits in 2008 (Crimmins et al. 2008).
Waist circumferences were measured every other year from 2006 to 2014. Among the genotyped males 4,944 had their waist circumferences measured. On average each respondent has 2 measures from 2006 to 2014. Waist circumferences were measured using tape measure at the level of respondents’ navel. Respondents should remain standing during the measurement.
Before the measuring, bulky clothing was removed. Activities like eating, drinking, smoking etc.
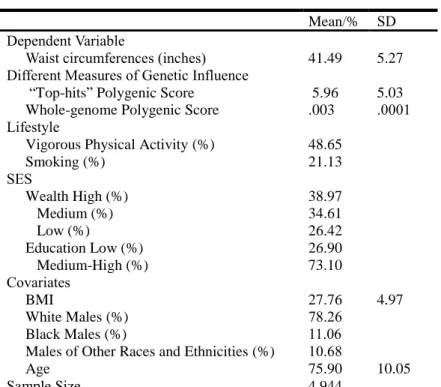
were banned during the measuring. Respondents’ waist measurements were rounded to the nearest quarter inch. The mean of waist circumferences of the sample is 41.49 inches (Table 1).
The majority (78.26%) of our analysis sample are non-Hispanic whites and 11.06% are non-Hispanic Black. The other 10.68% of our sample belong to other racial/ethnic groups. The race/ethnicity composition in our sample is similar to the samples of the waist circumference- related GWA studies we refer to, with white males as the majority (Chambers et al. 2008, Heard-
Costa et al. 2009, Lindgren et al. 2010, Locke et al. 2015, Polašek et al. 2009, Shungin et al.
2015, Smith et al. 2010).
Table 1 Means (standard deviation) and percentage distributions
Mean/% SD Dependent Variable
Waist circumferences (inches) 41.49 5.27 Different Measures of Genetic Influence
“Top-hits” Polygenic Score 5.96 5.03 Whole-genome Polygenic Score .003 .0001 Lifestyle
Vigorous Physical Activity (%) 48.65
Smoking (%) 21.13
SES
Wealth High (%) 38.97
Medium (%) 34.61
Low (%) 26.42
Education Low (%) 26.90
Medium-High (%) 73.10
Covariates
BMI 27.76 4.97
White Males (%) 78.26
Black Males (%) 11.06
Males of Other Races and Ethnicities (%) 10.68
Age 75.90 10.05
Sample Size 4,944
At five times between 2006 and 2014, according to the codebooks of HRS, the
respondents were asked about how frequently they engage in vigorous physical activities. Based on the answers, a binary variable is constructed that divides the HRS males into two groups:
those who engaged in vigorous physical activity (48.65%), including individuals who do vigorous physical activities with a frequency range from every day to one to three times per month; and those who did not engage in vigorous physical activity (hardly ever or never).
Smoking measurement was dichotomized according to respondents’ answers for “Have you ever smoked cigarettes?” 21.13% of the sample are or used to be smokers.
SES is measured by wealth and educational attainment. We use wealth not income because the majority of HRS respondents are retired, thus wealth is a more efficient
measurement of SES than income. We categorized respondents based on their wealth values into low wealth (26.42%), medium wealth (34.61%), and high wealth (38.97%). For educational attainment, a binary variable is constructed based on the years of education. Individuals with years of education lower than the average were categorized as low education (26.90%). We did within-cohort standardization for educational attainment as the same degree may mean higher SES in earlier cohorts than later cohorts. We did multiple imputation for SES and lifestyle variables to avoid losing respondents in the sample.
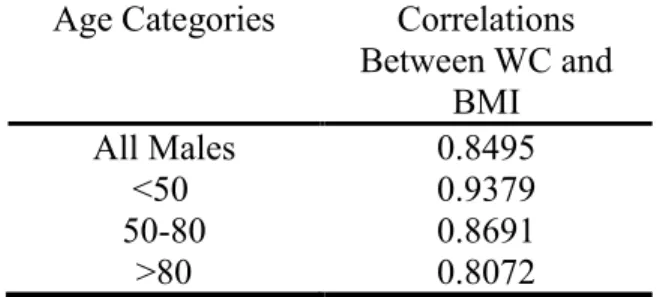
Table 2 Correlations between Waist Circumference and BMI Age Categories Correlations
Between WC and BMI
All Males 0.8495
<50 0.9379
50-80 0.8691
>80 0.8072
In Table 2, we show the correlations between waist circumference and BMI. Waist circumference and BMI are strongly correlated across all age groups. The correlation between the two is highest (0.9379) in the youngest group (age<50) and lowest (0.8072) in the oldest group (age>80), with an overall correlation of 0.8495 for all participants in the sample.
CHAPTER 4: METHODS
“Top-hits” and Whole-genome Polygenic Scores
As obesity is a complex trait that reflect the influence of many different genes (Visscher, Hill and Wray 2008) and some individual genetic loci influencing obesity have low penetrance (Gibson 2012), polygenic score, or genetic predisposition score is frequently used to measure genetic predisposition and often used to integrate genetics and social science (Belsky and Israel 2014, Dudbridge 2013, Liu and Guo 2016, Qi et al. 2012b). Emerging studies have used
polygenic score to study the genetic associations of health-related biomarkers, diseases and social outcomes. For instance, with an increasing number of SNPs being discovered related to obesity, studies made significant progress using polygenic scores predicting BMI (Belsky et al.
2013, Domingue et al. 2014b, Liu and Guo 2015, Locke et al. 2015, Purcell et al. 2009, Qi et al.
2012b). The polygenic score approach is widely used to predict other physical phenotypes such as height and diseases (Lango Allen et al. 2010, Purcell et al. 2009, Wood et al. 2014). In addition to health-related traits, an increasing number of genetic variants affecting social outcomes are found, including education (Domingue et al. 2015, Okbay et al. 2016, Rietveld et al. 2013b), assortative mating (Conley et al. 2016, Domingue et al. 2014a) and substances using (Guo et al. 2015a, Vink et al. 2014). Polygenic scores have been generated and used respectively.
Social scientists utilize the results of GWAS studies to generate risk scores for more sociological phenotypes and explore the interactions of polygenic scores with social influences.
For example, Guo et al. (2015a) found that if one’s college roommate drinks, the risk of self
binge drinking is significantly higher, especially for those whose genetic predisposition of drinking is in the middle of the spectrum. Qi et al. (2012b) exhibited among participants with higher intake of sugar-sweetened beverage, the “genetic association with adiposity was stronger” than among those with lower intake. Using polygenic scores based on 32 SNPs, Liu and Guo (2015) manifested that high SES or moving towards higher levels of SES mitigate the effect of risk alleles to BMI and low SES or moving towards lower levels of SES aggregate the effect of risk alleles to BMI. In sum, polygenic scores provide social scientists insights of how social context, environments and genetic heritability interact with each other on both health and social outcomes.
Liu and Guo (2016) summarized two approaches of generating polygenic scores: “top- hits” polygenic score and whole-genome polygenic score. The “top-hits” approach adds up the SNPs passed the GWAS threshold (p-values < 5 × 10⁻⁸) with coefficients as the weights (Belsky et al. 2013, Domingue et al. 2014b, Liu and Guo 2015, Qi et al. 2012b). In contrast, under the assumption that genetic variants have small to moderate effects on the outcome, the whole- genome approach has much less stringent threshold of p-value and uses all genotyped or imputed SNPs or very large number of genotyped SNPs (Domingue et al. 2015, Euesden, Lewis and O'Reilly 2015).
In this study we generated both “top-hits” and whole-genome polygenic scores. When generating the “top-hits” polygenic score, all the ten SNPs used meet the GWAS significance threshold (p-values < 5*10−8). For each genotype, we counted how many risk alleles (0, 1, or 2) there are. All alleles are weighted by the betas (Equation 1). SNPs were summarized from four GWAS studies on WC (Chambers et al. 2008, Heard-Costa et al. 2009, Lindgren et al. 2010,
Shungin et al. 2015), the sample sizes of which vary from 11,955 to 210,089. Majority of the samples are European ancestry individuals.
The equation below describes how “top-hits” polygenic score is constructed:
𝑃𝑜𝑙𝑦𝑔𝑒𝑛𝑖𝑐 𝑆𝑐𝑜𝑟𝑒𝑖 = (𝛽1𝑆𝑁𝑃1𝑖+ 𝛽2𝑆𝑁𝑃2𝑖+ 𝛽3𝑆𝑁𝑃3𝑖+ ⋯ + 𝛽𝑛𝑆𝑁𝑃𝑛𝑖)
𝛽1+ 𝛽2+ 𝛽3+ ⋯ + 𝛽𝑛 ∗ 𝑛 (1) where 𝑖 represents the individuals and 𝑛 is the number of SNPs. 𝑃𝑜𝑙𝑦𝑔𝑒𝑛𝑖𝑐 𝑆𝑐𝑜𝑟𝑒𝑖 is the
polygenic score on waist circumference of individual 𝑖. 𝑆𝑁𝑃𝑛𝑖 is the value of 𝑆𝑁𝑃𝑛 of individual 𝑖. 𝛽𝑛 is the coefficient of 𝑆𝑁𝑃𝑛 on waist circumference obtained from GWAS papers on waist circumference. The average polygenic score of our sample is 5.96 (SD=5.03). We also
constructed a dummy variable of high genetic risk. Respondents whose polygenic score belongs to the fourth quartile are in the high genetic risk category.
In addition to the “top-hits” polygenic score, we also generate a whole-genome polygenic score using the software PRSice, which allows polygenic scores being generated at a large number of less stringent thresholds to provide the best-fit polygenic scores (Euesden, Lewis and O'Reilly 2015). The beta coefficients of waist circumferences were from Shungin et al. (2015).
In this case, the whole-genome polygenic score generated with 32537 SNPs and the P-value thresholds of 0.037 has the highest predicting power, so we use this best-fit score as our whole- genome polygenic score. We did standardization for whole-genome polygenic score. Given the GWAS results, respondents with higher polygenic score are expected to have higher genetic risk of having larger waist.
Regression Models Predicting Waist Circumference
Random-effects models are used to estimate the effects of polygenic scores, SES and lifestyle on waist circumferences. The following equations describe our models:
WC 𝑖𝑡 = 𝛽1𝑃𝐺𝑆𝑖+ 𝛽2𝑃𝐴𝑖𝑡 + 𝛽3𝑆𝐸𝑆𝑖+ ∑ 𝛾𝑝𝐶𝑝𝑖
𝑝
+ ∑ 𝛾𝑞𝐶𝑞𝑖
𝑞
+𝜇𝑖 + 𝜀𝑖𝑡 (2)
WC 𝑖𝑡 = 𝛽1𝑃𝐺𝑆𝑖 + 𝛽2𝑃𝐴𝑖𝑡+ 𝛽3𝑆𝐸𝑆𝑖+ 𝛽4(𝑃𝐺𝑆𝑖 × 𝑃𝐴𝑖𝑡) + ∑ 𝛾𝑝𝐶𝑝𝑖
𝑝
+ ∑ 𝛾𝑞𝐶𝑞𝑖
𝑞
+ 𝜇𝑖
+ 𝜀𝑖𝑡 (3) where WC 𝑖𝑡 is the waist circumference measure for individual 𝑖 at time 𝑡, where 𝑖 = 1, ..., I, and 𝑡 ranges from 1 to Ti; Ti is the times that waists of respondents were measured; 𝑃𝐺𝑆𝑖 denotes the individual 𝑖’ polygenic score. It could be the “top-hits” polygenic score, the dummy variable of categorical high risk polygenic score generated using “top-hits” polygenic score and whole- genome polygenic score in different models. 𝑃𝐴𝑖𝑡 denotes physical activity of respondent 𝑖 at time 𝑡 with “1” as more frequent physical activity and “0” as less or none physical activity. 𝑆𝐸𝑆𝑖 includes wealth and education dummy variables of individual 𝑖. 𝐶𝑝𝑖 represents other covariates that do not change with time, such as principal components (PCs), and race/ethnicity identities.
The models include the top 10 PCs to account for population stratification. Population stratification is genome-wide patterns that may confound the outcome variable (Price et al.
2006). 𝐶𝑞𝑖 represents other covariates that may change with time, such as age, health behaviors, and BMI. 𝜇𝑖 denotes between-individual characteristics and 𝜀𝑖𝑡 is the within individual error term. In this study, “xtreg” command in Stata 14 is used running the regression models.
CHAPTER 5: RESULTS
Main Effects of Polygenic Scores
To show the genetic association with waist circumference, we first estimated three groups of models with genetic influence but without SES or lifestyle variables in Table 3. Models 1-3 shows the main effects of “top-hits” polygenic scores, categorical high genetic risk and whole- genome polygenic score respectively. “Top-hits” polygenic score range from 0 to 18.62. The higher the top-hits risk score is, the more likely to have a larger waist circumference.
“Categorical High Genetic Risk” is defined as “top-hits” polygenic score belonging to the fourth quartile. Whole-genome polygenic score is standardized. Similar to the top-hits score, the higher the top-hits risk score is, the more likely to have a larger waist circumference. In Model 1, the coefficient of “top-hits” polygenic score implies that each risk allele is associated with an increase of 0.046 inches of waist circumference. For each SNP, the number of risk alleles could be 0, 1 or 2. For example, if one has 1 risk allele for each of the 10 SNPs, his polygenic score is 10, i.e. he has 10 risk alleles associated with waist circumference in this study. In the current study, we include 10 SNPs, so the total number of risk alleles could range from 0 to 20. The numbers of risk alleles carried by individuals range between the maximum and the minimum. In Model 2, the coefficient of categorical high genetic risk implies that individuals with high genetic risk (i.e. individuals with the fourth quartile of “top-hits” polygenic score) is associated with 0.62 inches increase of waist circumference comparing to individuals with low to medium genetic risk, and the association is statistically significant. In Model 3, the whole-genome
Table 3 Coefficients (p-value) of Random Effects Linear Models Assessing the Genetic Association with Waist Circumference Using HRS Data
Genetic Effect Genetic Effect Controlling PC Genetic Effect Controlling PC and BMI
(1) (2) (3) (4) (5) (6) (7) (8) (9)
Measures of Genetic Influence
Top-hits Polygenic Score
.046 (.002) .035 (.017) .010 (.166)
Categorical High .62 (.000) .51 (.003) .23 (.007)
Genetic Risk
Whole-Genome .75 (.000) .81 (.000) .26 (.000)
Polygenic Score
BMI .84 (.000) .84 (.000) .83 (.000)
PCs
PC1 -27.87 (.000) -27.80 (.000) -31.56 (.000) -24.47 (.000) -24.25 (.000) -25.69 (.000)
PC2 -46.83 (.000) -46.84 (.000) -39.98 (.000) -38.49 (.000) -38.36 (.000) -38.67 (.000)
PC3 -22.14 (.019) -21.77 (.021) -27.11 (.005) 6.40 (.182) 6.42 (.180) 4.36 (.372)
…
PC10 3.20 (.840) 3.24 (.838) .22 (.989) 1.81 (.822) 1.63 (.839) -1.95 (.811)
Constant 41.38 (.000) 41.50 (.000) 41.7 (.000) 41.51 (.000) 41.59 (.000) 41.8 (.000) 18.29 (.000) 18.30 (.000) 18.4 (.000) Random Effects
Sigma_u 4.93 4.93 4.87 4.91 4.91 4.84 2.26 2.26 2.22
Sigma_e 1.97 1.97 1.97 1.97 1.97 1.97 1.64 1.64 1.65
rho .86 .86 .86 .86 .86 .86 .66 .66 .64
R-sq between .0020 .0027 .021 .012 .013 .034 .75 .75 .76
R-sq overall .0025 .0026 .020 .011 .011 .031 .73 .73 .74
Observations 10,023 10,023 9,748 10,023 10,023 9,748 10,023 10,023 9,748
Sample Size 4,944 4,944 4,769 4,944 4,944 4,769 4,944 4,944 4,769
Notes: The “Categorical High Genetic Risk” is defined as “top-hits” polygenic score belonging to the fourth quartile. Whole-genome polygenic score is standardized. Models 1-3 shows the main effects of “top-hits” polygenic scores, categorical high risk polygenic score and whole-genome polygenic score respectively. Models 4-6 shows the effects of “top-hits” polygenic scores, categorical high risk polygenic score and whole-genome polygenic score respectively, controlling PC. Models 7-9 shows the effects of “top-hits” polygenic scores, categorical high risk polygenic score and whole-genome polygenic score
respectively, controlling PC and BMI.
20
polygenic score values range from -4.103 to 3.504 standard deviations. The coefficient of whole- genome polygenic score implies that each standard deviation increase of whole-genome
polygenic score is associated with .75 inches increase of waist circumference.
In Models 4-9, top ten principal components (PCs) are adjusted to control population stratification. Models 7-9 control BMI in addition to polygenic scores and PCs to show waist circumference increase above and beyond the expected gain from BMI increase. In Model 4, the coefficient of “top-hits” polygenic score on waist circumference shrinks to 0.035 inches but still stays statistically significant after adjusting for PCs, which implies that each risk allele is
associated with an increase of 0.035 inches of waist circumference. However, the coefficient of
“top-hits” polygenic score is no longer statistically significant after adjusting for BMI (Model7).
In Model 5 and 8, the effect of categorical high risk polygenic score shrinks to 0.51 inches and 0.23 inches after adjusting for PCs (Model 5) and adjusting for PCs and BMI (Model 8) respectively. When population stratifications and BMI are controlled, the effects of whole- genome polygenic score stay robust (Model 6, 9) with a small increase to 0.81 inches after adjusting for PCs, and a decrease to 0.26 inches after controlling BMI and PCs. As waist
circumference and BMI are highly correlated, it is foreseeable that the effect of polygenic scores will shrink after adjusting BMI.
Social Control and GxE Interaction on Waist Circumference
Table 4 estimates models of effects from SES and lifestyle on waist circumference and GxE effects on waist circumference. BMI is adjusted in all models to show the increment of waist circumference above and beyond the expected gain from whole body mass increases.
Model 1 shows the association between SES, lifestyle and waist circumference without genetic
variants. In Model 1, all estimates are statistically significant. In line with our theoretical framework, physical activity reduces waist circumference by 0.29 inches, and the effect is statistically significant. Smoking is associated with a decrease of waist circumference of 0.16 inches, and the association is statistically significant. Educational attainment lower than average is positively associated with waist circumference by 0.23 inches. Low and medium wealth levels
Table 4 Coefficients (p-value) of Random-Effects Models of Waist Circumference Controlling BMI among Elderly Males: Social Control, Genetic Propensities and GxE
Influence (HRS)
Social Control
(1)
Social Control And Genetic
Propensities (2)
GxE Influence
(3)
Categorical High Genetic Risk .18 (.029) .29 (.003)
Lifestyle
Vigorous Physical Activity -.29 (.000) -.28 (.000) -.22 (.000)
Categorical High Risk×Vigorous Physical Activity -.23 (.042)
Smoking -.16 (.049) -.18 (.035) -.18 (.033)
SES
Low Education .23 (.010) -.20 (.022) -.21 (.022)
SES (Wealth) Medium .27 (.002) .26 (.002) .26 (.002)
SES (Wealth) Low .52 (.000) .52 (.000) .52 (.000)
Covariates
BMI .86 (.000) .86 (.000) .86 (.000)
Black -.95 (.000) 1.18 (.016) 1.19 (.016)
Other Races and Ethnicities -.98 (.000) .11 (.592) .12 (.574)
Age .075 (.000) .074 (.000) .074 (.000)
Principal Components
PC1 -33.29 (.000) -33.47 (.000)
PC2 -28.32 (.000) -28.45 (.000)
PC3 4.56 (.386) 4.58 (.384)
…
PC10 6.54 (.401) 6.65 (.393)
Constant 12.47 (.000) 12.36 (.000) 12.33 (.000)
Random Effects
Sigma_u 2.19 2.18 2.18
Sigma_e 1.59 1.59 1.59
rho .66 .65 .65
R-sq between .76 .76 .76
R-sq overall .75 .75 .75
Observations 10,023 10,023 10,023
Sample Size 4,944 4,944 4,944
Notes: The “Categorical High Genetic Risk” is defined as “top-hits” polygenic score belonging to the fourth quartile.
Model 1 shows the association between SES, lifestyle and waist circumference without genetic variants. Model 2 shows the association between waist circumference and genetic influence, SES and lifestyle. Model 3 shows the moderating effects of vigorous physical activity on the genetic association with waist circumference.
are statistically significantly associated with longer waist circumferences comparing to high wealth level by 0.27 inches and 0.52 inches, respectively. The coefficients of SES and lifestyle covariates are consistent with fundamental social cause theory that lower levels of deployable resources lead to health disparity. One unit of BMI increase is associated with 0.86 inches increase on waist line, and the association is statistically significant, which could be explained from biological perspectives because of the close link between waist line and BMI. Belonging to races and ethnicities other than white reduces waist circumference nearly 1 inch. One year older is associated with a 0.075 inches increase on waist circumference, which is in line with former literature that waist line increases as aging (Bannerman et al. 2002, Biggs et al. 2010).
Model 2 shows the effects of categorical high genetic risk on waist circumference when controls of lifestyle, SES and covariates are added. We find belonging to high genetic risk category significantly increases waist circumference by 0.18 inches when SES and lifestyles are considered. The effects of almost all other estimates in Model 2 are comparable to those in Model 1, except low education and race/ethnicity. That is because Model 2 accounted for the largest ten principal components (PCs) to control population stratification (Price et al. 2006).
When population stratification is controlled, the associations between waist circumference and race/ethnicity are not statistically significant.
Model 3 shows how lifestyles influence the genetic impact on waist circumference by adding the interaction term between polygenic score and physical activity. After adding the interaction term, the main effect of categorical high risk polygenic score increase to 0.29 inches comparing to the Model 2. The influence from physical activity shrinks from 0.28 to 0.22 inches.
Other estimates do not change much from Model 2.
The interaction terms from Model 3 are consistent with the frailty model: that is, the impact of genome on waist circumference for sedentary individuals are more salient than for physically active individuals. Viewed differently, the influence from social context and lifestyle on waist circumference may depend on genetic propensity. As can be seen in Model 3, physical activity statistically significantly decreases an individual’s waist circumference for individuals with high polygenic scores by 0.23 inches comparing to individuals with low polygenic scores.
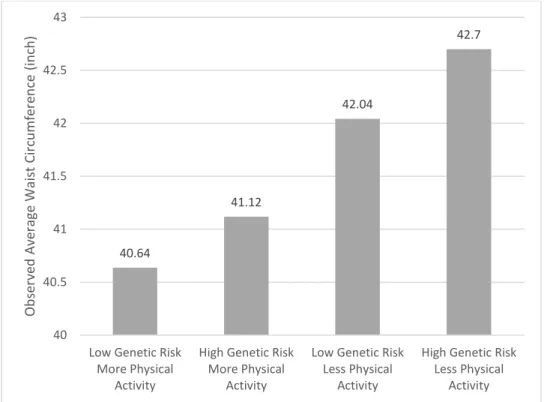
Figure 1 The Observed Waist Circumferences Differences Showing that Genetic Predisposition Depends on Physical Activity
We plot the interactions between polygenic score and physical activity in Figure 1-2.
Figure 1 displays the observed waist circumferences differences among four groups. The average waist circumference among males who do more physical activities and belong to the category of low genetic risk is the lowest (40.6 inches), followed by males who frequently exercise but belong to the category of high genetic risk (41.1 inches). Males do not frequently engage in
40.64
41.12
42.04
42.7
40 40.5 41 41.5 42 42.5 43
Low Genetic Risk More Physical
Activity
High Genetic Risk More Physical
Activity
Low Genetic Risk Less Physical
Activity
High Genetic Risk Less Physical
Activity
ObservedAverageWaistCircumference(inch)
vigorous physical activities have obvious larger waist circumferences than those who do. Those who have high genetic risk and do less or none physical activities have the largest waist
circumferences (average of 42.7 inches).
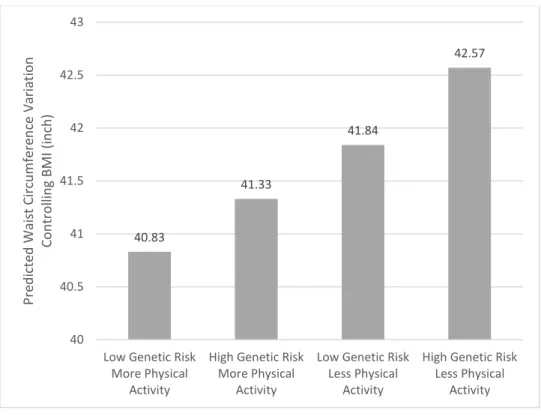
Figure 2 Genetic Association with Waist Circumference for Individuals with Differential Physical Activity Controlling BMI
Note: The category “High Genetic Risk” is defined as “top-hits” polygenic score belonging to the fourth quartile.
The rest of the sample belong to “Low Genetic Risk” by definition. The X axis represents combinations of genetic risk categories and physical activity categories. The histogram (Y axis) shows the predicted waist circumferences.
Figure 2 displays the predicted waist circumferences in Model 3, demonstrating genetic association with waist circumference depends on physical activity when BMI is controlled. The predicted waist circumferences of individuals who do more physical activities are much lower (40.8 inches and 41.3 inches). People who do less or none physical activities have longer predicted waist circumference (41.8 inches and 42.6 inches). When BMI is controlled, doing more physical activities reduces the predicted waist circumferences by 1.3 inches among people with high genetic risk and 1 inch among people with low genetic risk. The moderating effect of
40.83
41.33
41.84
42.57
40 40.5 41 41.5 42 42.5 43
Low Genetic Risk More Physical
Activity
High Genetic Risk More Physical
Activity
Low Genetic Risk Less Physical
Activity
High Genetic Risk Less Physical
Activity PredictedWaistCircumferenceVariation ControllingBMI(inch)
physical activity is makes as much as 1.3 times waist circumference difference among people with high genetic risk than among people with low genetic risk when BMI is controlled. From another angle, for people who do low levels of physical activities, genetic high risk is making as much as 1.6 times difference (0.8 inches) as for people who do more physical activities (0.5 inches).
Overall, our models and figures show consistency with the frailty model: that is, the genomic influence on waist circumference is more salient for physically inactive individuals than physically active individuals. Viewed differently, the moderating effect from social context and lifestyle is greater for those with high genetic risk. Our results show that effect from social context and lifestyle on waist circumference depends on genetic propensity or vice versa.
CHAPTER 6: DISCUSSION
The present study investigates the GxE interplay in influencing waist circumference among the elderly males using HRS data. This study makes important contributions to abdominal obesity literature, GxE paradigm, and fundamental social causes literature.
Firstly, results using polygenic scores demonstrates that genetic high risk significantly increase waist circumference. Individuals who have a genetic propensity of having larger waist circumference are more prone to have larger waist circumferences than individuals who have low genetic risk, when they do comparable physical exercises, holding other variables constant.
Belonging to categorical high genetic risk increases waist circumference by around 0.2 inches when SES and lifestyle are considered and BMI is controlled. This suggests that the genetic propensity of having larger waist circumference is an efficient predictor of larger waist lines, and waist gain beyond that could be expected from BMI gain.
To avoid being misled by waist line difference caused by BMI, we adjusted BMI. By controlling BMI, we achieved a big increase of R2 (from 0.02 to 0.74). Despite the high
correlation (overall correlation of 0.8495) between waist circumference and BMI, we still found significant results for waist circumference increase upon high genetic risk. This suggests that there are enough differences between waist circumference and BMI though both measures are good indicator of an underling condition. Therefore, our empirical results could contribute to the scant literature of waist circumference/abdominal obesity.
Secondly, this current study examines influence on waist circumference from interplay of genetic predisposition, social context and lifestyle, and tests the interaction among those factors
using frailty model. Our empirical results suggest that individuals with high genetic risk change more dramatically facing different lifestyle, or in another word, are more frail to social context and lifestyle, which is consistent with frailty model that different frailty lead to different effects of the protection of favorable conditions/compensations against genetic risk. To be specific, the moderating effect of physical activities is greater for those with high genetic risk. We find doing more physical activities is slightly more effective serving the purpose of keeping shorter waist circumference for individuals who are genetically more prone to larger waist than for individuals who are genetically less prone to larger waist.
This result is similar to findings in previous twin study that the individuals with largest polygenic risk scores are more influenced by physical activities than the rest (Mustelin et al.
2009). It is likely that physical activity moderates the genetic risks by intervening the expression of relative genes. For example, Andreasen et al. (2007) found that being physically inactive exacerbated the effect of a risk allele in FTO gene on fat accumulation. More thorough explanations will depend on wider and deeper research on genomic and biological causes of obesity.
The findings of the current study also contribute as a demonstration of fundamental social causes theory that inequalities as a fundamental social cause play an important role in producing health and mortality disparity even though the intervening mechanisms replace from time to time. We propose that obesity and obesity related illness became the new major intervening factor between inequality and health disparity and physical activity is a key component linking SES and obesity. In early stages in history, ability to prevent infectious diseases, hunger etc. are the privileges of people of high SES that created a health and mortality disparity between the rich and the poor. Nowadays, in a developed social environment, infectious diseases and hunger are
no longer the prevailing cause of death; obesity and obesity related disease, such as
cardiovascular disease play a more and more important role causing health disparity between people of high SES and low. We find lower values of wealth are positively associated with waist circumference comparing to high values of wealth, which is in line with previous literature that low SES is positively related to obesity (Liu and Guo 2015).
Social context affect obesity both directly and indirectly. Lifestyle, especially physical activity are the major mediator of how SES affects obesity and further health disparity. As we previously mentioned, resources of money, knowledge are critical to maintaining affordability to healthy diet and lifestyle (Phelan, Link and Tehranifar 2010). Low SES is associated with unhealthy lifestyles featured by frequent cheap calories, less physical activities and more stress as well as limited access to exercise equipment and proper medical care, and those unhealthy lifestyles are key components that lead to larger waist circumferences (Drewnowski and Specter 2004, Gordon-Larsen et al. 2006, Loureiro et al. 2010).
The current study has some limitations. One is the limited number of SNPs used in generating the “top-hits” polygenic score. Due to the scant GWAS studies by the time of the present study about waist circumference, only ten SNPs in previous GWAS study meet the genome-wide significance threshold (p-values < 5*10−8). There may be a lot more waist circumference related SNPs yet to be discovered. In future work, we hope a more predictive
“top-hits” polygenic score can be achieved as more GWAS results on waist circumference and abdominal obesity are found. Moreover, in half of the genetic variants we use, only male results can pass the stringent significant threshold, which means half of the genetic variants we use cannot be applied to generating the “top-hits” polygenic score for female sample. We expect future researches to include female respondents when more GWA studies, especially those with
significant results with females become available. In addition, since the sample size in HRS for minority is relatively small, we did not run the analysis for minorities. We expect future
researches to include other racial populations and make comparisons among different race/ethnicity groups when more data are available.
Although there are several limitations, this study contributes to the existing literature of GxE interaction on health outcomes. It shows that waist circumference is affected by individuals’
genes, lifestyle and social context interactively. As fat distribution and abdominal obesity get more attention as health indicators, there will be more molecular genetic results on waist circumference from whole-genome studies. In addition, increasing datasets with genomic information provide more opportunities for researchers to explore the GxE interaction. The method and result of current study can contribute to future studies of complex traits.
REFRENCES
Andreasen, Camilla H., Kirstine L. Stender-Petersen, Mette S. Mogensen, Signe S. Torekov, Lise Wegner, Gitte Andersen, Arne L. Nielsen, Anders Albrechtsen, Knut Borch-Johnsen, Signe S.
Rasmussen, Jesper O. Clausen, Annelli Sandbæk, Torsten Lauritzen, Lars Hansen, Torben Jørgensen, Oluf Pedersen and Torben Hansen. 2007. "Low Physical Activity Accentuates the Effect of the Fto Rs9939609 Polymorphism on Body Fat Accumulation." Diabetes 57(1):95.
Ardern, Chris I., Ian Janssen, Robert Ross and Katzmarzyk. 2004. "Development of Health-Related Waist Circumference Thresholds within Bmi Categories." Obesity research 12:1094-103. doi:
10.1038/oby.2004.137.
Atella, Vincenzo and Joanna Kopinska. 2014. "Body Weight, Eating Patterns, and Physical Activity: The Role of Education." Demography 51(4):1225-49. doi: 10.1007/s13524-014-0311-z.
Bannerman, Elaine, Michael D. Miller, Lunne A. Daniels, Lynne Cobiac, Lynne C. Giles, Craig
Whitehead, Gary R. Andrews and Maria Crotty. 2002. "Anthropometric Indices Predict Physical Function and Mobility in Older Australians: The Australian Longitudinal Study of Ageing."
Public Health Nutrition 5(5):655-62. doi: 10.1079/PHN2002336.
Belsky, Daniel W., Terrie E. Moffitt, Karen Sugden, Benjamin Williams, Renate Houts, Jeanette
McCarthy and Avshalom Caspi. 2013. "Development and Evaluation of a Genetic Risk Score for Obesity." Biodemography and Social Biology 59(1):85-100. doi:
10.1080/19485565.2013.774628.
Belsky, Daniel W. and Salomon Israel. 2014. "Integrating Genetics and Social Science: Genetic Risk Scores." Biodemography and social biology 60(2):137-55. doi: 10.1080/19485565.2014.946591.
Belsky, J. and M. Pluess. 2009. "Beyond Diathesis Stress: Differential Susceptibility to Environmental Influences." (1939-1455 (Electronic)).
Beydoun, May A. and Youfa Wang. 2009. "Gender-Ethnic Disparity in Bmi and Waist Circumference Distribution Shifts in Us Adults." Obesity 17(1):169-76. doi: 10.1038/oby.2008.492.
Biggs, M. L., K. J. Mukamal, J. A. Luchsinger and et al. 2010. "Association between Adiposity in Midlife and Older Age and Risk of Diabetes in Older Adults." JAMA 303(24):2504-12. doi:
10.1001/jama.2010.843.
Bigornia, Sherman J. 2014. "Sugar-Sweetened Beverage Consumption and Central and Total Adiposity in Older Children: A Prospective Study Accounting for Dietary Reporting Errors." Public Health Nutrition 18(7):1155.
Boardman, Jason D., Jarron M. Saint Onge, Richard G. Rogers and Justin T. Denney. 2005. "Race Differentials in Obesity: The Impact of Place." Journal of Health and Social Behavior 46(3):229- 43.
Boardman, Jason D., Michael E. Roettger, Benjamin W. Domingue, Matthew B. McQueen, Brett C.
Haberstick and Kathleen Mullan Harris. 2012. "Gene–Environment Interactions Related to Body
Mass: School Policies and Social Context as Environmental Moderators." Journal of Theoretical Politics 24(3):370-88. doi: 10.1177/0951629812437751.
Boardman, Jason D., Benjamin W. Domingue, Casey L. Blalock, Brett C. Haberstick, Kathleen Mullan Harris and Matthew B. McQueen. 2013. "Is the Gene-Environment Interaction Paradigm
Relevant to Genome-Wide Studies? The Case of Education and Body Mass Index." Demography 51(1):119-39. doi: 10.1007/s13524-013-0259-4.
Bookman, Ebony B., Kimberly McAllister, Elizabeth Gillanders, Kay Wanke, David Balshaw, Joni Rutter, Jill Reedy, Daniel Shaughnessy, Tanya Agurs‐Collins and Dina Paltoo. 2011. "Gene‐
Environment Interplay in Common Complex Diseases: Forging an Integrative Model—
Recommendations from an Nih Workshop." Genetic epidemiology 35(4):217-25.
Caspi, Avshalom, Joseph McClay, Terrie E. Moffitt, Jonathan Mill, Judy Martin, Ian W. Craig, Alan Taylor and Richie Poulton. 2002. "Role of Genotype in the Cycle of Violence in Maltreated Children." Science 297(5582):851.
Caspi, Avshalom, Karen Sugden, Terrie E. Moffitt, Alan Taylor, Ian W. Craig, HonaLee Harrington, Joseph McClay, Jonathan Mill, Judy Martin, Antony Braithwaite and Richie Poulton. 2003.
"Influence of Life Stress on Depression: Moderation by a Polymorphism in the 5-Htt Gene."
Science 301(5631):386.
Chabris, Christopher F., James J. Lee, David Cesarini, Daniel J. Benjamin and David I. Laibson. 2015.
"The Fourth Law of Behavior Genetics." Current Directions in Psychological Science 24(4):304- 12. doi: 10.1177/0963721415580430.
Chambers, John C., Paul Elliott, Delilah Zabaneh, Weihua Zhang, Yun Li, Philippe Froguel, David Balding, James Scott and Jaspal S. Kooner. 2008. "Common Genetic Variation near Mc4r Is Associated with Waist Circumference and Insulin Resistance." Nature Genetics 40(6):716-8.
Charney, Evan and William English. 2012. "Candidate Genes and Political Behavior." American Political Science Review 106(1):1-34. doi: 10.1017/S0003055411000554.
Chiolero, Arnaud, David Faeh, Fred Paccaud and Jacques Cornuz. 2008. "Consequences of Smoking for Body Weight, Body Fat Distribution, and Insulin Resistance." The American Journal of Clinical Nutrition 87(4):801-09.
Christakis, Nicholas A. M. D. PhD M. P. H. and James H. PhD Fowler. 2007. "The Spread of Obesity in a Large Social Network over 32 Years." The New England Journal of Medicine 357(4):370-9. doi:
http://dx.doi.org/10.1056/NEJMsa066082.
Clayton, D. G. 1978. "A Model for Association in Bivariate Life Tables and Its Application in Epidemiological Studies of Familial Tendency in Chronic Disease Incidence." Biometrika 65(1):141-51.
Cockerham, William C. 2005. "Health Lifestyle Theory and the Convergence of Agency and Structure."
Journal of Health and Social Behavior 46(1):51-67.
Conklin, Annalijn I. 2013. "Socioeconomic Status, Financial Hardship and Measured Obesity in Older Adults: A Cross-Sectional Study of the Epic-Norfolk Cohort." BMC public health 13(1):1.