Chemical characterization of volatile organic
compounds on animal farms
M. Ciganek, J. Neca
Veterinary Research Institute, Brno, Czech Republic
ABSTRACT: More than one hundred volatile organic substances were identified by gas chromatography and mass
spectrometry (GC/MS) in the indoor and outdoor air, stable and farm road dust and farm soil samples from two pig and cattle farms in the South Moravian Region. Volatile fatty acids (acetic, propanoic, butanoic and pentanoic acids) and their esters dominated along with aldehydes (butanal, pentanal and hexanal) and 4-methylphenol in the indoor and outdoor air samples. Road dust and soil samples contained mainly volatile aromatic compounds
(toluene, benzene, ethylbenzene, styrene and xylenes), aliphatic hydrocarbons (largely n-alkanes), dichloromethane
and carbon disulphide. The health risks associated with particular volatile compounds detected in the indoor and outdoor samples from the farms need to be assessed.
Keywords: VOCs; SPME; GC/MS; pigs; cattle
Supported by the Czech Science Foundation (Grant No. 525/04/0011).
Volatile organic compounds (VOCs) are non-methane organic compounds containing one or more carbon atoms that have high vapour pressures and therefore evaporate readily to the atmosphere (Pankow, 1987; U.S. EPA, 1992). VOC emissions result from natural and anthropogenic (man-made) sources. Natural sources of VOCs include vegeta-tion, forest fires, and animals (Lemieux et al., 2004; Buzcu and Fraser, 2006). Although natural sources of VOC emissions are more overall (Guenther et al., 1995), there are anthropogenic sources in popu-lated and industrialized areas that are another con-tributor to air quality. The major anthropogenic sources of VOCs are vehicles, the use of solvents and solvent containing products, and industrial and agricultural sources (Fenger, 1999; Schiffman et al., 2001; Klemp et al., 2002; Folsom Murphy and Allen, 2005).
Key symptoms associated with exposure to some VOCs with adverse effects for humans and animals include conjunctive irritation, nose and throat dis-comfort, headache, allergic skin reaction, nausea,
emesis, epistaxis, fatigue and dizziness (Jones, 1999). The potency of organic chemicals to cause health effects varies greatly from those that are highly toxic, to those with no known health effect (Eljarrat and Barcelo, 2003). As with other pollut-ants (such as persistent, bioaccumulative and toxic substances /PBTs/), the extent and nature of the health effect will depend on many factors including time and intensity of exposure. Eye and respiratory tract irritation, headaches, and memory impairment are among the immediate symptoms that some peo-ple have soon after exposure to some volatile or-ganics (Guo et al., 2004). At present, little is known about what health effects occur from the levels of organics usually found in the indoor and outdoor atmosphere. Many organic compounds are known to cause cancer in animals; some are suspected hu-man carcinogens (IARC, 1987, 1999a,b).
compounds have been identified in the air of pig buildings (Tamminga, 1992). These compounds are not only responsible for unpleasant odours but also they affect the comfort, health and production ef-ficiency of animals as well as the comfort and health of human workers (Tamminga, 1992). An overview of studies of VOCs emitted from animal (dairy and pig) facilities (Hartung and Phillips, 1994; Zahn et al., 1997; Schiffman et al., 2001) indicates that hundreds of substances can be present. A total of 331 different VOCs and fixed gases from pig facili-ties were identified by GC/MS in North Carolina (Schiffman et al., 2001). The compounds identified were diverse, and included many acids, alcohols, al-dehydes, amides, amines, aromatics, esters, ethers, halogenated hydrocarbons, hydrocarbons, ketones, nitriles, other nitrogen-containing compounds, phenols, sulphur-containing compounds, steroids and other compounds.
Odours from pig production facilities are associ-ated with the storage and decomposition of manure. Manure odours are a complex mixture of volatile fatty acids, alcohols, aromatic compounds, amides and sulphides produced during digestion and sub-sequent manure storage (O’Neill and Phillips, 1992; Hartung and Phillips, 1994). Microorganisms me-diate the odour compound production during the incomplete anaerobic fermentation of substances in manures (Mackie et al., 1998). However, aromatic compounds (3-methylindole) and volatile fatty ac-ids were most closely correlated with pig odour (Zahn et al., 1997, 2001; Powers et al., 1999).
Miller and Varel (2001, 2002, 2003) studied dif-ferences in the odour formation processes between cattle and pig manure. They found that odours from pig production were more unpleasant than odours from cattle production. Manure storage, handling, and treatment practices are very different between these facilities and are likely to account for some of the differences in perceived odour. Volatile fatty acids (mainly acetic, propanoic and butanoic ac-ids) and alcohols (ethanol and propanol) were the dominant compounds released from pig and cattle farms.
More than 100 compounds, including various paraffins, olefins, aromatics, ethers, alcohols, alde-hydes, ketones, halogenated hydrocarbons, phenols and sulphides were identified at five pig facilities in the eastern part of North Carolina (Blunden et al., 2005). Among total measured VOCs, oxygenated hydrocarbons, i.e. ethanol, methanol, acetaldehyde and acetone (ranged from 37 to 73% of the total)
emitted from the pig barns at various sites typically dominated.
Filipy et al. (2006) identified a total of 113 com-pounds at a lactating cow open stall and from a slurry wastewater lagoon. These compounds in-cluded alcohols, aldehydes, ketones, esters, ethers, aromatic hydrocarbons, halogenated hydrocarbons, terpenes, other hydrocarbons, amines, other nitro-gen-containing compounds, and sulphur-contain-ing compounds. Emission rates of some volatile compounds were reported in their paper.
Solid-phase microextraction (SPME) technology is a recent advance in sample preparation for trace analysis. In this solvent-free extraction technique, developed in 1990 by Arthur and Pawliszyn, the analytes are adsorbed directly from a gaseous or aqueous phase onto a fused silica fibre coated with a polymeric phase. Hence sampling, extraction and concentration are accomplished in a single step. Collected analytes are then thermally desorbed di-rectly to the gas chromatographic column and ana-lyzed by mass spectrometry (Chai and Pawliszyn, 1995; Koziel et al., 1999; Namiesnik et al., 2000).
Headspace solid-phase microextraction (HS-SPME) can be used for the analysis of volatile or-ganic compounds in the solid samples. This method uses a solvent-free sample preparation technique in which a fused silica fibre coated with polymeric organic liquids is introduced into the headspace above the sample closed in a glass vial. The vola-tilized organic analytes are extracted and concen-trated in the coating and then transferred to the GC/MS (Zhang and Pawliszyn, 1993; Llompart et al., 1999; Ezquerro et al., 2004). Cai et al. (2006) firstly characterized VOCs and odorants associ-ated with pig barn particulate matter using SPME and GC/MS.
The present study was focused on the analysis and chemical characterization of volatile organic compounds in the indoor and outdoor (ambient) environment of two selected pig and cattle farms. Indoor and outdoor air samples were analyzed by a home-made device suitable for dynamic sampling of analytes on SPME fibres followed by GC/MS analysis. Volatile organic compounds in stable dust, farm road dust and farm soil samples were analyzed by headspace solid-phase microextraction.
MATERIAL AND METHODS
Chemicals and materials
All standards of volatile organic compounds [benzene, toluene, ethylbenzene, xylenes, n-alkanes and EPA 524.2 VOC Mix (60 compounds in metha-nol)] were purchased from SUPELCO (Bellefonte, PA, USA). The concentration of each standard in methanol was 10 ng/ml.
SPME fibres [three types with different sorbent polarity – Polydimethylsiloxane (polymer film thick-ness 100 µm), Carboxen (70 µm) and Carbowax/ Divinylbenzene (65 µm)] were also purchased from SUPELCO (Bellefonte, PA, USA).
The AirCheck 2000 pump used for air sample collection was from SKC (Eighty Four, PA, USA).
Gaseous and solid sample collection
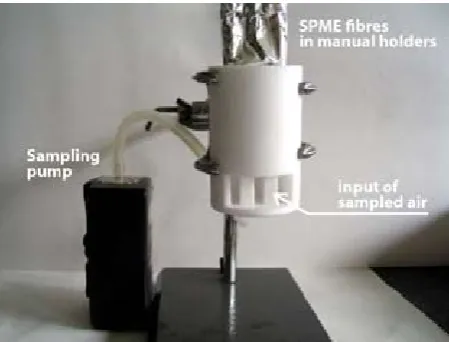
A home-made device (Figure 1) proper for a dy-namic sampling was designed for simultaneous col-lection of air samples on the three types of SPME fibres with different sorbent polarity. Sampling time was 30 min for indoor and 60 min for outdoor air with flow rate of sampled air 1 000 ml/min. The collection of indoor and outdoor air samples was started on one farm at the same time. SPME fibres with collected air samples were sealed with Teflon plug and shipped to the laboratory in a box cooled to about 6°C. Air samples were analyzed on the same day when they were collected. The content of analytes was normalized to 1 l of sampled air.
Three types of solid specimens were sampled di-rectly to the head-space glass vials of 60 ml volume. Stable dust (SD) samples from the selected stables, farm road dust (RD) and farm soil (S) samples from the outdoor surroundings of the farms at about 10 m from the selected stables were collected. Solid samples were shipped to the laboratory in the same way as SPME fibres. No manipulations with these samples were done before their HS-SPME analysis. All samples were analyzed next day.
Solid and air samples were collected on two pig (P1, P2) and two cattle farms (C1, C2) in the South Moravian Region of Czech Republic.
HS-SPME
The extraction of solid samples using HS-SPME was accomplished by placing the fibre in the head-space above the sample in a 60-ml headhead-space glass vial. Extraction temperature was 50°C; the extrac-tion procedure consisted of 10 min temperature equilibration of a sample to 50°C in the headspace vial followed by 20 min extraction successively with three types of SPME fibres, which were used for air sampling. Each SPME fibre was then analyzed by GC/MS.
GC/MS analysis
The GC/MS separation of volatile organic com-pounds was performed in a DB VRX fused silica capillary column (60 m × 0.25 mm I.D., 1.4 µm – J. and W. Scientific, Folsom, CA, USA). An ion trap mass spectrometer (Saturn 2100, Varian, Walnut Creek, CA, USA) was used for the detection and identification of the analytes. The mass spectrom-eter was operated in an electron ionization (EI) mode at the electron ionization energy of 70 eV. The identification of analytes was done by reten-tion time and by a comparison of the mass spectra of identified substances with standards. Unknown compounds were tentatively identified by matching of their mass spectra with mass spectral library (NIST 1998, Gaithersburg, MD, USA). SPME fibre desorption time and temperature were 10 min and 260°C, respectively.
The mass spectrometer used can operate as a se-lective detector in a selected ion monitoring mode and/or as a universal detector of organic matter, when it measures in a scan mode and detects all
[image:3.595.64.289.550.721.2]tensities of molecular and fragment ions of analytes. The sum of intensities of these ions interpreted as the total ion current can be used for evaluation of differences in the individual compound distribu-tion in analyzed samples.
RESULTS AND DISCUSSION
Optimization of analytical method
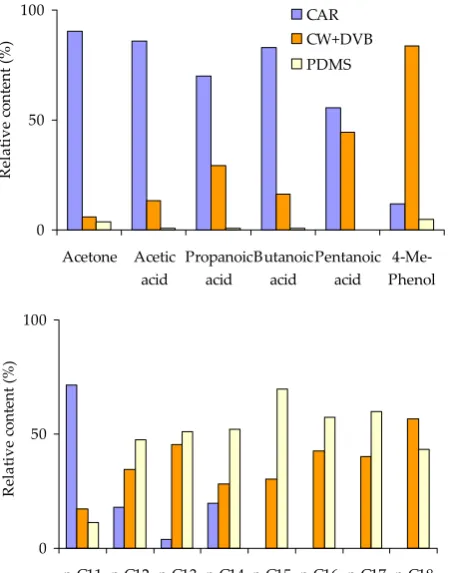
A dynamic sampling method with three types of SPME fibres with different sorbent polarity was used for simultaneous VOC collection from indoor and outdoor air samples. Sorption selectivity ex-pressed as relative amounts of three selected classes of compounds (oxygenated and aromatic com-pounds and n-alkanes) on the three types of SPME fibres (CAR-Carboxen, CW+DVB-Carbowax/ Divinylbenzene and PDMS-Polydimethylsiloxane) is summarized in Figure 2. Different SPME fibres were found to have different sorption selectivity for analyzed compounds. Volatile aromatic and oxygenated compounds (benzene, toluene, xylenes, acetone, acetic, propanoic and butanoic acids) were mainly adsorbed by Carboxen, polycyclic aromatic compounds and low volatile organic compounds
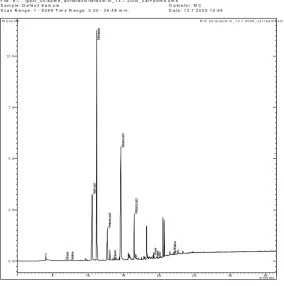
were collected predominantly by Carbowax/Di- vinylbenzene and low volatile n-alkanes by Polydimethylsiloxane SPME fibre. Abundances of individual substances collected on SMPE fibres were calculated as the sum of their abundances on the three individual SPME fibres used in this study. The identical procedure was used for HS-SPME determination of VOCs in solid samples. A typical SPME GC/MS chromatogram of air sample from the pig stable (P1) is shown in Figure 3.
Occurrence of volatile organic compounds on selected pig and cattle farms
More than one hundred abundant volatile organic substances were identified in the indoor and outdoor air, stable and road dust and soil samples from the two selected pig and cattle farms. Identified classes of volatile compounds with higher abundances are listed in Table 1. Acetic acid, butanoic acid, p-cresol, propanoic and pentanoic acids, phenol and hexanal prevailed in the indoor air of pig farms, acetic, buta-noic, propanoic acids, p-cresol, phenol and methyl esters of carboxylic acids mentioned above dominat-ed on cattle farms. Similar compounds dominatdominat-ed in the outdoor air. Acetic and propanoic acids, p-cresol,
0 50 100
Acetone Acetic acid
Propanoic acid
Butanoic acid
Pentanoic acid
4ȬMeȬ Phenol
R
el
at
iv
eȱ
co
nt
en
tȱ(
%
)
CAR CW+DVB PDMS
0 50 100
Benzene Toluene m,pȬ Xylene
Nap Indole 3MeȬ
Indole
R
el
at
iv
eȱ
co
nt
en
tȱ(
%
)
0 50 100
nȬC11 nȬC12 nȬC13 nȬC14 nȬC15 nȬC16 nȬC17 nȬC18
R
el
at
iv
e
ȱ
co
nt
en
t
ȱ
(%
[image:4.595.64.289.463.750.2])
Figure 2. Comparison of the sorption efficiency of three different SPME fibres on three selected compound classes
Table 1. List of abundant volatile organic compounds identified in the indoor and outdoor parts of animal farms
Oxygenated compounds Aromatic hydrocarbons
Alcohols and ketones
ethanol
BTEX
benzene
acetone toluene
6-heptene-2,4-diol ethylbenzene
ethyl Acetate m,p-xylene
3-hexen-1-ol o-xylene
2-hexanol styrene
3-methyl-4-nonanone
Alkylbenzenes
iso-propylbenzene
5-hepten-2-one n-propylbenzene
3-nonen-1-ol 1-ethyl-3-methylbenzene
Phenols
phenol 1-ehylt-4-methylbenzene
2-methylphenol 1,3,5-trimethylbenzene
4-methylphenol (p-cresol) 1-ethyl-2-methylbenzene
Aldehydes
hexanal t-butylbenzene
heptanal 1,2,4-trimethylbenzene
octanal sec-butylbenzene
Carboxylic acids
acetic acid iso-butylbenzene
acetic acid methyl ester p-IsoPropyl-Toluene
propanoic acid ethyl ester 1,2,3-trimethylbenzene
propanoic acid 1,3-diethylbenzene
3-methylbutanoic acid 1,4-diethylbenzene
propanoic acid propyl ester n-butylbenzene
butanoic acid 1,4-dimethyl-2-ethylbenzene
3-methylpentanoic acid 1,3-dimethyl-4-ettylbenzene
2-methylpentanoic acid 1,2-dimethyl-2-ethylbenzene
butanoic acid propyl ester 1,2,4,5-tetramethylbenzene
pentanoic acid 1,2,3,5-tetramethylbenzene
hexanoic acid methyl ester 1,2,3,4-tetramethylbenzene
hexanoic acid ethyl ester
Polycyclic aromatic hydrocarbons
1,2,3,4-tetrahydronaphthalene
ethyl benzoate naphthalene
hexanoic acid propyl ester 1-methylnaphthalene
Nitrogen-containing compounds
1,2-propanediamine 2-methylnaphthalene
1-methylamine biphenyl
cyclobutylamine methylbiphenyl
n,n-dimethylformamide 1h-indene
aniline 3-methyl-1h-indole
benzonitrile
Hydrocarbons
methylcyclohexane
Sulphur-containing com-pounds
carbon disulphide n-heptane
dimethylsulphide n-octane
dimethyldisulphide n-nonane
Chlorinated compounds
methylene chloride n-decane
chloroform n-undecane
trichloroethylene n-dodecane
tetrachloroethylene n-tridecane
chlorobenzene n-tetradecane
n-pentadecane
pentanoic and butanoic acids dominated in the sta-ble dust likewise in air samples. Toluene, ethylben-zene, benethylben-zene, xylenes and n-alkanes, compounds mainly emitted from vehicles, were dominant in road dust and soil samples.
The abundance ratios of selected compound class-es and/or individual compounds can be used for
determination of compounds which are mainly emit-ted from indoor or outdoor sources. Compounds emitted from indoor sources will have the In/Out ratio > 1. In/Out ratios of selected compound classes are summarized in Table 2. Oxygenated compounds with higher values of this ratio were mainly emitted from indoor sources on pig farms. Alkylbenzenes, alkanes and PAHs were mainly emitted from out-door sources. Some substances were identified only in the indoor air of pig and cattle stables (maleic acid, propanoic acid, pentadecanoic acid, p-cresol, 1-methylamine), 3-methylindole was detected only on pig farms. The highest In/Out ratios were found for acetic acid on the pig farms – 230 (P1) and 102 (P2).
Distribution of VOCs in the indoor and outdoor air
The results of chemical analyses showed signifi-cant differences in the total VOC abundances be-tween the indoor and outdoor air samples of two pig (P1, P2) and two cattle (C1, C2) farms (Figure 4). The highest abundances were always found in the indoor air samples. Total VOC abundances were 9.6 (farm P1), 6.1 (farm P2) ,1.5 (farm C1) and 4.2 (farm C2) times higher in the indoor air samples in C h r o m a to g r a m P lo t
F ile : d : \... \g a c r _ 0 5 \s p m e _ a ir \te r e z in \te r e z in - in _ 1 3 .7 .2 0 0 5 _ c a r+ p d m s .s m s S a m p le : D e fa u l t S a m p le O p e r a to r : M C S c a n R a n g e : 1 - 8 0 8 9 T im e R a n g e : 0 .0 0 - 3 6 .4 8 m i n . D a te : 1 3 .7 .2 0 0 5 1 5 :4 6
5 1 0 1 5 2 0 2 5 3 0 m i n u te s3 5
0 .0 2 .5 5 .0 7 .5 1 0 .0
M C o u n ts R IC a ll te r e z in - in _ 1 3 .7 .2 0 0 5 _ c a r + p d m s .s m s
Eth
an
ol
Ac
eto
ne
Ac
eti
c a
cid
Me
-He
xan
e
Pe
nta
no
ic a
cid
To
lue
ne
Bu
tan
oic
ac
id
Pe
nta
no
ic a
cid
Ph
en
ol
Ind
en
e Naphtha
len
[image:6.595.65.350.97.384.2]e
Figure 3. Typical SPME GC/MS chromato-gram of VOC analysis of indoor air from a pig stable (P1)
Table 2. Abundance ratios of selected compound classes for the indoor and outdoor air
Compounds In/Out ratios
P1 P2 C1 C2
N-Compounds1 2.0 2.4 4.3 2.6
O-Compounds2 128.0 30.3 8.4 10.3
Cl-Compounds3 1.6 2.1 2.3 2.4
BTEX4 2.0 1.5 0.3 3.6
Alkylbenzenes 0.3 1.5 0.4 0.6
Alkanes 0.6 2.7 0.7 3.2
PAHs 3.2 3.7 6.0 0.9
P1 and P2 = pig farm No. 1 and 2; C1 and C2 = cattle farm No. 1 and 2
1nitrogen-containing compounds; 2oxygen-containing
com-pounds; 3halogenated compounds; 4benzene, toluene,
[image:6.595.63.293.531.685.2]comparison with the outdoor air samples on two pig and cattle houses, respectively.
Chemical analysis of selected classes of organic compounds showed a different distribution of these
compounds in the indoor and outdoor air expressed as their relative contents (Figure 5). Oxygenated organic compounds (mainly volatile fatty acids) dominated in the indoor air of all farms except one cattle farm (C1). The dominance of volatile aromatic compounds (BTEX) in the outdoor air of a cattle farm (C1) was caused by the emissions from tractors used for distribution of feedstuffs around the farm.
[image:7.595.68.280.80.269.2]Distribution of VOCs in the solid samples
Figure 6 shows differences in the total VOC abundances among the indoor stable dust (SD) and outdoor road dust (RD) and soil (S) samples. It was found that stable dust, similarly like indoor air, contained the highest total amount of VOCs. These abundances were from 3.1 to 44.3 and from 13.6 to 76.6 times higher in stable dust compared with road dust and soil, respectively. The highest total VOC abundances were found in the stable dust (SD) and road dust (RD) on the cattle farm C2. Total VOC abundances were similar for soil samples on all pig and cattle farms under study. 0.0E+00
2.0E+07 4.0E+07
P1 P2 C1 C2
A
bu
nd
an
ce
IȬAir
OȬAir
Figure 4. Differences in VOC distribution between the indoor and outdoor (ambient) air on the pig and cattle farms
[image:7.595.71.530.418.699.2]I-Air (O-Air) = indoor (outdoor) air of two pig (P1, P2) and two cattle (C1, C2) farms
Figure 5. Relative content (%) of VOC classes in the indoor and outdoor air
I-Air (O-Air) = indoor (outdoor) air of two pig (P1, P2) and two cattle (C1, C2) farms;
N-Comp = nitrogen-containing compounds; O-Comp = oxygen-containing compounds; Cl-Comp = halogenated compounds; S-Comp = sulphur-containing compounds; BTEX = benzene, toluene, ethylbenzene and xylenes; Alk-B = alkylated benzenes
PigȱfarmȱP1
0 50 100
ȱNȬ
Comp OȬ Comp ClȬ Comp SȬ Comp
BTEX AlkȬB Alkanes PAHs
Re la tiv e ȱ co nt en t ȱ (% )
IȬAir OȬAir
PigȱfarmȱP2
0 50 100
ȱNȬ
Comp OȬ Comp ClȬ Comp SȬ Comp
BTEX AlkȬB Alkanes PAHs
Re la tiv e ȱ co nt en t ȱ (% )
CattleȱfarmȱC1
0 50 100
ȱNȬ
Comp OȬ Comp ClȬ Comp SȬ Comp
BTEX AlkȬB Alkanes PAHs
Re la tiv e ȱ co nt en t ȱ (% )
CattleȱfarmȱC2
0 50 100
ȱNȬ
Comp OȬ Comp ClȬ Comp SȬ Comp
BTEX AlkȬB Alkanes PAHs
Re la tiv e ȱ co nt en t ȱ (% ) CattleȱfarmȱC2 0 40 80 ȱNȬ Comp OȬ Comp ClȬ Comp
SȬComp BTEX AlkȬB Alkanes PAHs
R el at iv e ȱ co nt en t ȱ (% ) CattleȱfarmȱC2 0 40 80 ȱNȬ Comp OȬ Comp ClȬ Comp
SȬComp BTEX AlkȬB Alkanes PAHs
R el at iv e ȱ co nt en t ȱ (% ) CattleȱfarmȱC2 0 40 80 ȱNȬ Comp OȬ Comp ClȬ Comp
SȬComp BTEX AlkȬB Alkanes PAHs
R el at iv e ȱ co nt en t ȱ (% ) CattleȱfarmȱC2 0 40 80 ȱNȬ Comp OȬ Comp ClȬ Comp
SȬComp BTEX AlkȬB Alkanes PAHs
Relative contents (percentages of selected classes of organic compounds) were used for characteriza-tion of differences in the distribucharacteriza-tion of substances in the indoor air (I-Air) and stable dust (SD) samples (Figure 7) and outdoor air (O-Air), road dust (RD) and soil samples (S) (Figure 8). Oxygenated compounds (O-Comp) prevailed in the indoor air and stable dust
on both pig farms. Volatile aromatic compounds (BTEX), chlorinated compounds (Cl-Comp), nitro-gen-containing compounds (N-Comp) and alkanes were other classes prevalent on the cattle farms.
Different distribution of selected substances was found in the outdoor air, road dust and soil sam-ples. A high relative content of nitrogen-containing compounds was found in all samples due to high abundances of 1,2-propanediamine and dimethylfor-mamide, mainly in soil and road dust on the pig (P1) and cattle (C1) farms. Alkanes and volatile aromatic compounds, substances mainly emitted from vehi-cles and transported around for a long time, were other contaminants found in the outdoor samples of the farms. The relative content of these compound classes in the outdoor farm samples was occasional due to time and concentration differences.
It was found that oxygenated organic compounds, acetic acid and 4-methylphenol with the greatest abundances were largely distributed in the indoor environment.
Statistical evaluation of analytical data
Pearson’s correlation coefficient (R) and two tailed
t-test were used for statistical evaluation of the 0.0E+00
6.0E+07 1.2E+08
P1 P2 C1 C2
[image:8.595.72.285.84.265.2]A bu nd an ce SD RD S
Figure 6. Differences in VOC content between solid sam-ples from animal farms
SD = stable dust; RD = road dust; S = soil of samples from pig (P1, P2) and cattle (C1, C2) farms
PigȱfarmȱP1 0 50 100 ȱNȬ Comp OȬ Comp ClȬ Comp
SȬComp BTEX AlkȬB Alkanes PAHs
R el at iv e ȱ co nt en t ȱ (% ) IȬAir SD
PigȱfarmȱP2
0 40 80
ȱNȬ
Comp
OȬComp ClȬ
Comp
SȬComp BTEX AlkȬB Alkanes PAHs
R el at iv e ȱ co nt en t ȱ (% )
CattleȱfarmȱC1
0 40 80
ȱNȬ
Comp
OȬComp ClȬ
Comp
SȬComp BTEX AlkȬB Alkanes PAHs
R el at iv e ȱ co nt en t ȱ (% )
CattleȱfarmȱC2
0 40 80
ȱNȬ Comp
OȬComp ClȬ
Comp
SȬComp BTEX AlkȬB Alkanes PAHs
[image:8.595.67.532.449.724.2]R el at iv e ȱ co nt en t ȱ (% )
Figure 7. Relative content (%) of VOC classes in the indoor samples of pig and cattle farms
I-Air = indoor air; SD = stable dust of two pig (P1, P2) and two cattle (C1, C2) farms; x-axis abbreviations see Figure 5 CattleȱfarmȱC2 0 40 80 ȱNȬ Comp OȬ Comp ClȬ Comp
SȬComp BTEX AlkȬB Alkanes PAHs
R el at iv e ȱ co nt en t ȱ (% ) CattleȱfarmȱC2 0 40 80 ȱNȬ Comp OȬ Comp ClȬ Comp
SȬComp BTEX AlkȬB Alkanes PAHs
R el at iv e ȱ co nt en t ȱ (% ) CattleȱfarmȱC2 0 40 80 ȱNȬ Comp OȬ Comp ClȬ Comp
SȬComp BTEX AlkȬB Alkanes PAHs
R el at iv e ȱ co nt en t ȱ (% ) CattleȱfarmȱC2 0 40 80 ȱNȬ Comp OȬ Comp ClȬ Comp
SȬComp BTEX AlkȬB Alkanes PAHs
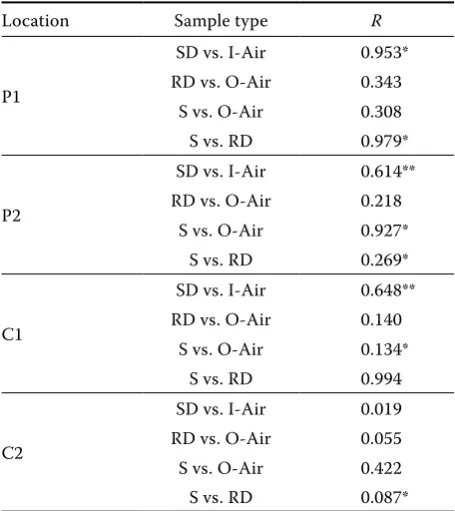
distribution of individual compounds among se-lected sample types on the animal farms under study (Table 3).
Correlations were tested between two samples from the indoor pig and cattle houses (stable dust vs. indoor air) and three outdoor samples (road dust vs. outdoor air, soil vs. outdoor air and soil vs. road dust). All tested pairs showed positive correlations, which means that if the abundance of a compound in one sample type from the tested pair increased, its abundance in the other type also rose.
The highest correlation was found for soil and road dust from outdoors of cattle farm C1 (0.994). Soil-road dust (0.978) and stable dust-indoor air (0.953) from pig farm P1 and soil-outdoor air (0.923) from pig farm P1 were other samples with a higher correlation. No correlation was determined for stable dust-indoor air, road dust-outdoor air and soil-road dust from cattle farm C2. Low or medium correlations were detected for the other samples (values between 0.1 and 0.7).
The results of evaluation of statistical signifi-cances between individual abundances of analyzed compounds are summarized in the last two
col-PigȱfarmȱP1
0 40 80
ȱNȬ
Comp OȬ Comp
ClȬ Comp
SȬComp BTEX AlkȬB Alkanes PAHs
R
el
at
iv
e
ȱ
co
nt
en
t
ȱ
(%
)
OȬAir RD S
PigȱfarmȱP2
0 40 80
1 2 3 4 5 6 7 8
R
el
at
iv
eȱ
co
nt
en
tȱ(
%
)
CattleȱfarmȱC1
0 40 80
ȱNȬ Comp
OȬ Comp
ClȬ Comp
SȬComp BTEX AlkȬB Alkanes PAHs
R
el
at
iv
e
ȱ
co
nt
en
t
ȱ
(%
)
CattleȱfarmȱC2
0 40 80
ȱNȬ Comp
OȬ Comp
ClȬ Comp
SȬComp BTEX AlkȬB Alkanes PAHs
R
el
at
iv
e
ȱ
co
nt
en
t
ȱ
(%
[image:9.595.64.533.80.390.2])
Figure 8. Relative content (%) of VOC classes in the outdoor samples
O-Air = outdoor air; RD = road dust; S = soil of two pig (P1, P2) and two cattle (C1, C2) farms; x-axis abbreviations see Figure 5
CattleȱfarmȱC2
0 40 80
ȱNȬ
Comp OȬ Comp
ClȬ Comp
SȬComp BTEX AlkȬB Alkanes PAHs
R
el
at
iv
e
ȱ
co
nt
en
t
ȱ
(%
)
umns of Table 3. Significant statistical differences were found between stable dust-indoor air and soil-road dust from pig farm P1; stable dust-indoor air, soil-outdoor air and soil-road dust from pig farm P2; stable dust-indoor air and soil-outdoor air from cattle farm C1 and soil-road dust from cattle farm C2. No significant statistical differences were found for all road dust-outdoor air samples and soil-out-door air samples except for cattle farm C1.
CONCLUSIONS
Two analytical methods for the determination of volatile organic compounds in the air (SPME GC/MS) and solid samples (HS-SPME GC/MS) were de-veloped. These simple methods were used for chemical characterization of VOCs in the indoor and outdoor parts of animal farms. More than one hundred abundant organic compounds were identi-fied by GC/MS in the indoor and outdoor air, stable and farm road dust and farm soil samples.
relative abundances were largely distributed in the indoor environment. Volatile aromatic compounds (BTEX) and alkanes prevailed in the outdoor sam-ples of pig and cattle farms. Stable dust contained mainly volatile fatty acids (acetic, propanoic and butanoic acids); road dust and soil largely contained toluene, alkanes and compounds emitted from vehi-cles and long-term atmospheric transport. Toxicity and hazard identification of volatile compounds should be characterized in future studies.
REFERENCES
Arthur C.L., Pawliszyn J. (1990): Solid phase microex-traction with thermal desorption using fused silica optical fibers. Analytical Chemistry, 62, 2145–2148. Blunden J., Aneja V.P, Lonneman W.A. (2005):
Charac-terization of non-methane volatile organic compounds at swine facilities in eastern North Carolina. Atmos-pheric Environment, 39, 6707–6718.
Buzcu B., Fraser M.P. (2006): Source identification and apportionment of volatile organic compounds in Hou-ston, TX. Atmospheric Environment, 40, 2385–2400. Cai L., Koziel J.A., Lo Y.-Ch., Hoff S.J. (2006):
Charac-terization of volatile organic compounds and odorants
associated with swine barn particulate matter using solid-phase microextraction and gas chromatography-mass spectrometry-olfactometry. Journal of Chroma-tography A, 1102, 60–72.
Chai M., Pawliszyn J. (1995): Analysis of environmental air samples by solid-phase microextraction and gas chromatography/ion trap mass spectrometry. Envi-ronmental Science and Technology, 29, 693–701. Ciganek M., Neca J. (2006): Polycyclic aromatic
hydro-carbons in porcine and bovine organs and tissues. Veterinarni Medicina, 51, 239–247.
Ciganek M., Neca J., Machala M., Raszyk J. (1999): Anal-ysis of polycyclic aromatic hydrocarbons and their nitro-derivatives in farm road and barn dust. Toxico-logical and Environmental Chemistry, 72, 183–194. Ciganek M., Raszyk J., Kohoutek J., Ansorgova A., Salava
J., Palac J. (2000): Polycyclic aromatic hydrocarbons (PAHs, nitro-PAHs, oxy-PAHs), polychlorinated bi-phenyls (PCBs) and organic chlorinated pesticides (OCPs) in the indoor and outdoor air of pig and cattle houses. Veterinarni Medicina, 45, 217–226.
Ciganek M., Ulrich R., Neca J., Raszyk J. (2002): Exposure of pig fatteners and dairy cows to polycyclic aromatic hydrocarbons. Veterinarni Medicina, 47, 137–142. Eljarrat E., Barcelo D. (2003): Priority lists for persistent
organic pollutants and emerging contaminants based on their relative toxic potency in environmental sam-ples. Trends in Analytical Chemistry, 22, 655–665. Ezquerro O., Ortiz G., Pons B., Tena M.T. (2004):
Deter-mination of benzene, toluene, ethylbenzene and xylenes in soils by multiple headspace solid-phase microextrac-tion. Journal of Chromatography A, 1035, 17–22. Filipy J., Rumburg B., Mount G., Westberg H., Lamb B.
(2006): Identification and quantification of volatile organic compounds from a dairy. Atmospheric Envi-ronment, 40, 1480–1494.
Fenger J. (1999): Urban air quality. Atmospheric Environ-ment, 33, 4877–4900.
Folsom Murphy C.F, Allen D.T. (2005): Hydrocarbon emissions from industrial release events in the Hou-ston-Galveston area and their impact on ozone forma-tion. Atmospheric Environment, 39, 3785–3798. Guenther A., Hewitt C.N., Erickson D., Fall R., Geron C.,
[image:10.595.63.291.101.357.2]Graedel T., Harley P., Klinger L., Lerdau M., McKay W.A., Pierce T., Scholes B., Steinbrecher R., Tallamraju R., Tay-lor J., Zimmerman P. (1995): A global model of natural volatile organic compound emissions. Journal of Geo-physical Research – Atmospheres, 100 (D5), 8873–8892. Guo H., Lee S.C., Chan L.Y., Li W.M. (2004): Risk assess-ment of exposure to volatile organic compounds in different indoor environments. Environmental Re-search, 94, 57–66.
Table 3. Statistical evaluation of analytical data
Location Sample type R
P1
SD vs. I-Air 0.953*
RD vs. O-Air 0.343
S vs. O-Air 0.308
S vs. RD 0.979*
P2
SD vs. I-Air 0.614**
RD vs. O-Air 0.218
S vs. O-Air 0.927*
S vs. RD 0.269*
C1
SD vs. I-Air 0.648**
RD vs. O-Air 0.140
S vs. O-Air 0.134*
S vs. RD 0.994
C2
SD vs. I-Air 0.019
RD vs. O-Air 0.055
S vs. O-Air 0.422
S vs. RD 0.087*
R = Pearson’s correlation coefficient; I-Air = indoor air; O-Air
= outdoor air; RD = road dust; SD = stable dust; S = soil
Hartung J., Phillips V.R. (1994): Control of gaseous emis-sions from livestock buildings and manure stores. Jour-nal of Agricultural Engineering Research, 57, 173–189. IARC (International Agency for Research on Cancer)
(1987): Benzene (Group 1) – Summaries & Evalua-tions. Suppl. 7, 120.
IARC (International Agency for Research on Cancer) (1999a): Toluene (Group 3) – Summaries & Evalua-tions. Vol. 71, 829.
IARC (International Agency for Research on Cancer) (1999b): Xylenes (Group 3) – Summaries & Evalua-tions. Vol. 71, 1189.
Jones A.P. (1999): Indoor air quality and health. Atmos-pheric Environment, 33, 4535–4564.
Klemp D., Mannschreck K., H.W. Patz H.W., Habram M., Matuska P., Slemr F. (2002): Determination of anthro-pogenic emission ratios in the Augsburg area from con-centration ratios: results from long-term measurements. Atmospheric Environment, 36, Suppl. 1, S1–S80. Koziel J., Jia M., Khaled A., Noah J., Pawliszyn J. (1999):
Field air analysis with SPME device. Analytica Chim-ica Acta, 400, 153–162.
Lemieux P.M., Lutes C.C, Santoianni D.A. (2004): Emis-sions of organic air toxics from open burning: a com-prehensive review. Progress in Energy and Combustion Science, 30, 1–32.
Llompart M., Li K., Fingas M. (1999): Headspace solid phase microextraction (HSSPME) for the determina-tion of volatile and semivolatile pollutants in soils. Talanta, 48, 451–459.
Mackie R.I., Stroot P.G., Varel V.H. (1998): Biochemical identification and biochemical origin of key odor com-ponents in livestock waste. Journal of Animal Science, 76, 1331–1342.
Miller D.N., Varel V.H. (2001): In vitro study of the
bio-chemical origin and production limits of odorous compounds in cattle feedlots. Journal of Animal Sci-ence, 79, 2949–2956.
Miller D.N., Varel V.H. (2002): In vitro study of manure
composition on the biochemical origins, composition, and accumulation of odorous compounds in cattle feedlots. Journal of Animal Science, 80, 2214–2222. Miller D.N., Varel V.H. (2003): Swine manure
composi-tion affects the biochemical origins, composicomposi-tion, and accumulation of odorous compounds. Journal of An-imal Science, 81, 2131–2138.
Namiesnik J., Zygmunt B., Jastrzebska A. (2000): Ap-plication of solid-phase microextraction for determi-nation of organic vapours in gaseous matrices. Journal of Chromatography A, 885, 405–418.
O’Neill D.H., Phillips V.R. (1992): A review of the control of odour nuisance from livestock buildings: Part 3, prop-erties of the odorous substances which have been identi-fied in livestock wastes or in the air around them. Journal of Agricultural Engineering Research, 53, 23–50. Pankow J.F. (1987): Review and comparative analysis of
the theories on partitioning between the gas and aer-osol particulate phases in the atmosphere. Atmos-pheric Environment, 21, 2275–2283.
Powers W.J., Van Horn H.H., Wilkie A.C., Wilcox C.J., Nordstedt R.A. (1999): Effects of anaerobic digestion and additives to effluent or cattle feed on odor and odorant concentration. Journal of Animal Science, 77, 1412–1421.
Raszyk J., Ulrich R., Gajduskova V., Salava J., Palac J. (1998): Occurrence of carcinogenic polycyclic aro-matic hydrocarbons (PAH) on pig and cattle farms (in Czech). Veterinarni Medicina, 43, 17–25.
Schiffman S.S., Bennett J.L., Raymer J.H. (2001): Quan-tification of odors and odorants from swine operations in North Carolina. Agricultural and Forest Meteorol-ogy, 10, 213–240.
Tamminga S. (1992): Gaseous pollutants by farm animal enterprises. In: Phillips C., Piggins D. (ed.): Farm An-imals and the Environment. CAB International, Wall-ingford, U.K. 345–357.
U.S. EPA (1992): VOC definition. Federal Register. Vol. 57, No. 22.
Zahn J.A., Hatfield J.L., Do Y.S., DiSpirito A.A., Laird D.A., Pfeiffer R.L. (1997): Characterization of volatile organic emissions and wastes from a swine production facility. Journal of Environmental Quality, 26, 1687–1696. Zahn J.A., DiSpirito A.A., Do Y.S., Brooks B.E., Cooper
E.E., Hatfield J.L. (2001): Correlation of human olfactory responses to airborne concentrations of malodorous volatile organic compounds emitted from swine efflu-ent. Journal of Environmental Quality, 30, 624–634. Zhang Z., Pawliszyn J. (1993): Headspace solid-phase
mi-croextraction. Analytical Chemistry, 65, 1843–1852.
Received: 2008–05–21 Accepted after corrections: 2008–11–20
Corresponding Author: