Final Draft Report for Peatscapes
SWIMMER, University of Liverpool
SWIMMER
3rd Floor Nicholson Building University of Liverpool
CONTENTS
Executive Summary ...2
Project Background...3
Aims and justification...3
Key objectives...3
Study design...3
Funding ...5
Deviations from original proposal ...5
Overall scientific rationale...5
Analytical methods ...8
Phase 1 Optimisation of enzyme assays for peat from Langdon and Goyt moor...8
1. Determination of maximal enzyme reaction rate and substrate incubation length 8 2. Effect of homogenization, filtering and exposure to air on β-glucosidase activity9 3. Comparison of enzyme activities in surface and 1 metre deep peat ...9
Sampling Design...9
Phase 2 A preliminary investigation into the effects of drain-blocking at Langdon moor on enzyme activities and colour. ...9
Results...11
Phase 1 Optimisation of enzyme assays for Langdon and Goyt moor...11
1. Determination of maximal enzyme reaction rate and substrate incubation length ...11
2. Effect of homogenisation, filtering and exposure to air on β-glucosidase activity ...14
3. Comparison of enzyme activities in peat from surface and 1 metre depth...16
Phase 2 Preliminary investigation into the short-term effects of drain-blocking on enzyme activities and colour at Langdon moor....18
Discussion...31
1. Determination of maximal enzyme reaction rate and substrate incubation length ...31
2. Effect of homogenisation, filtering and exposure to air on β-glucosidase activity ...31
3. Comparison of enzyme activities in surface and 1 metre deep peat ...32
References...36
Principal Investigators: Prof Ed Maltby Dr Rick Leah Lead Researcher Dr Samuel Bonnett Technical Support Mr Mike O’Connor
Acknowledgements
We would like to acknowledge the financial support of the AONB Peatscapes Project and their assistance in making arrangements for access to suitable areas of land. Access to the study area has been kindly given by the Raby Estate.
This document should be cited as
Executive Summary
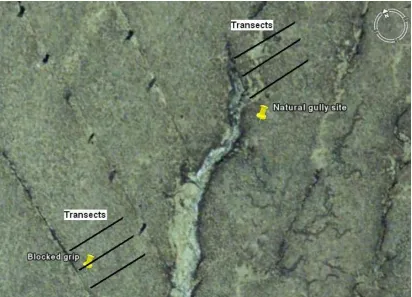
It has become evident that there is a general problem of increasing colour in the water draining from areas of accumulated peat in upland Britain. It was agreed in early 2007 to set up a preliminary investigation into the causes of change in colour using methods based on characterising the breakdown and oxidation of peat. These make use of techniques to measure the activities of extracellular enzymes which catalyse the process of decomposition independently from the microbial population. The overall aim of this investigation was to investigate the effect of grip blocking on the enzymic decomposition of peat and the consequential production of colour. The main study area is located within Langdon Moor, part of the Raby Estate. Peat samples were collected at 5 m intervals along transects perpendicular to a natural gully and a blocked grip. At each 5 m interval peat samples were collected at 5 depths down to 85 cm depth. Peat samples were analysed in the laboratory for carbon-related enzyme activities, microbial activity, colour and phenolic concentration.
There were clear differences between enzyme activities in surface peat when compared with peat from greater depth at both study sites. There were no significant differences in magnitude of enzyme activity levels in surface peat from either area. However, there were significant differences between the areas for a number of parameters including enzyme activities in peat collected from depths between 5 and 85cms. These results suggest that increased retention of water within Langdon moor, as a result of grip blocking has caused a significant impact on the amount of colour and phenolic compounds with increasing depth relative to the amounts in a naturally drained area. Furthermore, the relationship between water colour and the concentration of phenolic compounds has been altered in the area of the blocked grip. This indicates some difference, yet to be elucidated, in the processes producing the colour deriving from the two drainage states.
There were also significant differences in amounts of colour and phenolic compounds, but not enzyme activities with increasing distance from the blocked grip in contrast to the naturally drained area where amounts were less variable. This again indicates a significant influence of altered drainage patterns on the amount and quality of the coloured compounds produced from the breakdown of peat.
Further detailed research will be required to determine whether this phenomenon is site specific or widespread in peatlands, and to the cause and effect of changing enzyme activity, phenolics and colour in peatlands. This preliminary study has only focused on one site per management treatment and therefore, at this stage, the results must be considered to be preliminary and site specific to Langdon moor rather than applicable to peatlands in general.
Project Background
It has become evident that there is a general problem of increasing colour in the water draining from areas of accumulated peat in upland Britain and elsewhere (Worrall et al., 2003;Worrall et al., 2004; Evans et al., 2005; Clark et al., 2005; Freeman et al., 2001a; Worrall et al., 2007). The colour is caused by various organic compounds (usually referred to as Dissolved Organic Carbon, DOC) derived from the oxidation and breakdown of peat. Although this is a widespread phenomenon, until now, the underlying causes of the increased output of colour have not been satisfactorily determined.
It was agreed in early 2007 to set up a preliminary investigation into the causes of change in colour using methods based on characterising the breakdown and oxidation of peat. These make use of techniques to measure the activities of extracellular enzymes which catalyse the process of decomposition independently from the microbial population. The study was carried out in moorlands included within the ‘Peatscapes’ project where there are a number of locations known to be affected by increasing outputs of colour.
A hypothesis has been developed that the increased breakdown of organic matter is due to drying out of peat bogs due to human activity (drainage i.e. grips) and climate change, which changes enzyme activity and subsequent rates of peat decomposition.
Aims and justification
The overall aim of this investigation was to investigate the effect of grip blocking on the enzymic decomposition of peat and the consequential production of colour.
One of the primary causes of degradation and loss of carbon from peatland ecosystems has been attributed to drainage ditches (grips) that were originally dug to reduce waterlogging for agricultural reclamation, afforestation or improved grouse moor management over recent decades. It has been suggested that lowering of the water table increases ingress of oxygen into the peat mass leading to increased CO2
production and dissolved organic carbon (DOC) export because of elevated aerobic microbial activity. Work by Freeman et al. (2001b) suggests that an ‘enzymic-latch mechanism’ may be responsible for this continuing loss of carbon. However, the extent to which this mechanism is actually reversed by drain blocking, producing a consequential reduction in carbon (C) release, has not been fully investigated.
Key objectives
Phase1 Optimisation of enzyme assays for Langdon and Goyt moor
Phase 2 Preliminary investigation into the short-term effects of drain-blocking at Langdon moor on enzyme activities and colour.
Study design
northern England, i.e. a maximum age in the range 10 000 – 15 000 radiocarbon years BP (Heal and Smith, 1978). The underlying geology is a succession of carboniferous limestones, sands and shales with intrusions of a dolerite sill (Johnson and Dunham, 1963). This solid geology is covered by glacial till with poor drainage which facilitated the development of blanket peat. The vegetation is dominated by Eriophorum sp. (cotton grass), Calluna vulgaris (heather) and Sphagnum sp. (moss). The mean annual temperature (1991-2007) is 6.2 ºC. Mean annual precipitation (1953-2000) is 1953 mm (Burt et al., 1998) with snow being a significant proportion of precipitation – annual average snow cover at 500 m is 55 days (Archer and Stewart, 1995). The depth of peat at Moor House varies between 1.5 m in depth to up to 3.5 m deep (Chambers, 1978).
Fig. 1 Location of the study site at Langdon moor (red dot)
Langdon moor was chosen as the main site for investigation as it had been drained many years ago but some of the grips have been blocked within the last twelve years. The study was conducted in two parts. Phase 1 involved collection of peat samples for optimization of enzyme methods to be used in Phase 2 This was a preliminary investigation into the short-term effects of drain-blocking (‘grip-blocking’) management on enzyme activities in peat and the production of DOC.
In addition to the work at Langdon moor, some comparative peat samples were collected from Goyt moor (53º14’44 N 01º58’13 W) as a separate exercise using additional, non-Peatscapes funding available to SWIMMER. These peat samples were used to optimise the methods used and provide an initial comparison of the characteristics of peat from the two areas.
Funding
This project was always intended to be a ‘development’ project to optimise and apply fairly novel methods of analysis to a new area of study. As was expected, the investigations consumed significantly more time and materials than budgeted for within the application to Peatscapes but all of the work is reported here as one project. The balance of funding was provided from alternative sources available to SWIMMER from within the University of Liverpool. This is in keeping with the developmental nature of the project which has enhanced the capability of SWIMMER to participate in this area of research.
Deviations from original proposal
Because of the developmental nature of the project, it was not practicable to determine all of the originally proposed determinands within the scope of the work reported here because of some unexpected methodological difficulties combined with limitations of the budget. The originally specified variables not reported include DOC, watertable depth, peat water content and phenol oxidase activity. These variables will however be included in any project extensions. At the time of the initial work, available methods proved unsuitable for the filtering of enough water required for DOC analysis. However, both colour and phenolics were determined and have been previously reported to correlate positively with DOC levels (Worrall et al., 2003; Bonnett et al., 2005). For example, Worrall et al. (2003) provide the following equations that describe the relationship between DOC and colour (absorbance at 400 nm):
DOC = 110 x ABS400 + 0.75 R2 = 0.80
It was intended to measure the activities of phenol oxidase in the peat samples because of the hypothesised connection with the breakdown of phenolic compounds. However, successful determinations of phenol oxidase have not proved possible due to incomplete reactions with the artificial susbtrate L-DOPA in peat solutions because of an unknown interference. Our optimization experiments using grassland soil have shown that the method works well in ordinary soil which suggests that the peat itself may be responsible for the interference and this warrants further investigation.
Overall scientific rationale
previous state although it has been suggested to not necessarily reverse the underlying mechanism of decomposition originally altered by increased drainage or climate change (Wallage et al., 2006; Worrall et al., 2007).
Extracellular enzymes are produced in peat and soil by the microbial community to breakdown large molecular weight organic matter so that they can absorb it across their membranes. These enzymes are excreted into the peat or soil environment and thus function extracellularly and/or independently of the microbial community. Extracellular enzymes are therefore responsible for the initial, limiting steps in organic matter decomposition. In peatlands, the enzyme activities are repressed due to the persistence of recalcitrant phenolic compounds formed from incomplete decomposition of organic matter (Wetzel, 1992; Freeman et al., 2001b). Phenolic compounds persist in deep, anaerobic peat because the enzyme that is responsible for their breakdown (phenol oxidase) requires molecular oxygen as a cofactor (Pind et al., 1994). Under anaerobic conditions, the constrained decomposition of phenolic compounds locks up vast amounts of C due to hydrolase enzyme repression. If, however, the oxygen in the peat mass increases because of drainage or drying out, phenol oxidase activity could increase, reducing the concentration of phenolics and thus increasing the hydrolase enzyme activities that increase the initial breakdown and mineralization of organic matter that supports further aerobic/anaerobic microbial decomposition (Freeman et al., 2001b; Freeman et al., 1996).
The loss of the degradation-inhibiting phenolic compounds means that enzymic decomposition of the peat structure by hydrolase enzymes may continue at depth even after the water table has been restored: ie. the enzymes are switched on by water table drawdown, but are not necessarily switched off as the water table recovers (Wallage et al., 2006). This ‘enzymic-latch’ mechanism could account for increased peat decomposition, and therefore, increased DOC release following periods of drought or water table drawdown (Worrall and Burt, 2005). Indeed, both positive and negative correlations between hydrolase enzymes and DOC have been reported in the literature (Fenner et al., 2005; Freeman et al., 1997; Freeman et al., 1998) due to factors such as end product inhibition, differing soil moisture levels, oxygen status and/or substrate quality (Fenner et al., 2005). DOC contains both substrates and end products of enzyme reactions and thus both cause and effect relationships are viable explanations.
Figure 1 Hypothesized effect of drain-blocking on DOC release and water colouration over time (Worrall et al., 2007; Wallage et al., 2006).
Explanations for this phenomenon include 1) flushing of elevated DOC produced by aerobic microbial decomposition during drainage, 2) the persistence of derepressed hydrolase enzyme activities following drain-blocking, 3) a reduction of sulphate suppression in the soil solution leading to DOC release (Evans et al., 2005; Clark et al., 2005), and 4) the hydrophobic nature of peat delaying re-wetting and the release of DOC for 1 or 2 years (Worral et al., 2007).
Analytical methods
The activities of extracellular enzymes were measured fluorometrically using artificial enzyme substrates which are cleaved to produce fluorescent products which can be measured with a suitable 96-well plate reader.
Phase 1 Optimisation of enzyme assays for peat from Langdon and Goyt moor
Peat samples were collected and analysed in order to determine the concentration of methylumbelliferyl (MUF) substrates that should be added to peat solutions to achieve enzyme ‘active-site’ saturation and the optimal assay incubation length. Follow-up methodological experiments were also performed to determine the effect of filtering and homogenization on the enzyme assays (see below).
The activities of the hydrolytic enzymes β-glucosidase, cellobiohydrolase, and chitinase (or N-acetylglucosaminidase) were determined using MUF artificial substrates (Freeman et al., 1994) (see Table 1). Cellobiohydrolase and β-glucosidase are names for groups of enzymes involved in the decomposition of cellulose, whilst chitinase enzymes are involved in the breakdown of chitin. For each replicate determination, 10 cm3 of peat was placed in a 50 ml centrifuge vial and made up to
the 50 ml mark with deionised water. The vial was shaken by hand for 30 seconds and mixed using a vortex for a further 30 seconds. Using a cut-off pipette tip, 0.75 ml of peat slurry was placed into a 1.7 ml centrifuge vial. To the vial, 0.75 ml of MUF substrate was added and samples were incubated at the field temperature at which the samples were collected (12 ºC) for one hour. Samples were centrifuged for 5 minutes at 12 000 rpm and 300 µl of supernatant transferred to a well in a plate. Flourescence was determined on a BMG Labtech FLUOstar OPTIMA fluorometer at 450 nm emission and 330 nm excitation wavelength. Enzyme activities were determined from the fluorescence units using a standard calibration curve of methylumbelliferone (MUF) with results expressed as rates of MUF production (µmol MUF per g-1 dry
peat weight per min-1). Fluorescence quenching is a potentially interfering process which decreases the intensity of the fluorescence emission and occurs in water containing peat-derived coloured compounds. The standard calibration curve accounted for quenching by dissolving the MUF standard for each peat replicate in 150 µl of supernatant from centrifuged peat slurry.
Table 1 Enzymes and enzyme MUF substrates
Enzyme MUF substrate Reaction
Cellobiohydrolase MUF-β-D-cellobioside Cellulose to cellobiose
Β-glucosidase MUF-β -D-glucopyranoside
Cellobiose to glucose
Chitinase MUF-N-acetyl-β
-D-glucosaminide Chitin to acetylglucosamine
1. Determination of maximal enzyme reaction rate and substrate incubation length
2. Effect of homogenization, filtering and exposure to air on β-glucosidase activity
Enzyme activities determined in the laboratory may be greatly different to the actual enzyme activities in the field and thus measurements in the lab are regarded as potential measurements. It is therefore important that factors that can affect the determinations are optimized in the laboratory. These factors include homogenization, filtration and exposure to air. Replicate peat samples were homogenized by hand for two minutes prior to placing in the 50 ml centrifuge vial; filtered through a 2 mm mesh; and/or prior to homogenization separated into exterior (air-exposed) and interior (non—air-exposed) samples using a knife. The activity of β-glucosidase within each treatment was determined and compared to controls.
3. Comparison of enzyme activities in surface and 1 metre deep peat
Using the optimized enzyme methods, activities of cellobiohydrolase and β -glucosidase were determined for replicate samples from both surface and 1 metre deep peat from two peatland sites (Langdon and Goyt moor)
Sampling Design
Phase 2 A preliminary investigation into the effects of drain-blocking at Langdon moor on enzyme activities and colour.
Following an initial assessment of the site at Langdon, the investigations focused on determining enzyme activities close to a natural, well-drained gully, and a contrasting grip where drainage had been blocked for 12 years before sampling. Of most potential interest to the project was the upslope gradient perpendicular to the drainage channels as this represented a cross section of hydrological conditions influenced by the channels. Close to the channels, the water table should be close to the surface where as further upslope the water table depth may be deeper. It was hypothesised that the level of enzyme activities would be dependent on the nature of the gully: natural (freely-draining) or gripped (drain-blocked). At the natural gully, enzyme activities were hypothesized to increase with proximity to the gully. At the drain-blocked site, it was hypothesised that enzyme activities would be lower. However, both of these gradients of activity should be depth dependent due to the influence of the water table. Additionally, it was hypothesised that enzyme activities should be related to colour and the concentration of phenolics in the soil water.
Figure 2 Phase 2 sampling design showing transects facing east upslope of the natural gully or blocked grip.
Extracellular enzyme activities
Enzyme activities were determined using the optimized method developed in Phase 1, in which peat from the interior of a core was homogenised by hand and filtered through 2 mm mesh. Cellobiohydrolase and β-glucosidase were determined using 200 µM of the relevant MUF substrate. Chitinase activity was determined using 300 µM of MUF substrate. All substrate-peat solutions were incubated at field temperature for one hour.
Potential respiration
Potential CO2 respiration as a measure of microbial activity was determined
by incubating 10 cm3 of peat in a sealed 100 ml plastic pot for one hour. Gas samples were collected in a 30 ml syringe at 0 and 60 minutes. Gas samples were analysed for CO2 and CH4 using a Perkin Elmer Clarus 500 gas chromatograph with FID and
electron capture detector.
Colour and phenolics
Colour was determined by centrifuging 2 ml of the enzyme and peat solution at 10 000 rpm for 10 minutes, filtering through 0.45 µm filter and measuring the absorbance at 400 nm on a spectrophotometer. Phenolics were determined in the same centrifuged and filtered solution using Folin-Ciocalteau reagent (Box, 1983) in the following ratio: 10 sample: 1.5 Na2CO3 : 0.5. Folin-Ciocalteau reagent. 250 μl of
sample were placed in a well plate and 37.5 μl of Na2CO3 solution (200 g l-1) added.
Results
Phase 1 Optimisation of enzyme assays for Langdon and Goyt moor
1. Determination of maximal enzyme reaction rate and substrate incubation length Figure 3 shows the effect of increasing substrate concentration on the activity of cellobiohydrolase. Activity followed Michealis-Menten kinetics and reached saturation at approximately 200 µM of substrate. One of the replicates exhibited substrate inhibition at 100 µM of substrate resulting in a relative standard deviation of 85 % at 100 µM of substrate.
0 1 2 3 4 5 6 7 8 9
0 100 200 300 400 500
MUF-cellobioside (μM)
A
c
tiv
ity
(
μ
mo
l g
-1 dr
y
w
ei
g
ht
m
in
[image:13.595.173.422.231.424.2]-1 )
Figure 3 Effect of substrate concentration on cellobiohydrolase activity (n = 3).
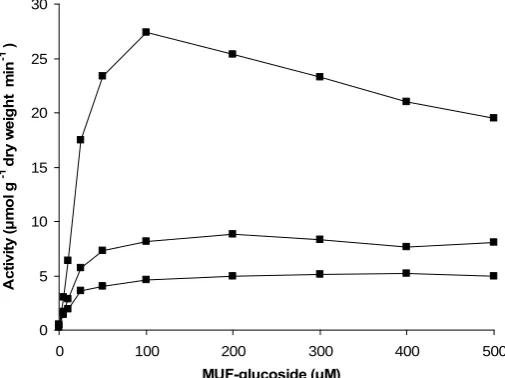
Figure 4 shows the effect of increasing substrate concentration on the activity of β-glucosidase. Activity followed Michealis-Menten kinetics and reached saturation at approximately 200 µM of substrate. One of the replicates exhibited substrate inhibition at 100 µM of substrate resulting in a relative standard deviation of 91 % at 100 µM of substrate.
0 5 10 15 20 25 30
0 100 200 300 400 500
MUF-glucoside (μM)
Ac
ti
v
it
y
(
μ
mo
l g
-1 dr
y w
ei
g
ht
m
in
[image:13.595.172.425.558.747.2]-1 )
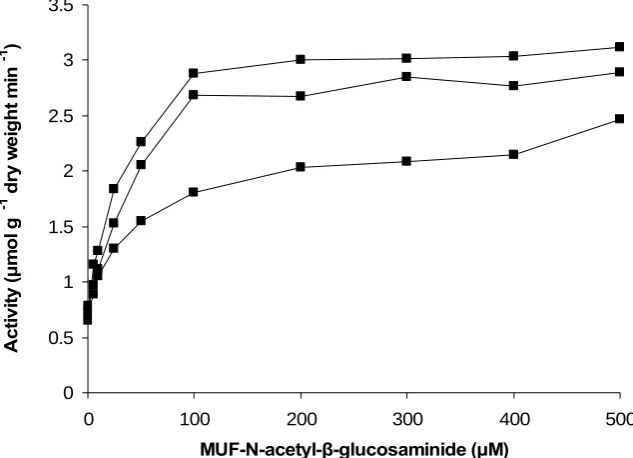
Figure 5 shows the effect of increasing substrate concentration on the activity of chitinase. Activity followed Michealis-Menten kinetics and reached saturation at approximately 300 µM of substrate.
0 0.5 1 1.5 2 2.5 3 3.5
0 100 200 300 400 500
MUF-N-acetyl-β-glucosaminide (μM)
Ac
ti
v
ity
(
μ
m
o
l g
-1 dr
y w
e
igh
t m
in
[image:14.595.140.457.135.364.2]-1 )
[image:14.595.129.468.474.714.2]Figure 5 Effect of substrate concentration on chitinase activity (n = 3).
Figure 6 shows the significant quenching effect of peat on fluorescence.
y = -4.9182x2 + 1072.6x + 1820.3
R2 = 0.9965
y = -1.7879x2 + 516.31x + 262.19
R2 = 1
0 10000 20000 30000 40000 50000 60000 70000
0 20 40 60 80
MUF concentration (μM)
Fl
uor
esence uni
t
100
s
Standard in deionized water
Standard in peat extract
Timecourse incubations performed using optimal substrate concentrations for cellobiohydrolase (fig. 7), β-glucosidase (fig. 8) and chitinase (fig. 9) showed that one hour was the maximum amount of time that reaction rates remained linear.
0 2 4 6 8 10 12 14 16 18 20
0 20 40 60 80 100 120
Incubation length (minutes)
Ac ti v it y ( μ m o l g
-1 dr
y w e ight m in -1)
Figure 7 Effect of incubation length on cellobiohydrolase activity (n = 3).
0 5 10 15 20 25 30 35 40 45 50
0 20 40 60 80 100 120
Incubation length (minutes)
Ac ti v ity ( μ mo l g
-1 dr
y w e ig ht m in -1 )
Figure 8 Effect of substrate concentration on β-glucosidase activity (n = 3).
0 1 2 3 4 5 6
0 20 40 60 80 100 120
Incubation length (minutes)
A c tiv ity ( μ m o l g
-1 dr
y w e ight m in -1 )
2. Effect of homogenisation, filtering and exposure to air on β-glucosidase activity Homogenization of peat samples significantly reduced the activity of β -glucosidase and also reduced the variability (P < 0.001) (fig. 10). Filtering of peat slurries through 2 mm mesh also reduced β-glucosidase activity significantly (P < 0.001).
0 5 10 15 20 25 30 35 40 45 50
Non-homogenized Homogenized
A
c
tiv
ity
(
μ
m
ol
M
U
F g
-1 dr
y
w
e
ig
ht
m
in
-1 ) Non-filtered
Filtered
Figure 10 Effect of homogenization and filtering through 2 mm mesh on β-glucosidase
activity.
Homogenization did not significantly affect β-glucosidase activity in peat samples that had been exposed to air (exterior peat) (fig. 11). Homogenization significantly increased β-glucosidase activity in peat from the interior of cores (P < 0.001). Activity of β-glucosidase was significantly lower in interior peat compared to exterior peat under non-homogenized conditions (P < 0.05). However, after homogenization, β-glucosidase activity was significantly higher in interior peat compared to exterior peat (P < 0.001).
0 5 10 15 20 25 30 35 40
Non-homogenized Homogenized
A
c
tiv
ity
(
μ
m
o
l g
-1 dr
y w
e
ight
m
in
-1 )
Exterior peat Interior peat
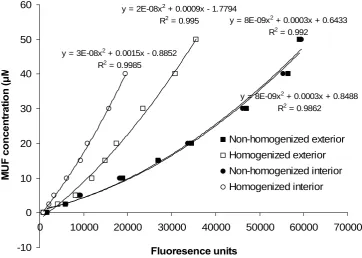
Colour measured at 400 nm was significantly increased by homogenization in both exterior (P < 0.01) and interior peat (P < 0.001) (fig. 12) but there was no significant difference between exterior and interior peat. Quenching was also increased by homogenization (fig. 13).
0.0 0.5 1.0 1.5 2.0 2.5 3.0 3.5 4.0
Non-homogenized Homogenized
A
b
so
rb
an
ce u
n
it
s (
n
[image:17.595.145.452.145.357.2]m Exterior peatInterior peat
Figure 12 Colour at 400 nm from exterior and interior peat
y = 8E-09x2 + 0.0003x + 0.8488 R2 = 0.9862
y = 8E-09x2 + 0.0003x + 0.6433 R2 = 0.992
y = 2E-08x2 + 0.0009x - 1.7794 R2 = 0.995
y = 3E-08x2 + 0.0015x - 0.8852 R2 = 0.9985
-10 0 10 20 30 40 50 60
0 10000 20000 30000 40000 50000 60000 70000
Fluoresence units
M
U
F c
o
n
cent
rat
io
n
(
μ
M
Non-homogenized exterior
Homogenized exterior Non-homogenized interior
Homogenized interior
[image:17.595.117.480.442.700.2]3. Comparison of enzyme activities in peat from surface and 1 metre depth
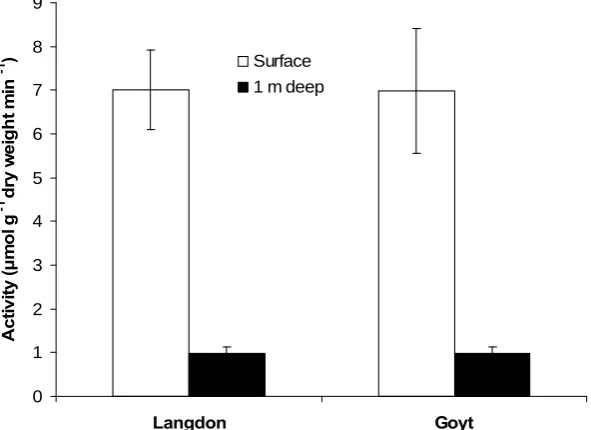
Cellobiohydrolase activity was significantly lower in peat from 1 m depth relative to surface peat at both Langdon and Goyt moors (P < 0.001) (fig. 14). However, there was no significant difference in levels of cellobiohydrolase activity in samples from equivalent depths from either moor.
0 0.5 1 1.5 2 2.5
Langdon Goyt
Ac
ti
v
it
y
(
μ
m
o
l g
-1 d
ry w
e
ig
ht
m
in
[image:18.595.149.453.164.389.2]-1 ) Surface 1 m deep
Figure 14 Cellobiohydrolase activity in surface and 1 m deep peat from Langdon and Goyt
moors.
Β-glucosidase activity was significantly lower in peat from 1 m depth relative to surface peat at both Langdon and Goyt moors (P < 0.001) (fig. 15). There was no significant difference in β-glucosidase activity in equivalent samples from either moor.
0 1 2 3 4 5 6 7 8 9
Langdon Goyt
A
c
tiv
ity
(
μ
m
o
l g
-1 dr
y w
e
ig
h
t m
in
-1 ) Surface
1 m deep
[image:18.595.156.452.522.737.2]Cellobiohydrolase and β-glucosidase activities were significantly correlated within surface and peat from 1 m depth from Langdon moor (P < 0.001; R2 = 94 %) (fig. 16).
y = 4.9979x - 1.2377 R2 = 0.9429
0 1 2 3 4 5 6 7 8 9 10
0 0.5 1 1.5 2 2
Cellobiohydrolase
β
-g
lu
cosi
d
a
s
.5
[image:19.595.148.442.132.353.2]e
Figure 16 Relationship between β-glucosidase and cellobiohydrolase in peat from Langdon
moor.
The quenching effect on 10 µM MUF standard was significantly greater using peat from Goyt moor compared to Langdon moor (P < 0.001) (fig. 17). This was due to significantly greater quenching within peat from 1 m depth at Goyt moor (P < 0.01).
0 5000 10000 15000 20000 25000
Langdon Goyt
F
luo
rescen
ce un
it
s
Surface 1 m deep
[image:19.595.140.457.515.745.2]Phase 2 Preliminary investigation into the short-term effects of drain-blocking on enzyme activities and colour at Langdon moor.
Enzyme activities
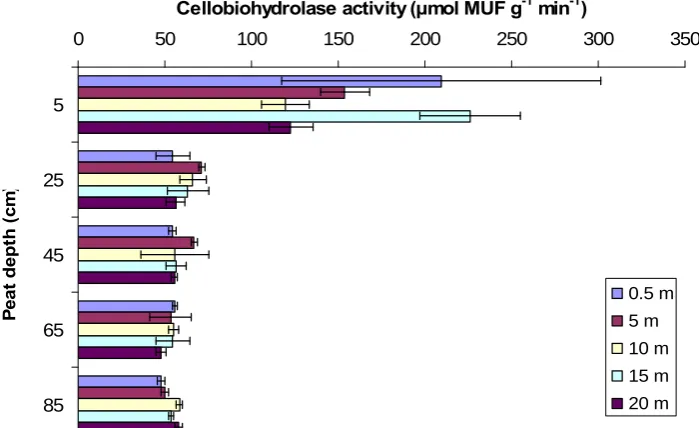
GLM ANOVA analysis of cellobiohydrolase activity showed that overall there was no significant difference between sites. However, there was a significant interaction between site and depth (P < 0.05) (see Appendix for ANOVA results in full). Cellobiohydrolase activity was significantly higher in the top 5 cm relative to all other depths (P < 0.001) in both the natural gully (fig. 18) and the blocked grip (fig. 19). There was no significant difference in activity with distance from the natural gully or blocked grip. However, in the blocked grip at 85 cm depth, cellobiohydrolase activity increased and this response became significantly weaker with distance from the blocked grip (fig. 19).
0 50 100 150 200 250 300 350
5
25
45
65
85
P
e
at
dept
h (
c
m
)
Cellobiohydrolase activity (µmol MUF g-1 min-1)
[image:20.595.122.472.273.487.2]0.5 m 5 m 10 m 15 m 20 m
Fig. 18 Effect of peat depth and distance from a natural gully on cellobiohydrolase activity
0 50 100 150 200 250 300 350
5
25
45
65
85
Pe
at
de
pt
h (
cm
)
Cellobiohydrolase activity (µmol MUFf g-1 min-1)
0.5 m 5 m
10 m 15 m 20 m
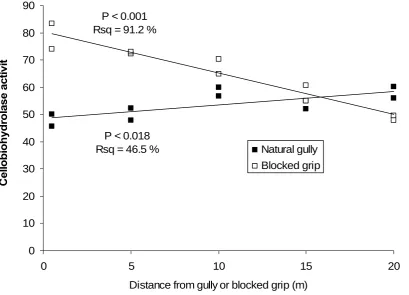
[image:20.595.125.474.530.749.2]Regression analysis (fig. 20) shows that cellobiohydrolase activity at 85 cm depth in the blocked grip was negatively related to distance from the blocked grip (P < 0.001; Rsq = 91 %). Cellobiohydrolase activity at 85 cm depth in the natural gully was positively related to distance from the natural gully, however only 47 % of the variation was explained (P < 0.05; Rsq = 47 %).
P < 0.001 Rsq = 91.2 %
P < 0.018 Rsq = 46.5 %
0 10 20 30 40 50 60 70 80 90
0 5 10 15 20
Distance from gully or blocked grip (m)
Cel
lobi
ohydr
ol
ase a
c
ti
vi
t
[image:21.595.99.509.174.469.2]Natural gully Blocked grip
Fig. 20 Relationships between cellobiohydrolase activity and distance from blocked grip
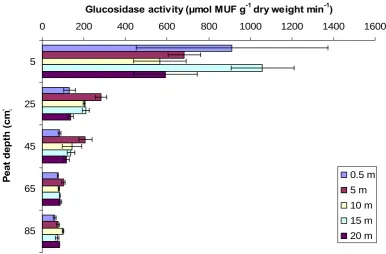
Β-glucosidase activity differed significantly between sites (P < 0.001) and with depth (P < 0.001). However, there was a significant interaction between site and depth (P < 0.001). Activity was significantly higher in the top 5 cm relative to all other depths (P < 0.001) in both the natural gully (fig. 21) and the blocked grip (fig. 22). In the natural gully, activity decreased significantly with depth, whilst in the blocked grip there were no significant differences in activity in peat from between 25 and 85 cm depth. In the natural gully, below 25 cm depth, activity was significantly lower at the gully relative to 5 metres distance from the gully. However, there was no significant difference in activity with distance from the blocked grip.
0 200 400 600 800 1000 1200 1400 1600
5
25
45
65
85
P
e
a
t de
pt
h
(c
m
)
Glucosidase activity (µmol MUF g-1 dry weight min-1)
0.5 m
5 m
10 m
15 m
[image:22.595.104.491.201.455.2]20 m
Fig. 21 Effect of peat depth and distance from a natural gully on β-glucosidase activity
0 200 400 600 800 1000 1200 1400 1600
5
25
45
65
85
P
ea
t dept
h
(
cm
)
Glucosidase activity (µmol MUF g-1 dry weight min-1)
0.5 m
5 m
10 m
15 m
20 m
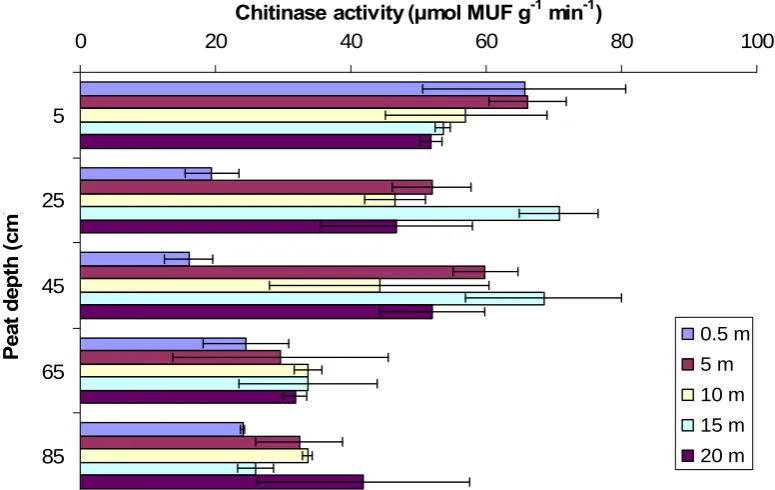
[image:22.595.112.489.498.737.2]ANOVA analysis results showed a significant difference in chitinase activity between sites (P < 0.001), distance from gully or grip (P < 0.01), and peat depth (P < 0.001). However, there were significant interactions between site and peat depth (P < 0.01), and distance and peat depth (P < 0.01). In the natural gully (fig. 23), below 25 cm, activity was significantly lower close to the gully. Activity was significantly higher in the surface peat compared to peat at 65 and 85 cm depth. In the blocked grip (fig. 24), activity did not vary with distance from the grip. However, activity was significantly greater at the surface compared to 25 and 45 cm depth.
0 20 40 60 80
5
25
45
65
85
Pe
at
de
pt
h (
cm
100
)
Chitinase activity (µmol MUF g-1 min-1)
0.5 m
5 m
10 m
15 m
[image:23.595.105.493.205.450.2]20 m
Fig. 23 Effect of peat depth and distance from a natural gully on chitinase activity
0 20 40 60 80 100
5
25
45
65
85
P
ea
t de
pt
h
(c
m
)
Chitinase activity (µmol MUF g-1 min-1)
0.5 m
5 m
10 m
15 m
20 m
[image:23.595.103.491.494.743.2]Potential CO2 respiration
Potential CO2 respiration in surface peat was significantly higher at the natural gully
compared to the blocked grip (P < 0.05), and was significantly different between peat depths (P < 0.001). At the natural gully (fig. 25), respiration was significantly higher at the surface relative to 25 and 45 cm depth. In the blocked grip (fig. 26), there was a significant difference in respiration between 25 and 45 cm depth. CO2 respiration did
not vary significantly with distance from the natural gully or the blocked grip.
0 20 40 60 80
5
25
45
65
85
P
ea
t de
pt
h (
cm
100
)
Potential CO 2 respiration (µg CO2 g-1 dry weight h -1)
[image:24.595.111.483.188.440.2]0.5 m 5 m 10 m 15 m 20 m
Fig. 25 Effect of peat depth and distance from a natural gully on potential CO2 respiration.
0 20 40 60 80
5
25
45
65
85
P
e
a
t de
p
th
(c
m
100
)
Potential CO 2 respiration (µg CO2 g-1 dry weight h-1)
0.5 m 5 m 10 m 15 m 20 m
[image:24.595.111.490.485.741.2]Colour and phenolics
Colour was significantly different between sites (P < 0.001), distance from gully (P < 0.01) and peat depth (P < 0.001). However, there was a significant interaction between site and depth (P < 0.001). At the natural gully (fig. 27), colour was significantly higher at the gully compared to 20 m upslope. Also, colour was significantly different between 5 and 85 cm depth suggesting colour was higher at depth. At the blocked grip (fig. 28), colour increased significantly with depth. This is particularly evident in close proximity to the grip. Clearly, the significant difference between sites was due to greater colour at 85 cm depth at close proximity to the grip.
0 0.5 1 1.5 2 2.5 3 3.5
5
25
45
65
85
Pe
at
d
ept
h
(c
m
)
Colour (Abs 400 nm)
[image:25.595.120.479.219.453.2]0.5 m 5 m 10 m 15 m 20 m
Fig. 27 Effect of peat depth and distance from a natural gully on colour
0 0.5 1 1.5 2 2.5 3 3.5
5
25
45
65
85
P
ea
t de
pt
h (
cm
)
Colour (Abs 400 nm)
0.5 m
5 m
10 m
15 m
20 m
[image:25.595.112.482.493.740.2]The concentrations of phenolics were significantly different between depths (P < 0.001). However, there was a significant interaction between site and depth (P < 0.01). At the natural gully (fig. 29), phenolics were significantly lower in the surface layers (5-25 cm) relative to the deeper layers (45-85 cm). At the blocked grip (fig. 30), phenolics also increased significantly with depth. This is particularly evident in close proximity to the grip. Whilst not significant, phenolics appear greater at 85 cm depth in the blocked grip than in the natural gully which explains the significant interaction between site and depth.
0 10 20 30 40 50 60 70 8
5
25
45
65
85
P
e
a
t de
pth (
c
m
0
)
Phenolics (mg l)
0.5 m
5 m
10 m 15 m
[image:26.595.93.499.193.447.2]20 m
Fig. 29 Effect of peat depth and distance from a natural gully on phenolics.
0 10 20 30 40 50 60 70 8
5
25
45
65
85
P
ea
t de
p
th (
cm
0
)
Phenolics (mg l)
0.5 m
5 m
10 m 15 m
20 m
[image:26.595.99.499.476.731.2]Relationships between variables
It might be expected that the activity of the enzymes involved in the breakdown of peat may be substantively related to each other because of substrate/product interactions. There was a significant positive linear relationship between cellobiohydrolase and glucosidase activities in both the natural gully (fig. 31 a) and the blocked grip (fig. 31 d) with 90 % of the variation explained in both. The regression slopes were not significantly different between the natural gully and blocked grip.
Chitinase activity was significantly related to cellobiohydrolase activity in both the natural gully (fig. 31 b) and the blocked grip (fig. 31 e). However, unlike the relationship between cellobiohydrolase and β-glucosidase acivities, only 50 % of the variation was explained. The regression slopes were not significantly different between the natural gully and blocked grip. However, the intercept was significantly different (P <0.0001; F = 11.028).
Chitinase activities were similarly related to β-glucosidase activity in both the natural gully (fig. 31 c) and the blocked grip (fig. 31 f) and again only 50 % of the variation was explained. The regression slopes for β-glucosidase against chitinase activity were not significantly different between the natural gully and blocked grip. However, the intercept was significantly different (P <0.0007; F = 11.96).
400 300 200 100 0 2000 1500 1000 500 0
Cellobiohydrolase activity (umol MUF g min)
Gl ucos idas e ac tiv ity (um ol M U F g m in ) 5 25 45 65 85 Depth d % Rsq = 91.6 F = 792.9 P < 0.001
400 300 200 100 0 2000 1500 1000 500 0
Cellobiohydrolase activity (umol MUF g min)
Glu cos ida se act iv it y (u m o l M U F g m in ) 5 25 45 65 85 Depth a
Rsq = 93.8 % F = 1105.1 P < 0.001
400 300 200 100 0 250 200 150 100 50 0
Cellobiohydrolase activity (umol MUF g min)
Chitin ase activ ity (um ol
MUF g m
in) 5 25 45 65 85 Depth b
Rsq = 46.4 % F = 64.13 P < 0.001
400 300 200 100 0 250 200 150 100 50 0
Cellobiohydrolase activity (umol MUF g min)
Ch iti n a se ac tiv ity (u m o l MU F g m in) 5 25 45 65 85 Depth e
Rsq = 46.9 % F = 65.57 P < 0.001
2000 1500 1000 500 0 250 200 150 100 50 0
Glucosidase activity (umol MUF g min)
C hit inas e a cti v ity (u m o l MU F g m in) 5 25 45 65 85 Depth c
Rsq = 51.5 % F = 78.44 P < 0.001
2000 1500 1000 500 0 250 200 150 100 50 0
Glucosidase activity (umol MUF g min)
Chiti n ase acti v ity (um o l MU F g m in) 5 25 45 65 85 Depth f
[image:28.595.90.515.68.544.2]Rsq = 43.5 % F = 57.1 P < 0.001
Fig. 31 A comparison of enzyme activities in the natural gully (a to c) and the blocked grip (d
Activities for the studied enzymes were positively correlated with potential CO2
respiration in the natural gully (fig. 32 a-c). Approximately 50 % of the variation in cellobiohydrolase and β-glucosidase activities were explained by potential CO2
respiration as might be expected from the close correlation in activity levels between these enzymes. Approximately 30 % of the variation in chitinase activity was explained by potential CO2 respiration.
Overall levels of potential CO2 respiration were slightly lower in cores from
the blocked grip relative to the natural gully but none of the enzyme activities in the blocked grip were significantly related to potential CO2 respiration (fig. 32 d-f).
100 80 60 40 20 0 400 300 200 100 0
Potential CO2 respiration (ug CO2 g h)
Cel lo bi oh yd ro la se a ct ivi ty ( u m o l M U F g m in ) 5 25 45 65 85 Depth a
Rsq = 60.8 % F = 97.07 P < 0.001
100 80 60 40 20 0 2000 1500 1000 500 0
Potential CO2 respiration (ug CO2 g h)
Glu cos ida se act iv it y (u m o l M U F g m in ) 5 25 45 65 85 Depth b
Rsq = 51.2 % F = 66.07 P < 0.001
100 80 60 40 20 0 250 200 150 100 50 0
Potential CO2 respiration (ug CO2 g h)
C hit inas e a cti v ity (u m o l MU F g m in) 5 25 45 65 85 Depth c
Rsq = 27.2 % F = 24.14 P < 0.001
100 80 60 40 20 0 400 300 200 100 0
Potential CO2 respiration (ug CO2 g h)
C el lobi oh ydr o lase act iv it y ( u m o l M U F g m in ) 5 25 45 65 85 Depth d 100 80 60 40 20 0 2000 1500 1000 500 0
Potential CO2 respiration (ug CO2 g h)
Gl ucos idas e act iv ity (um o l M U F g m in ) 5 25 45 65 85 Depth e 100 80 60 40 20 0 250 200 150 100 50 0
Potential CO2 respiration (ug CO2 g h)
[image:29.595.93.512.220.668.2]C h itin ase a ctiv it y (um o l M U F g m in) 5 25 45 65 85 Depth f
Fig. 32 Relationships between potential CO2 respiration and enzyme activities in the natural
The range of colour levels was much wider in the blocked grip samples than those from the natural gully. There were no significant cause and effect relationships between colour and enzyme activities except for a weak yet significant negative relationship between chitinase activity and colour in the natural gully (fig. 33 c). In the natural gully there was a clear difference in cellobiohydrolase and β-glucosidase activities between the surface (0-5cm) and all of the deeper peat layers which results in a clustering of the deeper values on the graphs (fig. 33a-c). However, in the blocked grip there was also a clear differential grouping of colour values amongst the upper (5 – 45 cm) and lower (65 – 85 cm) peat layers (fig. 33d-f). These results suggest the involvement of one or more other indirect factors affecting both colour and enzyme activities at different depths within the peat.
3.0 2.5 2.0 1.5 1.0 0.5 0.0 400 300 200 100 0
Colour (Abs 400 nm)
C ello b io h yd ro la se a ct iv it y (u m o l M U F g m in ) 5 25 45 65 85 Depth a 3.0 2.5 2.0 1.5 1.0 0.5 0.0 2000 1500 1000 500 0
Colour (Abs 400 nm)
Glucosid ase activ ity (um ol
MUF g m
in) 5 25 45 65 85 Depth b 3.0 2.5 2.0 1.5 1.0 0.5 0.0 140 120 100 80 60 40 20 0
Colour (Abs 400 nm)
C hit ina se a cti v ity (u m o l M UF g m in) 5 25 45 65 85 Depth c
Rsq = 22.3 % F = 21.94 P < 0.001
Outlier at x = 0.25 ; y = 240
3.0 2.5 2.0 1.5 1.0 0.5 0.0 400 300 200 100 0
Colour (Abs 400 nm)
C el lobi oh ydr o lase act iv it y ( u m o l M U F g m in ) 5 25 45 65 85 Depth d 3.0 2.5 2.0 1.5 1.0 0.5 0.0 2000 1500 1000 500 0
Colour (Abs 400 nm)
Glu cosi dase acti v ity (um ol MU F g m in) 5 25 45 65 85 Depth e 3.0 2.5 2.0 1.5 1.0 0.5 0.0 140 120 100 80 60 40 20 0
Colour (Abs 400 nm)
[image:30.595.94.511.248.695.2]C h itin ase a ctiv ity (um o l M U F g m in ) 5 25 45 65 85 Depth f
Fig. 33 Relationships between colour and enzyme activities in the natural gully (a to c) and in
Phenolic compounds are formed during the breakdown of peat so that their concentrations are often closely related to the colour of drainage water, so much so that they are often used as a surrogate measure. Within this study, colour (400nm) and phenolics were correlated significantly within both the natural gully (fig. 35 a) and the blocked grip (fig. 35 b). However, the regression slopes were significantly different (P < 0.0001; F = 17.15) with a steeper gradient within the blocked grip. Whilst colour and phenolics increase with depth in both the natural gully and blocked grip, in the blocked grip the amount of colour per unit of phenolics also increases. This implies that colour at 400nm is not an adequate surrogate measure for comparing the occurrence of phenolic compounds across this study area.
80 70 60 50 40 30 20 10 0 3.0
2.5
2.0
1.5
1.0
0.5
0.0
Phenolics (mg l)
Co
lou
r (A
bs
400
nm
) 255
45 65 85 Depth
a
Rsq = 49.2 % F = 71.8 P < 0.001
80 70 60 50 40 30 20 10 0 3.0
2.5
2.0
1.5
1.0
0.5
0.0
Phenolics (mg l)
Co
lo
ur
(
A
bs
4
00
n
m
)
5 25 45 65 85 Depth
b
[image:31.595.94.511.238.373.2]% Rsq = 71.3 F = 182.14 P < 0.001
Fig. 35 Relationship between colour and phenolics in the natural gully (a) and blocked grip
(b)
Despite the distribution of phenolics noted above, the plots of phenolics and enzyme activities were very similar to those for colour and enzyme activities. To understand any implications deriving from the changing relationship between colour and phenolics with depth will require larger datasets from future work.
80 70 60 50 40 30 20 10 0 400 300 200 100 0
Phenolics (mg l)
Cel lo bi oh ydr o la se a ct iv it y (u m o l M U F g m in) 5 25 45 65 85 Depth a 80 70 60 50 40 30 20 10 0 2000 1500 1000 500 0
Phenolics (mg l)
Glucosid ase activ ity (um ol
MUF g m
in) 5 25 45 65 85 Depth b 80 70 60 50 40 30 20 10 0 140 120 100 80 60 40 20 0
Phenolics (mg l)
C hit ina se a cti v ity (u m o l M UF g m in) 5 25 45 65 85 Depth c
Rsq = 27.7 % F = 28.9 P < 0.001 Outlier at x = 8 ; y = 240
80 70 60 50 40 30 20 10 0 400 300 200 100 0
Phenolics (mg l)
C el lo b iohy dr olase a ct ivi ty ( u m o l M U F g m in) 5 25 45 65 85 Depth d 80 70 60 50 40 30 20 10 0 2000 1500 1000 500 0
Phenolics (mg l)
Glu cosid ase a ctiv ity (um ol M U F g m in ) 5 25 45 65 85 Depth e 80 70 60 50 40 30 20 10 0 140 120 100 80 60 40 20 0
Phenolics (mg l)
[image:32.595.92.515.68.510.2]Chiti nase act iv ity (um ol MU F g m in) 5 25 45 65 85 Depth f
Fig. 34 Relationships between phenolics and enzyme activities in the natural gully (a to c) and
Discussion
Phase 1 Optimisation of enzyme assays for Langdon and Goyt moor
1. Determination of maximal enzyme reaction rate and substrate incubation length Despite a wide degree of variability in the determinations, cellobiohydrolase and β-glucosidase activities were saturated at ca. 200 µM of their respective MUF substrates. The similarity of the values is not surprising considering these enzymes are both cellulases and catalyse in sequence the breakdown of cellulose to glucose monomers in peat. This finding was also supported by a positive correlation between cellobiohydrolase and β-glucosidase. One of the replicates appears to have been affected by substrate inhibition. Chitinase activity, however, saturated at approximately 300 µM of MUF substrate but did not exhibit the same amount of variability as cellobiohydrolase and β-glucosidase. These saturating MUF substrate concentrations were used in all subsequent assays.
Quenching is a process that can interfere with the determination of enzyme activities in fluorescence assays. When a molecule absorbs light in the visible or ultraviolet range of the spectrum, it will be excited from the electronic ground state to an excited state. From there it can return to the ground state by releasing the absorbed energy as heat and/or radiation in the visible range. The emission (fluorescence or phosphorescence) is what is measured to determine enzyme activities but can be quenched through the transfer of the excitation energy to another molecule. A variety of processes can result in quenching, such as excited state reactions, energy transfer, complex formation and collisional quenching. Molecular oxygen is a common chemical quencher. Quenching was evident in the experiments when comparing fluorescence of MUF standards dissolved in deionized water with MUF standards dissolved in peat extract. Thus for accurate determinations of enzyme activity using these methods, MUF standards were prepared in peat extract to account for quenching.
The rates of reaction of enzyme and artificial substrate were linear for at least one hour after which variability of outcome increased. These results show that one hour or less of incubation time is the most suitable incubation length for all enzymes studied.
2. Effect of homogenisation, filtering and exposure to air on β-glucosidase activity The amount of variability in the determinations of cellobiohydrolase and β -glucosidase activity in initial experiments prompted a study into its causes. During storage of peat cores in the laboratory, there is an opportunity for ingress of oxygen and loss of moisture from the peat. To study this effect, comparative measurements were taken for peat subsampled and processed using different methods. Homogenization and filtering of the peat extracts both reduced the apparent activity of
drawn at this stage, these results provide an interesting line of enquiry for future research to improve current molecular methods assessing decomposition in peat.
3. Comparison of enzyme activities in surface and 1 metre deep peat
Both cellobiohydrolase and β-glucosidase activities were significantly lower in peat at 1m depth compared to surface peat at both Langdon and Goyt moors. This is not surprising as microbial activity is higher within the top 20 cm of peat where labile carbon and oxygen are more plentiful. What is surprising is that there were no significant differences in cellobiohydrolase and β-glucosidase activities in the surface peat from the two moors: Langdon in the northern Pennines and Goyt moor in the Peak District. However, Goyt moor peat at 1 m depth had a significantly greater quenching effect than surface peat whilst equivalent peat from Langdon did not. These quenching effects were taken into account by producing matched MUF standard solutions for each replicate. It should be noted that this type of quenching does not affect the enzyme activities directly but rather causes an underestimation of enzyme activities. Thus the degree of quenching may not necessarily be related to factors regulating decomposition in peat.
Phase 2 Preliminary investigation into the short-term effects of drain-blocking at Langdon moor on enzyme activities and colour.
1. Enzyme activities
Cellulose is the most abundant organic compound in the biosphere and is a significant fraction of organic matter in peat. The enzymic hydrolysis of cellulose is a complex process involving a suite of enzymes. Cellulases are a group of enzymes that catalyse the degradation of cellulose, polysaccharides made up of 1,4 linked glucose units. Endo-1,4-β-glucanase attacks the cellulose chains at random, exo-1,4-β -glucanase removes glucose or cellobiose from the non-reducing end of the cellulose chains, and β-D-glucosidase hydrolyses cellobiose and other water soluble cellodextrins to glucose (Makoi and Ndakidemi, 2008).
Cellobiohydrolase is an exo-1,4-β-glucanase and thus removes cellobiose from the non-reducing end of the cellulose chains. This enzyme is very important as it may be the limiting step in cellulose decomposition by providing substrate for enzymes such as β-glucosidase. Studies have shown that activities of cellulases in agricultural soils are affected by several factors. These include temperature, soil pH, water and oxygen contents, the chemical structure of organic matter and its location in the soil profile horizon (Rubridge, 1977; Deng and Tabatabai, 1994; Alf and Nannipieri, 1995), and quality of organic matter/plant debris and soil elements (Burns, 1978; Deng and Tabatabai, 1994). Several mechanisms have been proposed in the degradation of cellulose by cellulases (Rees, 1975; White, 1982; Wood, 1991). For instance, chitin in the presence of cellulose induces the synthesis of chitinase (another enzyme studied here) and other cell wall lytic enzymes which promote the release of the intramural β-glucosidase into the medium. Thus cellulases are hypothesized to play a central, or rather major role in decomposition.
chemical compound is broken down by reaction with water) of various β-glucosides present in plant debris decomposing in the ecosystem. Its final product is glucose which is an important C energy source to microbes in the soil (Esen, 1993). It is characteristically useful as a soil quality indicator, and may give a reflection of past biological activity, the capacity of soil to stabilise the soil organic matter, and can be used to detect management effect on soils (Bandick and Dick, 1999; Ndiaye et al., 2000). Generally, β-glucosidase activities can provide advanced evidence of changes in organic carbon long before it can be accurately measured by other routine methods (Dick et al., 1996; Wick et al., 1998). It is very sensitive to changes in pH, soil management practices (Dick et al., 1996; Bandick and Dick, 1999), and can be inhibited by heavy metal contamination such as Cu and several others (Deng and Tabatabai, 1995).
Chitin is a polymer of amino sugars, is an important source of nitrogen and is a major component of soil animal exoskeletons and fungal cell walls (Killham, 2001). Chitinase enzymes are responsible for the degradation and hydrolysis of chitin. Chitin, an insoluble linear β-1,4- linked polymer of N-acetylglucosamine, is one of the most abundant polysaccharides in nature. Miller et al. (1998) showed widespread ability to produce chitinase among a taxonomically diverse selection of fungi on media with and without added chitin. Chitinase activity was expressed only in a limited number of bacteria and was correlated with estimates of fungal biomass. The role of chitinase in fungal physiology is complex and has been linked to morphogenetics (Gooday et al. 1992), N acquisition (Goody, 1990), and mycoparasitism (Flach et al. (1992).
All enzymes showed significantly greater activity within the top 5 cm of peat compared to peat at depth. However, the activities of specific enzymes differed with respect to site, distance from gully or grip, and depth of peat.
Cellobiohydrolase and β-glucosidase enzymes are both involved in distinct stages in the decomposition of cellulose in peat. The activities of both cellobiohydrolase and β-glucosidase were significantly higher within the surface layer of peat at both sites. This is because microbial activity is greater in the peat surface layer and microbes produce and release enzymes into the surrounding medium. However, enzyme activities were not significantly different between sites in the surface layer showing that factors may not impact directly on enzymes and microbial activities alike (see potential CO2 respiration below). Microbial activity can be related
to enzyme activities via enzyme production and thus both are regulated by factors affecting microbial activities directly (i.e. anaerobiosis). However, enzymes are not necessarily directly affected by water content or oxygen concentrations and therefore may retain activities at depth when microbial activities are inhibited. For example, cellobiohydrolase activity at 85 cm depth was significantly greater within the grip blocked peat particularly in close proximity to the grip. This suggests that a declining gradient of cellobiohydrolase activity may exist with distance from the blocked grip at 85 cm depth, whilst an increasing gradient may exist in the natural gully studied. These gradients are hypothesized to be related to the water table depth at each site and also the hydrological history i.e. the boundary between the acrotelm and catotelm layers. This is an important area for future work, in particular why cellobiohydrolase activity appears to be the most affected.
Chitinase activity was significantly higher in the surface peat in both the natural gully and blocked grip although the differences were not as distinct as with the other enzymes. As with β-glucosidase and cellobiohydrolase, activity was lowest close to the natural gully, but did not significantly vary with distance from the blocked grip.
The three enzyme activities appear to decrease between 25 and 85 cm in the natural gully, but increase again or remain constant with depth in the blocked grip. The significant interactions found between site and peat depth for all three enzymes supports this finding.
2. Potential CO2 respiration
Potential CO2 respiration is a measure of the microbial activity in peat
including bacteria and fungi. CO2 respiration was higher in the surface peat layer at
the natural gully site compared to the blocked grip. CO2 respiration was also higher in
the surface peat compared to the deeper layer at the natural gully but this was not the case in the blocked grip. This suggests that conditions may have been more anaerobic such as to reduce respiration at the blocked grip site and constrasts with the insignificant affect of the blocked grip on enzyme activities noted above.
3. Colour and phenolics
The levels of colour and phenolics both increased with depth in the peat at both study sites. Explanations for this include reduced microbial activities with depth resulting in the potential accumulation of colour and phenolics compounds. Of more interest, however, was the significantly greater amount of colour and phenolics at 85 cm depth in the blocked grip, particularly in close proximity to the grip. There is at this stage no clear explanation for this phenomenon although the results below suggest that enzyme activities may not be directly responsible.
4. Relationships between variables
It was not surprising to discover close relationships between cellobiohydrolase and β-glucosidase activities. Cellobiohydrolase and β-glucosidase are both involved in the decomposition of cellulose and may therefore interact with one other (Makoi and Ndakidemi, 2008). The relationship between these two cellulose degrading enzymes and chitinase however is less clear and more likely due to indirect factors. One important factor affecting enzyme activities was the peat depth in which enzyme activities beneath 25 cm were significantly suppressed relative to the surface layer. Indeed, these preliminary results suggest that the relationship between enzyme activities may differ at depth due to variation in biotic/abiotic factors. In particular, β -glucosidase activity was significantly reduced beneath the peat surface layer although the factors responsible are not clear.
In the natural gully, particularly in the surface layer, all enzyme activities were related significantly with potential CO2 respiration that is a measure of the microbial
activity in peat including bacteria and fungi. Approximately 50 % of the variation of cellobiohydrolase and β-glucosidase activities was explained by potential CO2
respiration. Thus both the microbial production of recent enzymes as well as existing enzymes affects total enzyme activities in the peat. Only 27 % of chitinase activity was explained by potential CO2 respiration. Chitinase activity is usually closely
associated with fungal biomass and thus potential CO2 respiration may be a better
probably due to reduced microbial activity in the peat surface layer as mentioned earlier. It appears that microbial activity may have been constrained in the blocked grip whilst enzyme activities were maintained. This may be explained by a higher water table depth that would reduce aerobic respiration but permit extracellular hydrolysis.
There was no clear relationship between either colour or phenolics with any of the enzyme activities determined. In both the natural gully and blocked grip, enzymes activities were significantly higher in the peat surface layer but this had no effect on the amount of colour or phenolics measured. However, in the blocked grip both colour and phenolics were significantly higher at 65 and 85 cm depth but this was not due to enzyme activities. The results suggest the involvement of one or more other indirect factors affecting colour, phenolics and enzyme activities at different depths within the peat. Future work will aim at determining what factors affect these variables at depth such as carefully controlled laboratory experiments.
The results have clearly shown a highly significant association between colour determined spectrophotometrically at 400 nm and phenolics. Indeed, colour and phenolics were positively correlated in both the natural gully and the blocked grip with all depths contributing to these relationships. Thus this phenomenon is not restricted to any one depth. It is likely that phenolics formed as end products of decomposition form a large component of the compounds that affect the amount of absorbance occurring at 400 nm (i.e. phenolics affect colour). The observation that the slope of the regression was steeper within the blocked grip warrants further investigation as this suggests that phenolics cannot be responsible for the amount of colour.
Conclusions
This study has investigated a small number of enzymes involved in the production and breakdown of peat. The methods were found to be satisfactory for determining activity levels of cellobiohydrolase, β--glucosidase and chitinase. Unfortunately, there was unexpected interference with the determinations of phenol oxidase, a very important enzyme in breaking down the phenolic compounds which strongly influence various processes in peat. As a consequence, thus far, it has not been possible to make any valid measurements of phenol oxidase activity in peat.
For the enzymes for which we had working methods, there were clear differences between enzyme activities in surface peat when compared with peat from greater depth at both study sites. There were no significant differences in magnitude of enzyme activity levels in surface peat from either area. However, there were significant differences between the areas for a number of parameters including enzyme activities in peat collected from depths between 5 and 85cms. These results suggest that increased retention of water within Langdon moor, as a result of grip blocking has caused a significant impact on the amount of colour and phenolic compounds with increasing depth relative to the amounts in a naturally drained area. Furthermore, the relationship between water colour and the concentration of phenolic compounds has been altered in the area of the blocked grip. This indicates some difference, yet to be elucidated, in the processes producing the colour deriving from the two drainage states.