Towards a conceptual framework for Value Stream Mapping
(VSM) implementation: An investigation of managerial factors
Eleftherios Andreadis
Warwick Manufacturing Group, The University of Warwick International Manufacturing Centre, University of Warwick
Coventry, UK, CV4 7AL E-mail: [email protected]
Jose Arturo Garza-Reyes*
Centre for Supply Chain Improvement The University of Derby
Kedleston Road Campus, Derby, UK, DE22 1GB E-mail: [email protected]
Tel. +44(0)1332593281
Vikas Kumar
Bristol Business School University of the West of England Coldharbour Ln, Bristol, UK, BS16 1QY
E-mail: [email protected] Tel. +44(0)1173283466
Towards a conceptual framework for Value Stream Mapping
(VSM) implementation: An investigation of managerial factors
Abstract
Despite the relatively extensive literature on VSM, limited reflection has been reported regarding how managerial proceedings actually put VSM into practice. This research therefore investigates these issues as part of the overall lean philosophy and in correlation with some of its main tools. Five hypotheses and three complementary research questions were formulated and tested using a combination of descriptive statistics and Pearson correlation, 2-Sample proportion, One-way ANOVA, 1-Sample t-tests and Tukey-Pairwise comparison tests. Data were collected through a survey questionnaire responded by 168 manufacturing organisations worldwide. The results establish, among other ‘soft’ aspects; (1) whether organisations that have adopted lean have also employed VSM as an essential tool to identify waste, (2) the position that VSM normally takes in the timeframe hierarchy of lean implementation, (3) the complexity of VSM implementation in terms of easiness and time taken for training when compared to other lean tools such as TPM, JIT and Jidoka, and the (4) critical success factors and barriers for the VSM implementation. A conceptual framework to support the implementation and management of VSM is developed through the unification of the results obtained. This study supports the very limited empirical research on the implementation and management of VSM.
Keywords: Lean manufacturing, lean implementation, value stream mapping, VSM, empirical study.
1. Introduction
During the last years, the use of VSM has radically increased not only within the plants and supply chains of manufacturing organisations (Forno et al., 2014; Abdulmalek and Rajgopal, 2007) but also in the service sector and process industries (e.g. Shou et al., 2017; Stadnicka and Ratnayake, 2016; King et al., 2015). However, despite this increase in the use of VSM, much of its scholar research has mainly centred on discussing and investigating the specific VSM aspects categorised in Table 1.
Table 1. Summary and categorisation of VSM scholarly research
VSM Aspect Literature (Examples)
General overview, definition and review of VSM, its principles and toolkit
Shou et al. (2017); Rocha-Lona et al. (2013); Myerson (2012); Chowdary and George (2011); Nash and Poling (2011); Serrano Lasa et al. (2008); Abdulmalek and Rajgopal (2007); Womack (2006); Womack and Jones (2003); Rother and Shook (1998); etc.
VSM benefits
Shou et al. (2017); Singh et al. (2011); Pepper and Spedding (2010); Serrano Lasa et al. (2009); Serrano Lasa et al. (2008); Abdulmalek and Rajgopal (2007); Rother and Shook (1998); etc.
VSM limitations, challenges and/or mitigation measures
Forno et al. (2014); Dinis-Carvalho et al. (2014); Belekoukias et al. (2014); Seyedhosseini et al. (2013); Nash and Poling (2011); Pepper and Spedding (2010); Braglia et al. (2009); Serrano Lasa et al. (2008); etc.
Application of VSM (Cases study)
Shou et al. (2017); Barberato Henrique et al. (2016); Tyagi et al. (2015); Parthanadee and Buddhakulsomsiri (2014); Saboo et al. (2014); Jasti and Sharma (2014); Venkataraman et al. (2014); Bo and Dong (2012); Teichgräber and de Bucourt (2012); Chen et al. (2010); Singh and Sharma (2009); Seth et al. (2008); Grewal, (2008); Barber and Tietje (2008); etc.
VSM implementation plan
Shou et al. (2017); Barberato Henrique et al. (2016); Venkataraman et al. (2014); Bo and Dong (2012); Nash and Poling (2011); Serrano Lasa et al. (2008);Rivera and Chen (2007);Rother and Shook (1998); etc.
Despite the foregoing relatively extensive literature on VSM, some of which is summarised in Table 1, limited reflection regarding how managerial proceedings actually put VSM into practice has been reported. In this context, only few papers have addressed this phenomenon in the academic literature (Venkataraman et al., 2014; Nash and Poling, 2011; Serrano Lasa et al., 2008). The implementation plan of VSM and its managerial and practical aspects, as part of the overall lean philosophy, constitute the main pillar of the lean methodology. This is because here lies the responsibility of lean implementers in achieving the efficient coordination of people and proper utilisation of tools, to successfully bring into life the desired value-adding flows (Liker and Meier, 2006).
case of Rivera and Chen (2007) where the authors have intended to consider VSM as one of the components of a structured lean implementation framework. However, Rivera and Chen (2007) focused on the impact of implementing lean and VSM on the cost-time profile and cost-time investment of a manufacturing system, but they did not consider the managerial issues surrounding its implementation. This evidence implies that no exact correlation with the lean concept, or other lean tools, has been provided throughout the entire literature in terms of ‘Whether’, ‘When’, ‘How’ and ‘Why’ VSM should be applied. Therefore, and to support the very narrow empirical body of knowledge on the ‘soft’ aspect of VSM, this study investigates the practical and managerial issues surrounding the implementation and management of VSM, as a part of the overall lean philosophy and in correlation with the main lean tools applied by manufacturing organisations. Considering this, the main research questions addressed through this research are:
How likely is for VSM to be employed as part of the overall lean philosophy? Is VSM necessarily the first tool that is applied during a lean implementation? How much training does VSM need in comparison with other lean tools? What are the most critical factors of a VSM’s successful implementation?
What are the results of VSM when applied on its own and what improvements can it offer when coupled with other lean tools?
The next sections address the following topics: Section 2 presents the literature review and formulation of hypotheses and complementary research questions to be investigated; the research methodology and data collection method are included in Section 3; Section 4 presents the analyses and discusses the results, whereas Section 5 introduces a conceptual framework to support the implementation and management of VSM; finally, Section 6 provides the conclusions, limitation and future research directions derived from this research.
2. Literature Review – formulation of hypotheses and complementary research questions
2.1 Initial steps towards VSM adoption
Rother and Shook (1998), Nash and Poling (2011), Grewal (2008) and Seyedhosseini et al. (2013) argue that VSM is an inseparable part of lean transformations due to its contribution in visualising and comprehending the problematic areas of an organisation’s production value flows. Similarly, Myerson (2012) considers VSM as the ultimate tool to identify wastes, making it an essential element of the lean philosophy. Likewise, Barberato Henrique et al. (2016) consider VSM as an essential tool for continuous improvement, and hence to effectively adopt lean. VSM’s principal competence, which is to enable the visualisation of material and information flows of entire value streams, is what differentiates it from other mapping tools and makes it an essential component of the lean implementation process (Jeyaraj et al., 2013). This evidence suggests the VSM’s indisputable role as part of the lean philosophy, resulting in these two methodologies being synonymous in today’s lean manufacturing environments.
organisation from implementing VSM, even when it has already embarked on the lean journey. Bicheno and Holweg (2009) also suggest that the whole activity of conducting current and future state maps is time-consuming and regarded as wasteful activity, unless it leads to a concrete action plan. Similarly, Huthwaite (2007) argues that Toyota does rarely apply VSM, but prefers to employ the ‘Standardised Work’ (SW) tool (Lu and Yang, 2015). SW is considered by Huthwaite (2007) to provide a more detailed analysis of processes than VSM and a more appropriate tool for standardising wasteful activities, instead of the requirement of initially depicting them in the current state map.
Although it is widely suggested that lean rarely exists without VSM, and vice-versa, the debate shown by the previous discussion led to the formulation of the following hypothesis:
H1: Organisations that have adopted lean manufacturing are highly likely to employ VSM as an essential tool to identify waste
To complement H1 and investigate why some lean organisations may have not employed VSM, the following complementary research question (CRQ) was posed:
CRQ1: What are the reasons that lead manufacturing organisations following lean manufacturing not to implement VSM?
On the other hand, Bhamu and Sangwan (2014), Braglia et al. (2009), Brännmark et al. (2012) and Keyte and Locher (2016) argue that VSM is the first step towards a lean transformation as it provides direction and focus to achieve it. They indicate that VSM helps organisations visualise waste, after which they might use other lean tools to minimise or eliminate it. Similarly, Grewal (2008) and Rivera and Chen (2007) mention that VSM has traditionally been the initial tool used to support the implementation of lean as it helps organisations to visualise the process, from which the application of other lean tools will follow. In the same line, Belokar et al. (2012) argue that VSM is an effective starting point for any business that intends to go lean since it enables a common language in regards to production processes and ties well together other lean tools. Finally, Cookson et al. (2011) suggest that VSM can be employed in the initial stages of a lean project in order to enable the creation of improvement ideas and initiatives.
However, Bicheno and Holweg (2009) argue that 5S ought to be the first tool to be used during the lean implementation. Its ‘housekeeping’ capabilities will enable an organisation to do an initial sweeping and regularisation of activities to facilitate the adoption of lean (Bicheno and Holweg, 2009). Similarly, empirical evidence also suggests that some organisations undertake a 5S programme, before using any other lean tool, when deciding to embark in lean efforts (Thomas et al., 2009).
The incongruences found in the academic literature prompted the formulation of the following hypothesis:
2.2 VSM and action plan for implementation
It is not clear whether all the lean tools require the same amount of training, or whether some of them are easier to be taught. Rother and Shook (1998), Chowdary and George (2011), Abdulmalek and Rajgopal (2007) and Singh and Sharma (2009) suggest that VSM is a simple pencil and paper tool, which consequently requires less time and effort to learn and implement. Similarly, Tyagi et al. (2015) argue that conducting a VSM study is an activity that can be completed within a short time period.
On the other hand, some of the most essential lean tools such as Just-in-Time (JIT), Total Productive Maintenance (TPM) and Jidoka (Rocha-Lona et al. 2013; Belekoukias et al., 2014) require a different and a more extensive training approach and resources availability. TPM is considered a complex and long term process which involves machinery and equipment training (Chan et al., 2005). This is because operators need to acquire a high level of understanding of preventive maintenance tasks and follow predefined planned maintenance activities such as inspections, cleaning, adjustments and replacements. Similarly, JIT is a complex philosophy which requires a substantial amount of time and effort invested in training due to the several tools that enable it, for example, Kanban, pull system, one piece flow, visual control, etc. (Belekoukias et al., 2014). In a greater extent, Im et al. (1994) argue that companies might need to invest up to 120 days and 4000 man-hours in their JIT training sessions. Finally, Jidoka involves the human aspect only in terms of workers halting the production line, after being notified by an Andon system. However, just as with Kaizen, it also requires training in regards to quality and process improvement principles, which can be more time-consuming than educating VSM stakeholders in how to conduct the mappings.
The aforementioned discussion suggests that VSM is simpler and easier to learn and use, when compared with some of the most essential lean tools such as JIT, TPM and Jidoka (Rocha-Lona et al. 2013; Belekoukias et al., 2014). However, to empirically test this evidence the following hypothesis has been formulated:
H3: VSM is likely to be easier and less time-consuming in terms of training than TPM, JIT and Jidoka
Furthermore, organisations need to recognise the importance that some critical success factors (CSFs) play in the effective implementation of lean and VSM in order to attain the desired results (Shou et al., 2017; Jeyaraman and Teo, 2010). This importance is also emphasised by Achanga et al. (2006). Shou et al. (2017), Manville et al. (2012) and Saad et al. (2006) have suggested that CSFs such as management commitment and involvement, training, organisational culture and infrastructure, financial capabilities, and employees’ skill and expertise are essential for effectively implementing lean. Complementarily, Serrano Lasa et al. (2008) mention that other CSFs such as an extensive and constant monitoring of the VSM stages as well as superior information systems to enable a faster acquisition, comparison and evaluation of data, need to be considered for the successful implementation of VSM.
hampers the latter. The Organisational culture CSF plays an important role, since it is frequent for high-performance organisations to have a culture of proactive and continuous improvement (Saad et al., 2006). In regards to VSM, Serrano Lasa et al. (2008) argue that extensive and constant monitoring of the VSM stages is highly substantial, and sufficient time needs to be invested in this activity. Furthermore, information systems are considered to be of great value due to their capabilities to accelerate the data acquisition process and the current state map creation. Finally, training is also a CSF acknowledged as highly important for a VSM team to enable the accomplishment of the desired future state maps (Serrano Lasa et al., 2008). Based on this, the following hypothesis has been formulated:
H4: Management commitment and involvement, training, organisational infrastructure, financial capabilities, employee skill and expertise, extensive monitoring and efficient information systems are likely to be NOT equally important for the successful implementation of VSM, and management involvement and commitment is likely to be more significant than all the other factors
To complement H4 and investigate the main challenges and risks that might result in the unsuccessful implementation of VSM, the following CRQ has been posed:
CRQ2: What are the main barriers that organisations face during the implementation of VSM?
2.3 VSM and results
Rother and Shook (1998) suggest that the creation of a lean value stream flow needs to be supported by lean concepts and tools such as Takt time, pull system, Kanban system, levelled production and hence the JIT philosophy. Bo and Dong (2012) also suggest that based on the indications of wastes illustrated in the current state map, different lean tools need to be employed to create a lean value flow. Furthermore, Abdulmalek and Rajgopal (2007) argue that after the identification of waste and the desired future process map demonstration, other more advanced tools need to be employed to actually solve the problem. The same has been recognised in the study conducted by Shou et al. (2017), where the authors have identified a number of lean tools that organisation commonly use to enable the attainment of the future state VSM.
However, Rother and Shook (1998) argue that VSM also contains tactics that are capable of eliminating waste, e.g. synchronisation of production with sales patterns, mapping’s ability to enable continuous flow and utilisation of the ‘pacemaker’ point to rearrange scheduling. Dinis-Carvalho et al. (2014) agree by stating that the ultimate aim of VSM is not just to identify the waste shown in the current state map, but also to eliminate it through generating an efficient future state map and implementing its indications. From this debate, the following hypothesis and CRQ were generated:
H5: VSM needs to be coupled with other lean tools, since it identifies waste and indicates where organisations should go, but in order to remove waste and reach that point organisations need to implement other lean tools
CRQ3: What are the main benefits that organisations gain by only using VSM?
3. Research Methodology
3.1 Research overall structure
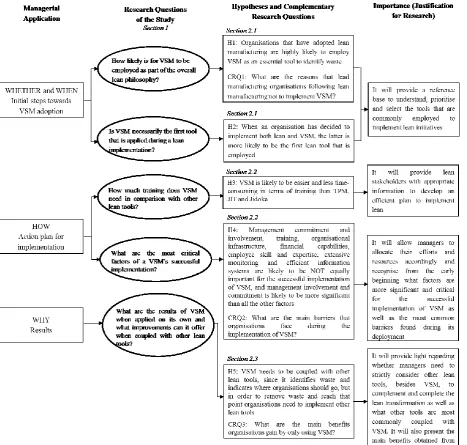
hypotheses and CRQs formulated to conduct the research. It also justifies and highlights the importance of the VSM aspects investigated in this study.
Figure 1. Conceptual illustration of the structure of this research
3.2 Data collection – survey questionnaire
to select, these were articulated by combining the findings and lessons obtained from the literature review and the industrial and research experience of the authors. Table 2 presents an overview of the questionnaire, including its sections, questions and relationship with the hypotheses and CRQs.
Table 2. Questionnaire overview and structure
Questions Reason for inclusion
PART A
Q1. Please specify the size of your company Profile questions to seek information about the company’s size, region,
manufacturing sector, experience and current position of the respondent
Q2. Please specify the company's region
Q3. Please specify the company's manufacturing sector
Q4. What is your experience on lean manufacturing?
Q5. What is your current job position?
PART B
Q6. Has your organisation (current, previous or a company you have worked for) implemented lean manufacturing?
Questions asked to test H1and answer
CRQ1
Q7. Has the same organisation implemented Value Stream Mapping?
Q19. (Follow up from previous question) If NO,
Research Question 1: Please rate the following reasons of why your organisation
has not implemented Value Stream Mapping:
Financial constraints / Lack of awareness / Lack of skilled personnel / No perceived benefits / Too much effort required / Lack of assistance for the implementation
Q6. Has your organisation (current, previous or a company you worked for) implemented lean manufacturing?
Questions asked to test H2
Q7. Has the same organisation implemented Value Stream Mapping?
Q8. IF YES to the above two questions, Which is the FIRST Lean tool that your organisation implemented?
Value Stream Mapping / Total Productive Maintenance (or one of the included TPM tools: OEE, SMED, 5S) / Just In Time (or one of the included JIT tools: One piece flow, Pull system, Kanban, TAKT time) / Autonomation - Jidoka (or one of the included Jidoka tools: Poka-yoke, Visual control system / Andon) / 5S
Q9a. How much time and effort is required from the lean facilitator to provide training
for TPM, compared to VSM?
Questions asked to test H3
Q9b. How much time and effort is required from the lean facilitator to provide training
for JIT, compared to VSM?
Q9c. How much time and effort is required from the lean facilitator to provide training
for Jidoka, compared to VSM?
Q10. Do you consider your Value Stream Mapping implementation to have been successful?
Questions asked to test H4 and answer
CRQ 2
Q11a. How strongly do you feel that training plays an important role in ensuring a
successful VSM implementation?
Q11b. How strongly do you feel that organisational culture plays an important role in
ensuring a successful VSM implementation?
Q11c. How strongly do you feel that financial capabilities play an important role in
ensuring a successful VSM implementation?
Q11d. How strongly do you feel that employee skill and expertise play an important
role in ensuring a successful VSM implementation?
Q11e. How strongly do you feel that extensive and constant monitoring of the VSM
stages plays an important role in ensuring a successful VSM implementation?
Q11f. How strongly do you feel that effective Information Systems play an important
role in ensuring a successful VSM implementation?
Q11g. How strongly do you feel that management commitment and involvement plays
Q12.Research Question 2: What are the main barriers that your organisation faced and caused problems during VSM implementation?
Check all that apply.
Lack of management commitment / Lack of employee training / Lack of employee commitment / Lack of financial support / Lack of skills and expertise / Undocumented or not properly defined processes / Inadequate IT systems integration / Lack of proper organisational structure / Inadequate layout / Too complex products / Wrong product projects / Volatile demands / Unstable processes / Usage of inappropriate measuring tools, such as obsolete current state maps.
Q13. How strongly do you feel that VSM on its OWN is appropriate for IDENTIFYING waste?
Questions asked to test H5 and answer
CRQ3
Q14. How strongly do you feel that there are other LEAN Tools (such as TPM, JIT, Jidoka, Standardised Work OR 5S) which are more appropriate than VSM for IDENTIFYING waste?
Q15. How strongly do you feel that VSM on its OWN is appropriate for REMOVING waste?
Q16. How strongly do you feel that there are other LEAN Tools (such as TPM, JIT, Jidoka, Standardised Work OR 5S) which are more appropriate than VSM for REMOVING waste?
Q17. Research Question 3: Please rate the following benefits your organisation has
achieved by SOLELY using Value Stream Mapping:
Identification of waste / Reduction of waste / Improved productivity / Reduction in cycle time / Reduction in Inventory / Reduction in Lead time / Reduced costs
Q18. Research Question 4: Which Lean tools has your organisation used specifically
for REMOVING waste?
Check all that apply:
Value Stream Mapping / Total Productive Maintenance (or one of the included TPM tools: OEE, SMED, 5S) / Just In Time (or one of the included JIT tools: One piece flow, Pull system, Kanban, TAKT time) / Autonomation - Jidoka (or one of the included Jidoka tools: Poka-yoke, Visual control system / Andon) / 5S
Table 2 is further illustrated in Figure 2, which demonstrates the systematic thinking process behind the development of the questionnaire.
Figure 2. Questionnaire framework in alignment with hypotheses and CRQs
3.3 Questionnaire validity and reliability
Robson (2011) identifies four reliability threats: subject or participant error, subject or participant bias, observer error and, observer bias. Thus, these threats need to be confronted in order to enhance and ensure that the questionnaire is valid and reliable. For this purpose, Robson (2011) suggests conducting a pilot study by distributing the questionnaire to ‘authorised’ respondents capable of confirming its validity and reliability. In this case, the questionnaire was distributed to six participants that included academic experts, statisticians, and manufacturing professionals. As a result, the questionnaire was amended/improved to eliminate participants’ errors and bias as follows:
Feedback from the academic experts provided further clarification and comprehensiveness in some of the posed questions;
Advice of the manufacturing professionals suggested adding other profile questions, e.g. experience of the participants on LM or his/her current job position, in order to obtain more correlations among the occurred results;
Feedback of the statistical experts ensured that the hypotheses could be tested. Minor changes such as recoding values of the questions to achieve guaranteed testing capability were implemented.
Observer error and bias were not relevant as the questionnaire used fixed-alternative questions that did not require interpretation.
3.4 Questionnaire distribution and data analysis
As this was an exploratory research, the questionnaires were distributed to respondents working in the manufacturing industry worldwide. The questionnaire was mainly distributed via LinkedIn, which according to Papacharissi (2009) is now increasingly becoming a reliable platform for the fast collection of research data. It was posted accompanied by a cover letter, which introduced the research and its objective, on thirteen relevant LinkedIn group societies related to LM and VSM. Thus, the population sampled included all the members of these thirteen group societies, which in total consisted of more than 600,000 lean and VSM experts worldwide. Other questionnaires were sent via e-mail to personal contacts of the authors, who were also requested to push forward the questionnaire to their own network, producing in this way the ‘snowballing sampling technique’, aiming to broaden the pool of respondents (Horwitz et al., 2006).
4. Study Results and Discussion
[image:12.595.94.496.181.614.2]4.1 Respondents and companies’ profile
Table 3 presents the profile of the respondents surveyed, and their organisations, in terms of their lean experience and position, as well as company’s size, geographic location and manufacturing sector.
Table 3. Respondents and organisations profiles
4.2 Hypotheses and CRQs – results and discussion
H1: Organisations that have adopted lean manufacturing are highly likely to employ VSM as an essential tool to identify waste
This hypothesis aimed at identifying ‘whether’ VSM is an essential, inextricable component of LM and ‘whether’ it is always implemented when an organisation intends to adopt lean. Since both variables were binary (i.e. 0-NO, 1-YES), a Pearson correlation analysis was carried out to test the correlation between the implementation of LM and VSM, see Figure 3.
Company size Lean Experience of Respondents
Small (<50 employees) 73.12% Very high 22.44% Medium (50-250 employees) 20.62% High 42.80% Large (>250 employees) 6.25% Medium 22.02%
Low 6.42%
Region Very Low 0.92%
Europe 55%
North America 24.38% Position of Respondents
Asia 10.62% Manager 31.25%
South America 5.00% Senior Manager 21.25%
Australia 3.12% Team Leader 18.75%
Africa 1.88% Director 13.75%
Managing Director 7.50%
Manufacturing Sector Team Member 7.50%
Automotive 27.50%
Miscellaneous 22.50%
Aerospace 8.12%
Chemical 8.12%
Electronics 7.50%
Machinery 7.50%
Fast moving customer goods 6.88%
Steel 3.75%
Transportation products or components manufacturing
3.12%
Apparel 1.68%
Textile 1.68%
Paper 0.62%
Figure 3. Pearson correlation analysis between lean and VSM for H1
The analysis indicated a significant correlation (i.e. over 70%) between the implementation of LM and VSM (LoBiondo-Wood and Haber, 2013). Based on this result, H1 was accepted, supporting the literature that suggests that organisations that implement lean manufacturing will most likely employ VSM (Seyedhosseini et al., 2013; Myerson, 2012; Nash and Poling, 2011; Grewal, 2008; Rother and Shook, 1998). On the other hand, the results also suggest that unlike Toyota, which prefers to use the Standardised Work approach instead (Huthwaite, 2007), most lean companies will apply VSM and will hence not avoid using it due to ‘bad rumours’ of being a tool that may provide negative results if not used appropriately (Belekoukias et al., 2014; Bicheno and Holweg, 2009).
CRQ1: What are the reasons that lead manufacturing organisations following lean manufacturing not to implement VSM?
[image:13.595.68.541.426.653.2]This question was formulated based on a Likert scale divided into five levels as shown by Figure 4.
Figure 4. Reasons as to why lean organisations do not implement VSM
unknown to some organisations. A tendency was also observed towards lack of skilled personnel and lack of assistance as the following two most important reasons.
Since the sample size was relatively small (i.e. N=14 responses – companies that had implemented lean but not VSM), the probability of assuming normality and equal variances across variables was low. Thus, it was decided not to assess CRQ1 through an ANOVA test. Since the conclusions drawn from this analysis cannot be validated by further statistical tests, additional research with a larger sample size is suggested to be conducted in this area.
H2: When an organisation has decided to implement both lean and VSM, the latter is more likely to be the first lean tool that is employed
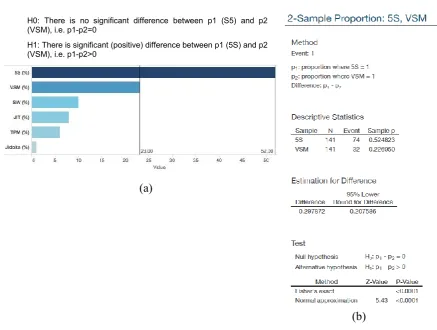
This hypothesis aimed at investigating ‘when’ VSM is normally used, in terms of whether it is the first tool applied by organisations that undertake the lean transformation. Based on the retrieved data (N=141), there is a clear indication, see Figure 5(a), that 5S (52.5%), and not VSM (22.7%), is more frequently chosen as the first tool that organisations apply during the lean implementation. A 2-Sample Proportion test was conducted to assess the significance of the difference between 5S and VSM. The results are shown in Figure 5(b). Since the P-value is less than 0.01% at a significance level of α=5%, the null hypothesis is rejected (Brook, 2010). Hence, there is a statistically significant difference between 5S and VSM to reject H2, suggesting that the first tool that is employed by organisations when implementing lean is 5S, and not VSM.
Figure 5. (a) Fist tool applied during the lean implementation and (b) 2-Sample Proportion test for H2
H3: VSM is likely to be easier and less time-consuming in terms of training than TPM, JIT and Jidoka
This hypothesis aimed at determining ‘how’ easy, or time-consuming, the training of VSM is in comparison to other lean tools in order to explore whether VSM’s description as a simple, time-efficient and easy to comprehend tool stands valid in the modern manufacturing environment (Tyagi et al. 2015; Chowdary and George, 2011; Abdulmalek and Rajgopal, 2007; Singh and Sharma, 2009; Rother and Shook, 1998). This will provide lean stakeholders with information to efficiently develop a timetable to implement lean within a predetermined time-efficient plan. Figure 6(a) shows a tendency of responses towards ‘more’ and ‘much more’ time needed from lean facilitators to provide training for TPM and JIT. Further statistical analyses were conducted to validate the significance of these conclusions.
Since there were four variables quantified (i.e. VSM, TPM, JIT, Jidoka) based on 141 responses, and the Likert scale was from 1 to 5 (interval data), normality and equal population variances across responses were assumed true (Sincich, 1995). Hence, any significant differences between variables were able to be assessed through a One-way ANOVA test. The results of the ANOVA test at a significance level of α=0.05 presented in Figure 6(b) suggested the rejection of the null hypothesis (H0), indicating that there is indeed a significant difference between the training and effort needed to implement VSM, TPM, JIT and Jidoka.
(a)
(b) H0: There is no significant difference between p1 (S5) and p2
(VSM), i.e. p1-p2=0
H1: There is significant (positive) difference between p1 (5S) and p2 (VSM), i.e. p1-p2>0
[image:15.595.55.493.67.397.2]
Figure 6. (a) Lean tools training difficulty in terms of time consumption and (b) ANOVA test for H3
Furthermore, a Tukey-Pairwise Comparison analysis was carried out to determine which factor(s) contributed the most to the significance of the test, see Figure 7. The analysis suggested that TPM and JIT were the most significant factors that contributed to the rejection of the ANOVA test’s null hypothesis. Additionally, given that the aforementioned factors showed a significant positive difference of means compared to VSM (T-Value for TPM-VSM= 3.77, Adj. P-Value= 0.09%; T-Value for JIT-TPM-VSM= 3.06, Adj. P-Value= 1.19%), it can be confirmed that at a significance level of α= 5%, these factors need much more time and effort in terms of training compared to VSM. This corroborated the more complex nature of TPM and JIT suggested in the literature (Chan et al., 2005; Im et al., 1994). On the other hand, Jidoka was not significantly different from VSM (TPM and JIT belong to Group A, whereas Jidoka and VSM belong to Group C). Therefore, H3 is partially accepted, suggesting that VSM training would require substantially less amount of time and effort from lean facilitators compared to TPM and JIT, whilst Jidoka can be considered as equally easy and less time-consuming tool to be taught.
Figure 7. Tukey Pairwise test for Post-Hoc analysis for H3
H4: Management commitment and involvement, training, organisational infrastructure, financial capabilities, employee skill and expertise, extensive monitoring and efficient information systems are likely to be NOT equally important for the successful implementation of VSM, and management involvement and commitment is likely to be more significant than all the other factors
The testing of this hypothesis will allow organisations to allocate their efforts and resources accordingly and recognise, from the early beginning, whether any factor is more significant and critical than the others. Since out of 141 respondents 19 of them did not consider the implementation of VSM successful in their organisations, see Q10 in Table 2, the analyses performed to test this hypothesis and RQ2 were carried out with a sample of 122 organisations.
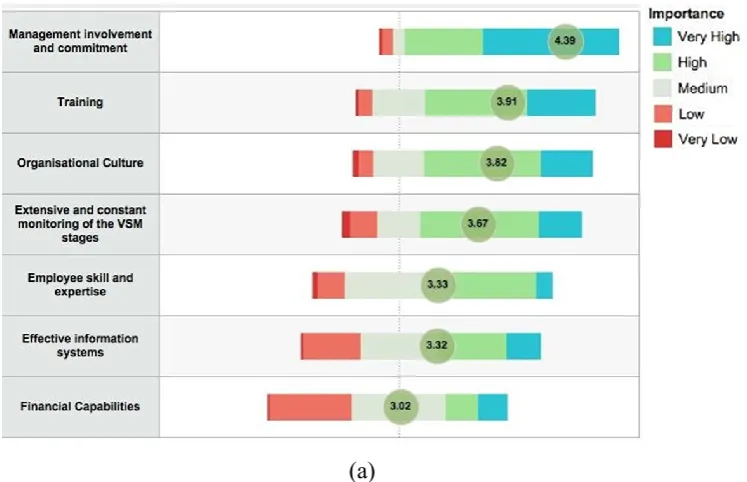
Figure 8. (a) Importance of CSFs for the effective implementation of VSM and (b) One-way ANOVA for H4
(a)
[image:18.595.116.490.75.316.2]As indicated in Figure 8(b), at a significance level of α=0.05, the null hypothesis was rejected, indicating that the CSFs have different effect on the effective implementation of VSM. In order to determine which factor(s) contribute the most to this effect, a Tukey-Pairwise Comparison test was carried out, see Figure 9.
Figure 9. Tukey Pairwise test for Post-Hoc analysis for H4
Figure 9 shows that management commitment and involvement is the most important success factor to effectively implement VSM. This is confirmed by the relevant literature, which argues that leadership and management is the most important factor for a successful lean transformation, and is considered as the cornerstone for the efficient implementation of any lean initiative (Saad et al., 2006). Furthermore, training, organisational culture and extensive and constant monitoring of VSM stages share the same level of importance. The significance of training in VSM is confirmed by Serrano Lasa et al. (2008), who highlight its importance for the team to be able to accomplish the desired future state maps. In the case of organisational culture, the finding regarding its importance for VSM is compatible with Saad et al.'s (2006) argument that organisational culture plays an important role, since it is frequent for high-performance organisations to have a culture of proactive and continuous improvement.
Similarly, employee skill and expertise shares the same importance level with effective information systems. Finally, financial capability has the lowest importance when applying VSM. Therefore, since all CSFs have different levels of importance, and ‘management commitment and involvement’is perceived as the most important factor, H4 was accepted.
CRQ2: What are the main barriers that organisations face during the implementation of VSM?
Figure 10. Main barriers for the implementation of VSM
H5: VSM needs to be coupled with other lean tools, since it identifies waste and indicates where organisations should go, but in order to remove waste and reach that point organisations need to implement other lean tools
Questions
1.
2.
3.
(a)
(b) (c)
Figure 11. (a) VSM as a ‘stand-alone’ or coupled tool and 1-Sample t-tests for VSM as a (b) waste identifier, (c) remover, and (d) other lean tools as waste removers
In order to conduct the 1-Sample t-tests, null (H0) and alternative hypotheses (H1) were formulated to compare the mean values of the respondents’ ratings and the neutral value (i.e. μ= 3). A P-value of less than 0.01% indicates that the null hypothesis is rejected at a significance level of 5% (Newbold et al., 2012). Based on the respondents perceptions, the 1-Sample t-tests suggested that: (1) VSM on its own is effective for identifying waste (see Figure 11b), but not for (2) for removing waste (see Figure 11c), whereas it also indicated that other lean tools (e.g. TPM, JIT, Jidoka, Standardised Work or 5S) are more effective than VSM for removing waste (see Figure 11d). As a result, H5 was accepted.
The acceptance of the second and third ‘sub-hypotheses’ is compatible with Shou et al., (2017) and Bo and Dong’s (2012) findings and suggestion that in order to remove the identified wastes and create a lean value stream, more lean tools than only VSM need to be utilised. Similarly, Abdulmalek and Rajgopal (2007) contend that after the waste indication and the desired future process map conduction other tools need to be applied to actually solve the problems. On the other hand, the results contradict Rother and Shook’s (1998) suggestion that VSM contains tactics that are capable of eliminating waste after current state maps are drawn. Finally, the research findings are not compatible with Dinis-Carvalho et al.’s (2014) perception as they agree to the fact that the purpose of VSM is not just to identify the waste presented in the current state map but also to eliminate it through generating future state maps and applying their indications.
CRQ3: What are the main benefits that organisations gain by only using VSM?
Figure 12. Benefits obtained from the ‘stand-alone’ implementation of VSM
5. Conceptual Framework to Support the Implementation and Management of VSM
Based on the results obtained from the investigation presented in the previous sections, a conceptual framework to support the implementation and management of VSM was developed through the unification of such results, see Figure 13. The framework is aligned with the questionnaire structure, hypotheses and CRQs as shown by Figure 2, responding to the questions as to ‘Whether’, ‘When’, ‘How’ and ‘Why’ VSM should be implemented. The framework considers the most common practices regularly employed by manufacturers when implementing and using VSM. The following subsections discuss the main components of the conceptual framework.
5.1 Initial steps for VSM adoption (Whether and When?)
The adoption of lean manufacturing requires the implementation of some of its tools at different stages of the lean journey (Karim and Arif-Uz-Zaman, 2013). As suggested by the framework, see Figure 13, organisations might initiate the lean journey by implementing 5S (Stage 1). This will help them to organise their workplace and standardise their operational methods, making the subsequent study of the value streams easier to visualise and assess (Thomas et al., 2009). This will consequently enable the organisation to more efficiently and accurately identify wastes in the value stream through the VSM study suggested by the framework to be conducted in Stage 2. Since the results of this study suggest that VSM will effectively contribute in the identification of waste but not in its reduction, other lean tools (e.g. TPM, JIT, etc.) will then need to be implemented (Stage 3), see Section 5.3. In this context, although the implementation of 5S will precede that of VSM, the second will still take its place as one of the initial facilitators of lean implementation as suggested in the academic literature (Rivera and Chen, 2007; Belokar et al., 2012; Cookson et al., 2011; Bhamu and Sangwan, 2014; Brännmark et al., 2012; Braglia et al., 2009; Keyte and Locher, 2016). The results of this research suggest that the implementation of VSM will be less complex and time consuming than most of the subsequent lean tools that will require to be deployed in Stage 3 to reduce waste.
5.2 VSM and action plan for implementation (How?)
To successfully implement VSM, the conceptual framework suggests organisations to consider increasing efforts to develop the main CSFs (i.e. management commitment and involvement, training and organisational culture) that determine the successful implementation of VSM. Similarly, the framework advocates the reduction of those barriers (i.e. lack of management commitment and involvement, undocumented or not properly defined processes and lack of employee training) which hinder its deployment according to this study’s results. Awareness of these CSFs and barriers will help organisations to understand the critical areas which they have to accomplish to successfully implement VSM, and hence lean manufacturing, by examination and categorisation of their impacts. At a strategic level this will support the enhancement of the organisation’s critical decision‐making process needed for the delivery of corporate strategic ambitions towards the implementation of VSM and lean manufacturing. On the other hand, at tactical and strategic levels this will allow organisations to more effectively plan, prioritise and allocate those resources needed to support the implementation of VSM and lean manufacturing accordingly.
5.3 VSM and results
6. Concluding Remarks, Limitations and Future Research
This paper investigates the practical and managerial issues surrounding the implementation and management of VSM, as a part of the overall lean philosophy and in correlation with some of the most essential lean tools commonly applied by manufacturing organisations. Therefore, this research is among the very first studies that have focused on the ‘soft’ aspect of VSM. For this reason, this study fills a research gap as previously highlighted in Section 1 and extends our knowledge by:
Exploring the linkage of VSM implementation with that of lean manufacturing by investigating whether organisations that have adopted lean have also employed VSM as an essential tool to identify waste;
Investigating the position that VSM normally takes in the timeframe hierarchy of lean implementation;
Helping us to understand the complexity of VSM implementation in terms of easiness and time taken for training when compared to other lean tools such as TPM, JIT and Jidoka; Defining the CSFs and barriers for the VSM implementation; and
Providing a conceptual framework that expands our understanding of and supports the implementation of VSM.
These contributions are beneficial for manufacturing managers who aim to effectively deploy VSM, and lean manufacturing, in their organisations. Due to the wide applicability of VSM and lean manufacturing, other sectors where they have been applied such as services (e.g. Barber and Tietje, 2008), healthcare (e.g. Teichgräber and de Bucourt, 2012), logistics and transport (Villarreal et al. 2016a; Villarreal et al., 2016b), among others, are also likely to benefit from this study. All these sectors are under constant pressure to operate competitively and the effective implementation of lean manufacturing, supported by VSM, provides them with this opportunity.
Overall, the paper provides some insight into the managerial implications regarding the implementation and management of VSM, encouraging in this way its application. For this reason, it provides trustworthy evidence for practitioners of the managerial factors that may play a significant role in the effective implementation of VSM. Therefore, empirically testing the proposed conceptual framework, and its propositions, are the next steps aiming to close the gap between theory and practice. Regarding the central focus of this paper, it is mainly concentrated on management aspects. Thus, an opportunity exists to investigate, define and rank the enhancing operators and training attributes that may also contribute to the successful implementation of VSM. As suggested by Binti Aminuddin et al. (2015) and Theagarajan and Manohar (2015), this can be done for specific industries and countries, and through the
use of, for example, a combination of fuzzy logic and quality function deployment. This paper has a number of limitations, with compounding factors that are imperative to
limited amount of significant regional sampling (i.e. 141 responses in total) and the fact that the Likert-style rating scale for the survey limits the ability of respondents to express opinions other than the pre-set answers. It would therefore be beneficial to conduct a larger scale study focused on specific regions to also consider particular characteristics (e.g. culture) that may also play a role in the implementation and management of VSM. This is part of the future research agenda proposed from this research. To overcome the Likert scale limitation, coupling this research with a qualitative approach such as interviews on selected companies would validate the results further. Finally, further research is also suggested in regards to the conceptual framework proposed to support the implementation and management of VSM. This can be done through a multi-case study research approach to shed light into its effectiveness when applied in a real industrial setting. This study has therefore not only brought light into specific managerial practices that affect the implementation of VSM but it has also opened up new areas for research.
References
Abdulmalek, F.A., Rajgopal, J. (2007), “Analyzing the benefits of lean manufacturing and value stream mapping via simulation: A process sector case study”, International Journal of Production Economics,107(1), 223-236.
Achanga, P., Shehab, E., Roy, R., Nelder, G. (2006), “Critical success factors for lean implementation within SMEs”, Journal of Manufacturing Technology Management, 17(4), 460-471.
Barber, S., Tietje, B.C. (2008), “A Research Agenda for Value Stream Mapping the Sales Process”, Journal of Personal Selling & Sales Management, 28(2), 155-165.
Barberato Henrique, D., Freitas Rentes, A., Godinho Filho, M., Francisco Esposposto, K. (2016), “A new value stream mapping approach for healthcare environments”, Production Planning & Control, 27(1), 24-48.
Belekoukias, I., Garza-Reyes, J.A., Kumar, V. (2014), “The impact of lean methods and tools on the operational performance of manufacturing organisations”, International Journal of Production Research, 52(18), 5346-5366.
Belokar, R., Kumar, V., Kharb, S.S. (2012), “An application of value stream mapping in automotive industry: a case study”, International Journal of Innovative Technology and Exploring Engineering, 1(2), 152-157.
Bhamu, J., Sangwan, K.S. (2014), “Lean manufacturing: literature review and research issues”, International Journal of Operations & Production Management, 34(7), 876 – 940.
Bicheno, J., Holweg, M. (2009), The lean toolbox: The essential guide to lean transformation, 4th Ed., Picsie Books, Buckingham. =
Binti Aminuddin, N.A., Garza-Reyes, J.A., Kumar, V., Antony, J. (2015), “An analysis of managerial factors affecting the implementation and use of Overall Equipment Effectiveness”, International Journal of Production Research, DOI: 10.1080/00207543.2015.1055849 (in press).
Bo, M., Dong, M. (2012), “Research on the lean process reengineering based on value stream mapping for Chinese enterprises”, Management Science and Engineering, 6(2), 103-106.
Braglia, M., Frosolini, M., Zammori, F. (2009), “Uncertainty in value stream mapping analysis”, International Journal of Logistics Research and Applications, 12(6), 435-453.
Brännmark, M., Langstrand, J., Johansson, S., Halvarsson, A., Abrahamsson, L., Winkel, J. (2012), “Researching lean: Methodological implications of loose definitions”, Quality Innovation Prosperity, 16(2), 35-48.
Brook, Q. (2010), Lean Six Sigma and Minitab: The complete toolbox guide for all lean six sigma practitioners, 3rd edition, Opex Resources, Winchester.
Chan, F.T.S., Lau, H.C.W., Ip, R.W.L., Kong, S., (2005), “Implementation of total productive maintenance: A case study”, International Journal of Production Economics, 95(1), 71-94.
Chen, J.C., Li, Y., Shady, B.D. (2010), “From value stream mapping toward a lean/sigma continuous improvement process: an industrial case study”, International Journal of Production Research, 48(4), 1069-1086.
Chowdary, B.V., George, D. (2011), “Improvement of manufacturing operations at a pharmaceutical company: a lean manufacturing approach”, Journal of Manufacturing Technology Management, 23(1), 56-75.
Cookson, D., Read, C., Cooke, M. (2011), “Improving the quality of emergency department care by removing waste using lean value stream mapping”, The International Journal of Clinical Leadership, 17(1), 25-30.
Dinis-Carvalho, J., Moreira, F., Bragança, S., Costa, E., Alves, A., Sousa, R. (2014), “Waste identification diagrams”, Production Planning & Control, 26(3), 235-247.
Forno, A., Pereira, F., Forcellini, F., Kipper, L. (2014), “Value Stream Mapping: a study about the problems and challenges found in the literature from the past 15 years about application of lean tools”, The International Journal of Advanced Manufacturing Technology, 72(5), 779-790.
Grewal, C. (2008), “An initiative to implement lean manufacturing using Value Stream Mapping in a small company”, International Journal of Manufacturing Technology and Management, 15(3/4), 404-417.
Hines, P., Holweg, M. and Rich, N. (2004), “Learning to evolve: a review of contemporary lean thinking”, International Journal of Operations & Production Management, Vol. 24, No. 10, pp. 994–1011.
Horwitz, F.M., Bravington, D., Silvis, U. (2006), “The promise of virtual teams: identifying key factors in effectiveness and failure”, Journal of European Industrial Training, 30(6), 472-494.
Huthwaite, B. (2007), The lean design solution: a practical guide to streamlining product design and development, 2nd Ed., Institute for Lean Innovation, Mackinac Island. Im, J.H., Hartman, S.J., Bondi, P.J. (1994), “How do JIT systems affect human resource
management?”, Production and Inventory Management Journal, 35(1), 1-4.
Jasti, N.V.K., Sharma, A. (2014), “Lean manufacturing implementation using value stream mapping as a tool: A case study from auto components industry”, International Journal of Lean Six Sigma, 5(1), 89-116.
Jeyaraman, K., Teo, L.K. (2010), “A conceptual framework for critical success factors of lean Six Sigma: Implementation on the performance of electronic manufacturing service industry”, International Journal of Lean Six Sigma, 1(3), 191-215.
Karim, A., Arif‐Uz‐Zaman, K. (2013), “A methodology for effective implementation of lean strategies and its performance evaluation in manufacturing organizations”, Business Process Management Journal, 19(1), 169-196.
Keyte, B., Locher, D.A. (2016), The complete lean enterprise: Value Stream mapping for office and services, 2nd ed., Productivity Press, CRC Press, Taylor&Francis, Boca Raton, FL.
King, P.L., King, J.S. (2015), Value Stream Mapping for the Process Industries: Creating a Roadmap for Lean Transformation, Productivity Press, Boca Raton, FL.
Kirkham, L., Garza-Reyes, J.A., Kumar, V., Antony, J. (2014), “Prioritisation of operations improvement projects in the European manufacturing industry”, International Journal of Production Research, 52(18), 5323–5345.
Kumar, M., Khurshid, K.K., Waddell, D. (2014), “Status of quality management practices in manufacturing SMEs: a comparative study between Australia and the UK.” International Journal of Production Research, 52(21), 6482–6495.
Liker, J.K., Meier, D. (2006), The Toyota way Fieldbook, a practical guide for implementation Toyota’s 4P’s, McGraw-Hill, NY.
LoBiondo-Wood, G., Haber, J. (2013), Nursing Research: Methods and Critical Appraisal for Evidence-Based, 8th edition, Mosby, Sydney.
Lu, J.C., Yang, T. (2015), “Implementing lean standard work to solve a low work-in-process buffer problem in a highly automated manufacturing environment”, International Journal of Production Research, 53(8), 2285-2305.
Manville, G., Greatbanks, R., Krishnasamy, R., Parker, D.W. (2012), “Critical success factors for Lean Six Sigma programmes: a view from middle management”, International Journal of Quality & Reliability Management, 29(1), 7-20.
Myerson, P. (2012), Lean supply chain and logistics management, McGraw-Hill, NY.
Nash, M.A., Poling, S.R. (2011), Mapping the total value stream: a comprehensive guide for production and transactional processes, Productivity Press, CRC Press, Taylor & Francis, Boca Raton, FL.
Newbold, P., Carlson, W.C., Thorne, B.M. (2012), Statistics for Business and Economics, Pearson, Harlow.
Papacharissi, Z. (2009), “The virtual geographies of social networks: a comparative analysis of Facebook, LinkedIn and ASmallWorld”, New media & society 11(1-2), 199-220. Parthanadee, P., Buddhakulsomsiri, J. (2014), “Production efficiency improvement in batch
production system using value stream mapping and simulation: a case study of the roasted and ground coffee industry”, Production Planning & Control, 25(5), 425-446. Pepper, M.P.J., Spedding, T.A. (2010), “The evolution of lean Six Sigma”, International
Journal of Quality & Reliability Management, 27(2), 138-155.
Rivera, L., Chen, F.F. (2007), “Measuring the impact of lean tools on the cost–time investment of a product using cost–time profiles”, Robotics & Computer-Integrated Manufacturing,23(6),684-689.
Rocha-Lona, L., Garza-Reyes J.A., Kumar, V. (2013), Building quality management systems: selecting the right methods and tools, Productivity Press, CRC Press, Taylor & Francis, Boca Raton, FL.
Rother, M., Shook, J. (1998), Learning to see, Lean Enterprise Institute, Cambridge, MA. Saad, S., Perera, T., Achanga, P., Shehab, E., Roy, R., Nelder, G. (2006), “Critical success
factors for lean implementation within SMEs”, Journal of Manufacturing Technology Management,17(4), 460-471.
Saboo, A., Garza-Reyes, J.A., Er, A., Kumar, V. (2014), “A VSM improvement-based approach for lean operations in an Indian manufacturing SME”, International Journal of Lean Enterprise Research, 1(1), 41-58.
Seyedhosseini, S.M., Taleghani, A.E., Makui, A., Ghoreyshi, S.M. (2013), “Fuzzy value stream mapping in multiple production streams: A case study in a parts manufacturing company”, International Journal of Management Science and Engineering Management, 8(1), 56-66.
Serrano Lasa, I., Ochoa Laburu, C., De Castro Vila, R. (2008), “An evaluation of the value stream mapping tool”, Business Process Management Journal, 14(1), 39-52.
Serrano Lasa, I., de Castro, R., Ochoa Laburu, C. (2009), “Extent of the use of Lean concepts proposed for a value stream mapping application”, Production Planning & Control, 20(1), 82-98.
Seth, D., Seth, N., Goel, D. (2008), “Application of value stream mapping (VSM) for minimization of wastes in the processing side of supply chain of cottonseed oil industry in Indian context”, Journal of Manufacturing Technology Management, 19(4), 529-550.
Sincich, T.L. (1996), Business statistics by example, Prentice Hall Englewood Cliffs, NJ. Singh, B., Sharma, S.K. (2009), “Value stream mapping as a versatile tool for lean
implementation: an Indian case study of a manufacturing firm”, Measuring Business Excellence, 13(3), 58-68.
Singh, B., Garg, S.K., Sharma, S.K. (2011), “Value stream mapping: literature review and implications for Indian industry, The International Journal of Advanced Manufacturing Technology, 53(5), 799-809.
So, S., Sun, H. (2010), “Supplier integration strategy for lean manufacturing adoption in electronic-enabled supply chains”, Supply Chain Management: An International Journal, 15(6), 474-487.
Shou, W., Wang, J., Wu, P., Wang, X., Cong, X.Y. (2017), “A cross-sector review on the use of value stream mapping”, International Journal of Production Research, 55(13), 3906-3928.
Stadnicka, D., Ratnayake, R.M.C. (2016), “Minimization of service disturbance: VSM based case study in telecommunication industry”, IFAC PapersOnLine, 49(12), 255-260. Teichgräber, U.K., de Bucourt, M. (2012), “Applying value stream mapping techniques to
eliminate non-value-added waste for the procurement of endovascular stents”, European Journal of Radiology, 81(1), e47-e52.
Thomas, A., Barton, R., Chuke‐Okafor, C. (2009), “Applying lean six sigma in a small engineering company – a model for change”, Journal of Manufacturing Technology Management, 20(1), 113-129.
Tyagi, S., Choudhary, A., Cai, X., Yang, K. (2015), “Value stream mapping to reduce the lead-time of a product development process”, International Journal of Production Economics, 160, 202-212.
Venkataraman, K., Ramnath, B.V., Kumar, V.M., Elanchezhian, C. (2014), “Application of Value Stream Mapping for Reduction of Cycle Time in a Machining Process”, Procedia Materials Science, 6, 1187-1196.
Villarreal, B., Garza-Reyes, J.A., Kumar, V. (2016a), “Lean road transportation – a systematic method for the improvement of road transport operations”, Production, Planning & Control: The Management of Operations, 27(11), 865-877.
Villarreal, B., Garza-Reyes, J.A., Kumar, V., Lim, M.K. (2016), “Improving road transport operations through lean thinking: A case study”, International Journal of Logistics Research and Applications, 20(2), 163-180.
Womack, J.P., Jones, D.T. (2003), Lean thinking: Banish waste and create wealth in your corporation, Simon & Schuster UK Ltd., London.