Seasonal variability in microbial methanol utilisation in coastal waters of the western
English Channel.
*1Sargeant, SL., 2Murrell, JC., 1Nightingale, PD., 1Dixon, JL. 5
1
Plymouth Marine Laboratory, Prospect Place, West Hoe, Plymouth, Devon, PL1 3DH, UK
2
School of Environmental Science, University of East Anglia, Norwich Research Park, Norwich, NR4 7TJ, UK
10
*Now at: Department of Biological, Biomedical and Analytical Sciences, University of the West of England, Frenchay Campus, Coldharbour Lane, Bristol, BS16 1QY, UK.
Running title: Seasonal variability in microbial methanol utilisation
Keywords: 14CH3OH / bacterial growth efficiency / methanol uptake / methylotrophic 15
bacteria / marine
*Corresponding Author; stephanie.sargeant@uwe.ac.uk, T: 44 1173 287121
Dr Stephanie L Sargeant, Department of Biological, Biomedical and Analytical Sciences, University of the West of England, Frenchay Campus, Coldharbour Lane, Bristol, BS16 20
1QY, UK.
Abstract
Methanol is ubiquitous in seawater and the most abundant oxygenated volatile organic compound (OVOC) in the atmosphere where it influences oxidising capacity and ozone formation. Marine methylotrophic bacteria utilise methanol in seawater both as an energy and/or growth substrate. This work represents the first fully resolved seasonal study of 5
marine microbial methanol uptake dynamics. Rates of microbial methanol dissimilation in coastal surface waters of the UK varied between 0.7 – 11.2 nmol l-1 h-1 and reached a maximum in February. Rates of microbial methanol assimilation varied between 0.04 – 2.64 x 10⁻² nmol l-1 h-1 and reached a maximum in August. Temporal variability in microbial methanol uptake rates shows that methanol assimilation and dissimilation display opposing 10
seasonal cycles, although overall <1% of methanol was assimilated. Correlative approaches with 16S rRNA pyrosequencing data suggested that bacteria of the SAR11 clade and Rhodobacterales could be significantly influencing rates of methanol dissimilation and
Introduction
Methanol is the single largest component of the total pool of oxygenated volatile organic compounds (OVOC) in the atmosphere (approximately 400 – 800 ppt in the Atlantic troposphere, Singh et al. 2001) and is ubiquitous in marine waters (e.g. Heikes et al. (2002), Singh et al. (2003), Williams et al. (2004), Beale et al. (2013), Beale et al. (2015), Yang et al. 5
(2014a). Methanol (and other OVOCs) substantially influences the oxidising capacity and ozone-forming potential of the atmosphere (Singh et al. 2001 and references therein), where it acts as a sink for hydroxyl radicals (Galbally & Kirstine 2002) producing formaldehyde (Millet et al. 2006) and carbon monoxide (Duncan & Logan 2008), among other products and is thus a climate-relevant gas.
10
Knowledge of the sources and sinks of marine methanol is limited. A net air-to-sea flux was first demonstrated in Northern temperate waters by Beale et al. (2013). Recent direct flux measurements of methanol also demonstrated a consistent flux of methanol from the atmosphere to surface waters along a meridional transect of the remote Atlantic Ocean (Yang 15
et al. 2013) and the Greenland Sea (Yang et al. 2014b). Methanol is ubiquitous in atmospheric and marine environments where seawater concentrations have been reported ranging between <27 and 429 nM (Williams et al. 2004, Kameyama et al. 2010, Beale et al. 2013, Yang et al. 2013, Yang et al. 2014b, Beale et al. 2015). An annual study in the western English Channel reported surface seawater methanol concentrations ranging between 16 and 20
been found to be negligible, therefore surface seawater methanol concentrations are thought to be largely controlled by microbial metabolism (Dixon et al. 2013).
Most known aerobic methylotrophic bacteria can utilise methanol as a carbon and/or energy source usually through the use of methanol dehydrogenase (MDH) encoded by the gene 5
mxaF (Chistoserdova et al. 2009, Chistoserdova 2011), which can be used as a functional gene marker (McDonald & Murrell 1997). These bacteria are widespread in both terrestrial and aquatic systems (Kolb 2009), but have not been studied as extensively in marine environments. For the purposes of this research, microbial methanol oxidation to derive energy is referred to as microbial methanol dissimilation (to CO2) and the incorporation of 10
methanol for growth (into cell material) is considered as microbial methanol assimilation. The concept of cells producing energy but not biomass from C1 compounds has received relatively little attention. However, Sun et al. (2011) proposed a new term ‘methylovores’ to distinguish cells such as SAR11 that utilise methanol and other C1 compounds only as a source of energy, from strict methylotrophs, which use C1 compounds as sources of energy 15
and carbon for growth.
Stable isotope probing (SIP) incubations using 13C-labelled methanol have previously confirmed that surface waters at temperate coastal sampling site L4 (www.westernchannelobservatory.org.uk) harbour methylotrophs actively assimilating 20
of up to 146 nmol l-1 d-1 have been observed in more tropical remote Atlantic regions (Dixon et al. 2011b). Methanol assimilation rates have been previously shown to range between 0.04 and 10.00 nmol l-1 d-1 in Atlantic waters, with maximum rates associated with recently upwelled water (Dixon et al. 2013). There are no published rates of microbial methanol assimilation in temperate coastal waters. The average bacterial growth efficiency of 5
methanol (BGEM, percentage of methanol assimilated by microbes rather than dissimilated to CO2) for Atlantic waters is 3%, but can reach up to 57% in recently upwelled coastal waters (Dixon et al. 2011b).
Bacteria belonging to the SAR11 clade (e.g. Pelagibacter), the most abundant heterotrophs in 10
the ocean (Giovannoni et al. 2005), have also been shown to dissimilate C1 compounds, including methanol, to CO2 to derive reducing power and energy (Sun et al. 2011). This bacterial clade lacks methanol dehydrogenase, and cultivation experiments suggest that SAR11 cells do not assimilate carbon from methanol into biomass (Sun et al. 2011). The methanol dissimilation rates measured in these in vitro experiments were comparable to those 15
measured in situ by microbial communities in the North East Atlantic (Dixon et al. 2011b). Thus methanol oxidation by SAR11 cells could represent a significant conduit by which dissolved organic carbon is recycled to CO2 in the upper ocean.
OM43, a clade of Betaproteobacteria (Giovannoni et al. 2008), is commonly found in 20
(Giovannoni et al. 2008). The xoxF gene is a homolog of the traditional mxaF gene and encodes an alternative pathway for methanol oxidation (Schmidt et al. 2010). Very recently, it has been used as a functional gene marker in cultivation-independent studies of methylotrophs in the environment (Taubert et al. 2015). Halsey et al. (2012) subsequently showed that the growth of HTCC2181 is enhanced by a variety of C1-substrates suggesting 5
that HTCC2181 may be able to incorporate carbon from methanol whilst simultaneously using other C1-compounds as energy sources.
The objective of this study was to examine the seasonal variability in rates of microbial methanol utilisation, and investigate relationships between microbial methanol utilisation 10
rates, environmental parameters and diversity of methylotrophs at a temperate coastal site. This study provides the first fully resolved seasonal evaluation of microbial methanol uptake in coastal waters.
Materials and methods 15
Sample collection
Coastal sampling station, L4, is located in the western English Channel (WEC, 50° 15.00 N, 4° 13.02 W, sampling depth ~5 m, Smyth et al. 2010) approximately 10 km from the coast of Plymouth, UK. This sampling station forms part of the Western Channel Observatory (WCO, www.westernchannelobservatory.org.uk) and is a long-term time series station 20
(Harris 2010). Sampling at L4 was carried out between April 2011 and April 2012 using a Conductivity Temperature Depth (CTD) rosette mounted with Niskin bottles to collect surface water (~5m) every two weeks. Seasons were defined as spring (March – May), summer (June – August), autumn (September – November) and winter (December – February).
Microbial methanol utilisation
Rates of microbial methanol uptake were determined by adding 14C-labelled methanol (American Radiolabelled Chemicals Inc, Saint Louis, MO, USA) to seawater as previously described in Dixon et al. (2011a). Incubations of 10 nM (final concentration) 14C-labelled methanol with surface seawater samples of 1 ml (methanol dissimilation to CO2) and 320 ml 5
(methanol assimilation into biomass) were used to measure microbial utilisation rates. In situ surface methanol concentrations during the sampling period ranged between 34 and 68 nM (Beale et al. 2015), thus our radioisotope additions represent between 15 and 29% of in situ concentrations. Incubations were conducted in triplicate at in situ temperatures and in the dark, together with negative controls ‘killed’ with 5% w/v trichloroacetic acid, TCA, (final 10
concentration), for dissimilation samples or 0.01% w/v mercuric chloride, HgCl2 (final concentration) for assimilation samples (due to differences in sample volume). Incubation temperatures were matched to the in situ sea surface temperatures at Station L4, which ranged between 9 – 17°C throughout the sampling period.
15
Sample counts of 14C-labelled methanol (mCi ml-1 h-1) were generated either from the particles on the filter (assimilation method) or the precipitate containing the captured 14CO2 as Sr14CO3 (dissimilation method). Sample counts of 14C-labelled methanol (mCi ml-1 h-1) were multiplied by the specific activity of 14C-labelled methanol (5.71 x 10⁻⁴ mCi nmol-1) and by 1000 to calculate rates of microbial methanol dissimilation and assimilation (nmol l-1 h-1). 20
The bacterial growth efficiency of methanol (BGEM) was calculated as the rate of microbial methanol assimilation divided by the rate of total microbial methanol uptake, multiplied by 100 and was used as an indicator to quantify the fraction of carbon assimilated from methanol directly into biomass (Dixon & Nightingale 2012).
Heterotrophic bacterial production
Rates of heterotrophic bacterial production were determined with 1.7 ml surface seawater samples using the incorporation of 3H-leucine (final concentration of 25 nM, specific activity of 161 Ci mmol-1, American Radiolabelled Chemicals Inc, Saint Louis, MO, USA) into 5
bacterial protein, according to Smith & Azam (1992). Samples were incubated in triplicate at in situ temperature in the dark, and were corrected for abiotic sorption using control samples
that were killed with trichloroacetic acid (5% final concentration).
A theoretical leucine-to-carbon conversion factor (1.55 kg C mol leu-1, Smith & Azam 1989) 10
was applied to rates of bacterial leucine incorporation to provide an upper estimate of bacterial production rates, as per an earlier study in the English Channel (Lamy et al. 2009). This theoretical conversion factor of 1.55 kg C mol leu-1 (Simon & Azam 1989) has also been used previously in a range of contrasting marine environments, from productive coastal waters to oligotrophic gyre regions (Lamy et al. 2009, Laghdass et al. 2012, Dixon et al. 15
2013).
Bacterial numbers, nutrients and chlorophyll a concentrations
Bacterial numbers, nutrient concentrations and concentrations of chlorophyll a were measured and data provided by the Western Channel Observatory 20
scattering and autofluorescence properties (Tarran et al. 2006). In situ chlorophyll a concentrations were determined through fluorometric analysis of acetone-extracted pigments (Tilstone et al. 2009). Nutrient analysis was conducted using methods described in Grasshoff (1976) and Zhang & Chi (2002) for nitrate and phosphate respectively.
5
DNA extraction and bacterial identification
Triplicate DNA samples were collected by filtration of six litres of surface water through 0.22 µm Sterivex polyethersulfone filters (Millipore, Watford, UK) using a peristaltic pump. Filters were stored immediately at -80°C. A modified phenol:chloroform:isoamyl alcohol extraction method, as previously described in Neufeld et al. (2007), was used to extract DNA 10
from Sterivex filters. PCR amplification (32 cycles) was conducted on extracted DNA using 16S rRNA gene primers 341F (Muyzer et al. 1993) and 907R (Muyzer et al. 1998) with an annealing temperature of 55°C. PCR products were purified from agarose gels using the QIAquick gel extraction kit (Qiagen, Crawley, UK) before being sent to Molecular Research LP (MR DNA, www.mrdnalab.com) for 454 pyrosequencing using the GS-flx platform. 15
16S rRNA gene sequences were depleted of barcodes and primers, and then sequences less than 200 bp, with ambiguous bases or with homopolymer runs exceeding 6 bp were removed. Sequences were denoised and chimeras removed. After the removal of singleton sequences, operational taxonomic units (OTUs) were defined at 97% 16S rRNA gene identity using 20
Quantitative Insights Into Microbial Ecology (QIIME, http://qiime.org, Caporasa et al. 2010). OTUs were assigned taxonomically using BLASTn (Basic Local Alignment Search Tool, NCBI) against the Silva database (www.arb-silva.de). Sequences were randomly re-sampled to the lowest number of sequences per sample (816 sequences per DNA sample) to standardise the sequencing effort.
Data analysis
Spearman’s Rank Correlation Coefficients were calculated to investigate possible relationships between environmental parameters. Microbial methanol utilisation rates were compared to phylogenetic data of groups known to metabolise methanol (including SAR11 5
and Rhodobacterales) using partial Mantels’ tests (Mantel & Valand 1970) of Bray-Curtis matrices.
Results
Temporal variability of microbial methanol utilisation 10
Microbial rates of methanol oxidation to CO2 at station L4 (referered to as ‘dissimilation’, Figure 1) ranged between 0.7 and 11.2 nmol l-1 h-1 and were higher during autumn and winter (average 8.2 ± 2.2 nmol l-1 h-1, n = 8) compared to spring and summer (average 3.7 ± 2.3 nmol l-1 h-1, n = 14). Rates of microbial methanol assimilation (Figure 1) varied between 0.04 and 2.64 x 10⁻²nmol l-1 h-1 in surface waters from April 2011 to April 2012. These 15
assimilation rates were up to 1,000-fold lower than rates of methanol dissimilation, with an overall average rate of 0.67 ± 0.68 x 10⁻² nmol l-1 h-1 (n = 30). Methanol assimilation rates were on average higher between May and September (average of 1.10 ± 0.08 x 10⁻²nmol l-1 h-1,n = 13) and lower between October and April (0.30 ± 0.20 x 10⁻²nmol l-1 h-1, n = 14). Maxima of 2.64 x 10⁻² nmol l-1 h-1 and 2.23 x 10⁻² nmol l-1 h-1 were observed in August and 20
September, respectively.
and winter (Figure 1). Methanol assimilation rates correlated significantly with bacterial production rates (r = 0.420, n = 17, P < 0.05), numbers of heterotrophic bacteria (r = 0.762, n = 17, P < 0.01) and in particular the abundance of high nucleic acid containing bacteria (r = 0.755, n = 17, P < 0.01). In contrast, methanol dissimilation rates displayed a significant negative correlation with rates of bacterial productivity (r = -0.708, n = 17, P < 0.01).
5
Bacterial growth efficiency for methanol (BGEM)
The BGEM varied from <0.01 to 0.94% (Figure 2a) and generally showed a pattern of higher BGEM during spring and summer compared to winter months. The annual pattern in BGEM correlated with the numbers of heterotrophic bacterial (July 2011 to April 2012, r = 0.529, n 10
=17, P < 0.05, Figure 3a) and rates of bacterial productivity (r = 0.511, n = 17, P <0.05, Figure 2a). The proportion of methanol assimilated into biomass remained less than 1% throughout the year, which is in agreement with previously reported BGEM from the NE Atlantic (west of the Iberian Peninsula, Dixon & Nightingale 2012) and oligotrophic regions (Dixon et al. 2011b), but is much lower than previous measurements (12-57%) for productive 15
coastal upwelled and shelf waters (Dixon et al. 2011a, b, Dixon et al. 2013). The BGEM values reported in this study are also similar to results by Sun et al. (2011) who reported less than 6% of 14C-methanol assimilated by bacterioplankton populations in seawater incubations from the western Sargasso Sea. Cultivation studies have demonstrated negligible methanol assimilation in the SAR11 strain HTCC1062 (Sun et al. 2011), whilst the OM43 strain 20
HTCC2181 dissimilated 3.5 times more methanol than that assimilated in cultivated cells (Halsey et al. 2012).
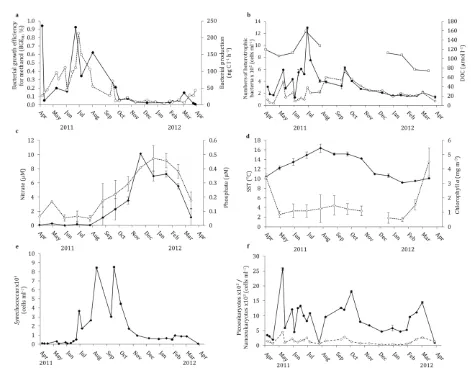
Total numbers of heterotrophic bacteria (Figure 3a) varied between 2.0 – 15.8 x 10⁵ cells ml-1 with maxima in May, July and September. The seasonal pattern and numbers of bacteria found in this study agreed well with those found at L4 in previous years (2.0 to 15.0 x 10⁵ cells ml-1, data from 1998 to 2001 and 2003 to 2004, Mary et al. 2006). Heterotrophic bacterial numbers were subdivided into high nucleic acid (HNA) bacteria and low nucleic 5
acid (LNA) bacteria, which ranged between 1.3 and 12.9 x 10⁵,and 0.3 –and 5.7 x 10⁵ cells ml-1, respectively (Figure 3a). Bacterial communities were dominated throughout the year by HNA bacteria (43 to 85%), which accounted for 81% of total numbers of bacteria during the July peak. Numbers of LNA bacteria were highest from July to September.
10
Measured rates of 3H-leucine incorporation at L4 varied between 2.6 and 137 pmol l-1 h-1 and were highest in July and lowest during January/February i.e. winter months (Figure 2a). Calculated bacterial production rates ranged from 4.1 to 212 ng C l-1 h-1 which are typical of this temperate coastal environment (Lamy et al. 2009). The highest rates of bacterial production were found between June and July (maximum 212 ng C l-1 h-1). Rates 15
subsequently decreased from July to September and remained low thoughout autumn and winter months (with an average of 18.1 ± 18.4 ng C l-1 h-1), with the exception of a relatively small maximum towards the end of September (70.3 ng C l-1 h-1). This coincided with a secondary autumnal phytoplankton bloom (chlorophyll a concentration of 1.95 mg m-3). Bacterial production rates in April 2012 were similar to those of April 2011, with an average 20
of 34.4 ± 8.0 ng C l-1 h-1.
Bacterial community composition
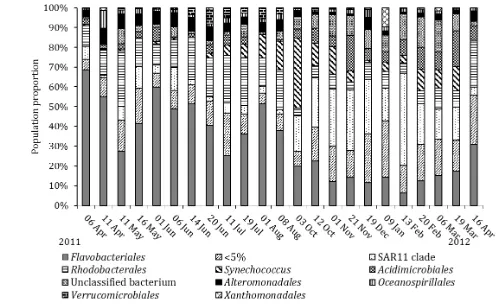
94% of the 16S rRNA gene sequences per sample (Figure 3b). Flavobacteriales represented 6 to 69% of the 16S rRNA gene sequences, dominating the bacterial community from April to August 2011. The SAR11 clade (Alphaproteobacteria, Giovannoni et al. 2005) was the second most numerically abundant bacterial order (1 to 46% relative abundance of 16S rRNA gene sequences), becoming more prevalent in the bacterial community from October to 5
March, reaching a maximum in February.
Spearman’s rank correlation coefficient was used to determine possible relationships between methanol utilisation and phylogenetic data of the microbial community. Significant correlations were identified between methanol dissimilation and numbers of Proteobacteria 10
(r = 0.513, n = 23, P < 0.02), as well as methanol assimilation and numbers of Verrucomicrobia (r = 0.461, n = 23, P < 0.02), however from this 16S rRNA sequence data
no known methylotrophic species could be identified within Verrucomicrobia. Rates of methanol dissimilation were further correlated with numbers of Alphaproteobacteria (r = 0.599, n = 23, P < 0.01) with no significant correlation found between Betaproteobacteria or 15
Gammaproteobacteria. Therefore, bacteria known to utilise methanol were identified and
selected from the bacterial community sequenced for further analysis. Sequence numbers of bacterial clade SAR11 significantly correlated with methanol dissimilation rates (r = 0.714, n = 23, P < 0.01, Figure 4a) during this seasonal study (April 2011 to April 2012). Rhodobacterales (Alphaproteobacteria) varied between 4 and 26% of 16S rRNA gene 20
sequences, following an opposing seasonal trend to SAR11 (Figure 4b) and contributed >15% to the total population sequenced from April to September. Numbers of Rhodobacterales 16S rRNA gene sequences were found to have a statistically significant
positive correlation with microbial methanol assimilation rates between June 2011 and March 2012 (r = 0.731, n = 16, P < 0.01).
Synechococcus (Cyanobacteria) varied from 0 and 36% of the 16S rRNA gene sequences and
were present in all but one sample between June and March (0.6 to 8.5 x 10⁴ cells ml-1, flow cytometry data Figure 2e, maximum of 36% during October) and almost absent April to June (<0.1 to 0.3 x 10⁴ cells ml-1, Figure 2e). No statistically significant relationship was found 5
between rates of methanol utilisation and numbers of picoeukaryotes or nanoeukaryotes (Figure 2f). Acidimicrobiales (Acidimicrobia) accounted for 0 to 18% of the 16S rRNA gene sequences of the bacterial community throughout the year, with sequence numbers higher during winter months. Unclassified bacteria varied between 1 and 16% of the 16S rRNA gene sequences per sample throughout the study: the fraction of these sequences was also 10
higher during winter months.
The number of operational taxonomic units (OTU) retrieved at Station L4 varied between 113 and 341 throughout the time-series, increasing from the minimum number of OTUs in July 2011 to the maximum in February 2012. The number of bacterial OTUs per sample 15
statistically correlated with corresponding total (dissimilation plus assimilation) methanol utilisation rates (r = 0.606, n = 16, P < 0.05).
Discussion
The patterns of methanol utilisation by microbes exhibited opposite seasonal trends, with 20
station, although a longer time series conducted over multiple years would be needed to confirm this.
Halsey et al. (2012) made measurements of methanol utilisation in natural coastal waters (Newport Harbour), estimating methanol dissimilation rates to be 0.40 µmol C per 1012 cells 5
h-1 (equating to 3.2 nmol l-1 h-1 using the bacterial count of concentrated seawater, 8 x 10⁶ cells ml-1) and methanol assimilation rates to be 0.35 µmol C per 1012 cells h-1 (equating to 2.8 nmol l-1 h-1 using the bacterial count of concentrated seawater, 8 x 10⁶ cells ml-1). The rate of methanol disimilation reported by Halsey et al. (2012) is within the range measured during this study. However, the rate of methanol assimilation is considerably higher than 10
reported from station L4, which could be a result of differences in the abundance of OM43 strain HTCC2181 between sampling sites. This strain was isolated from Newport Harbour and produced similar rates of methanol assimilation in culture to the natural seawater incubation (Halsey et al. 2012). Other marine microbes have been shown to assimilate methanol. The low abundance or activity of other methylotrophic bacteria within the 15
microbial community at station L4 could also result in the lower methanol assimilation rates observed. Only a single 16S rRNA sequence was identified as HTCC2181 within our data from station L4. It should be noted that filtering for bacterial community composition using 0.22 µm could have resulted in the loss of SAR11 and/or OM43 cells, which could help to explain the relatively low numbers of these groups in our data.
20
increased dominance of obligate methylotrophs which may be using a synergistic metabolic approach of utilising methanol for growth whilst simultaneously using other C1-compounds (part of the DOC pool) strictly as a source of energy, as previously suggested for OM43 strain HTCC2181 (Halsey et al. 2012). This metabolic strategy could also help explain why rates of microbial methanol assimilation, reported from highly productive upwelled waters of 5
coastal Mauritania (0.42 nmol l-1 h-1, Dixon et al. 2013), where elevated DOC substrates were available, were approximately 16 times higher than rates measured at station L4. Obligate methylotrophs may only use C1 compounds as both carbon and energy sources, whereas facultative methylotrophs may, under certain conditions, use multi-carbon substrates for growth whilst utilising C1 compounds for energy production (Chistoserdova 2011).
10
Methanol was predominately used as a source of energy (dissimilation), with less than 1% assimilated into biomass throughout the year at station L4. This is similar to previously measured BGEM in northern temperate and remote gyre waters of 1% (Dixon et al. 2013), but considerably lower than previous estimates from upwelling areas (12 to 57%, Dixon et al. 15
2013). This may be a result of the biogeochemical differences between these regions, for example differences in the availability of organic carbon substrates which is likely to impact the success of methylotrophic bacteria. The adoption of a synergistic approach could provide an advantage to those microbes, such as members of the HTCC2181 strain, over other obligate methylotrophs when methanol is less abundant.
20
methylotrophic community composition, from obligate to facultative methylotrophs where increased dominance of facultative methylotrophs during the winter months could result in increased methanol dissimilation rates if multi-carbon substrates are being used for growth.
A significant Spearman’s rank correlation found between the number of OTUs per sample 5
and total methanol utilisation (dissimilation and assimilation) rates suggests that temporal changes in the bacterial population assemblage may be linked to variations in methanol utilisation. This link could be due to the presence of methylotrophic microbial groups. Previous work has shown that bacterial species diversity is highest during winter in the western English Channel (Gilbert et al. 2012), and that activities of specific bacterial groups can
10
vary throughout the year, particularly in summer when inorganic nutrients can be more limiting
(Alonso-Sáez & Gasol 2007). Methylotrophic bacteria were tentatively quantified from the bacterial community sequence data using 16S rRNA gene sequences from known methylotrophic species but were found to be numerically rare (e.g. Methylophaga thiooxidans DMS010, Boden et al. 2010, Neufeld et al. 2007, Schäfer 2007). The successful design of 15
new primer sets targeting xoxF (Taubert et al. 2015) an alternative methanol dehydrogenase like XoxF (Giovannoni et al. 2008, Wilson et al. 2008) will enable future studies to investigate the prevalence and role of xoxF at station L4.
A correlative approach, using 16S rRNA pyrosequencing data and rate measurements of 20
genomes (Giovannoni et al. 2008, Sun et al. 2011), SAR11 cells have been shown to possess an iron-containing alcohol dehydrogenase (Fe-ADH) which Sun et al. (2011) propose may be capable of oxidising methanol and other short chain alcohols.
Although no statistically significant correlation between methanol assimilation and numbers 5
of Rhodobacterales 16S rRNA gene sequences was found during the complete sampling period (April 2011 to April 2012), these measurements do appear to follow a similar overall seasonal trend. When the analysis is confined to using values from June 2011 to March 2012, a statistically significant correlation is found, suggesting that Rhodobacterales may be contributing to rates of microbial methanol assimilation into cell biomass, at least in some 10
circumstances (Wilson et al. 2008, Chen 2012). The trend is not as clear during the period from April to June 2011 which could reflect the uncharacteristic environmental conditions experienced at Station L4 in early 2011 (Spring 2011 was exceptionally warm and dry, with increased light levels), although it is plausible that from April to June 2011 other methylotrophic bacteria are dominating methanol assimilation. Members of the 15
Rhodobacterales have been shown to metabolise methanol: for example, Rhodobacter
sphaeroides possesses a xoxF gene (Wilson et al. 2008) which has also been identified in 40
genomes of the marine Roseobacter clade (Chen 2012). Newly designed primers targeting xoxF have demonstrated the widespread presence of this gene in coastal waters, including
station L4 where some of the most abundant xoxF sequences detected were related to xoxF of 20
Rhodobacterales cells at L4 are actively expressing methanol utilisation genes and their
cognate proteins.
Previous studies of the microbial community at L4 have shown that both SAR11 and Rhodobacterales represent the most abundant 16S rRNA genes (Gilbert et al. 2012), with 5
SAR11 peaking during winter (at 46% relative abundance) and representing on average 13% of the bacterial community (Mary et al. 2006). A metaproteomic study of a coastal upwelling system found 36% of proteins detected to be best matched to proteins of SAR11 and 17% to proteins from strains in the Roseobacter clade (Sowell et al. 2010). Therefore, the extent to which SAR11 and Rhodobacterales dominate the bacterial community composition could 10
significantly influence the temporal variability observed in methanol dissimilation and assimilation rates at station L4. Strains of Flavobacterium have also been shown to grow on methanol (Moosvi et al. 2005, Boden et al. 2008), or to contain mxaF (Madhaiyan et al. 2010). However, numbers of Flavobacterium 16S rRNA gene sequences did not correlate with the seasonal trends for microbial methanol utilisation.
15
Overall, these results suggest that at Station L4 methylotrophic bacteria with alternative methanol oxidation enzymes other than MxaFI may be largely responsible for methanol dissimilation. Stable Isotope Probing experiments using 13C-methanol have provided valuable insights into active methanol-assimilating microbes (Neufeld et al. 2007, Grob et al. 20
diversity of methylotrophs using a combined approach of functional gene probes alongside process measurements. The use of RNA sequencing and environmental proteomics would also enable the identification of active enzymes involved in C1 metabolism in the marine environment. A combined approach that included both the identification and quantification of the activity of methanol dissimilating bacteria in the marine environment is required to 5
understand the controls on microbial methanol utilisation in coastal waters and identify key microbial players in the marine cycling of methanol.
Conclusions
This research provides the first fully resolved seasonal study of microbial methanol uptake 10
dynamics combined with molecular characterization of the bacterial community. We show that microbial methanol dissimilation (higher throughout winter) and microbial methanol assimilation (higher during summer) exhibit opposing seasonal patterns. Overall <1% of the total methanol utilised was assimilated into cell carbon. Temporal trends in the utilisation of methanol suggest that the composition of the methanol-utilising community changes 15
throughout a yearly cycle, with methanol being used as an alternative source of energy and/or carbon during times of increased competition for other preferred sources of carbon. Statistically significant correlations implicate SAR11 and Rhodobacterales in the dissimilation and assimilation of methanol at Station L4, respectively. Further research should use a combined approach of RNA sequencing, environmental proteomics and 20
functional gene probes (mxaF and xoxF), together with process measurements, to explore active methanol utilisation and identify key players in the marine cycling of methanol.
Acknowledgements
We thank Denise Cummings, other scientists and the crew of the Quest who sample on behalf of the Western Channel Observatory (WCO, www.westernchannelobservatory.org.uk). We thank G. Tarran for the flow cytometry data which are provided by the Plymouth Marine Laboratory, Western Channel Observatory (www.westernchannelobservatory.org.uk). We 5
also thank Michael Cunliffe, Yin Chen and Karen Tait for advice with molecular work. This work was funded by NERC and the Earth and Life Systems Alliance, Norwich Research Park.
Conflict of Interest Statement 10
The Authors declare no conflict of interest with this manuscript.
References
Alonso-Sáez L, Gasol J (2007) Seasonal variations in the contributions of different bacterial groups to the uptake of low-molecular-weight compounds in northwestern 15
Mediterranean coastal waters. Applied and Environmental Microbiology 73:3528-3535
Beale R, Dixon J, Arnold S, Liss P, Nightingale P (2013) Methanol, acetaldehyde, and acetone in the surface waters of the Atlantic Ocean. Journal of Geophysical Research: Oceans 118:5412-5425
20
Beale R, Dixon JL, Smyth TJ, Nightingale PD (2015) Annual study of oxygenated volatile organic compounds in UK shelf waters. Marine Chemistry 171:96-106
Boden R, Kelly D, Murrell J, Schafer H (2010) Oxidation of dimethylsulfide to tetrathionate by Methylophaga thiooxidans sp. nov.: a new link in the sulfur cycle. Environmental Microbiology 12:2688-2699
25
Boden R, Thomas E, Savani P, Kelly DP, Wood AP (2008) Novel methylotrophic bacteria isolated from the River Thames (London, UK). Environmental Microbiology 10:3225-3236
Caporasa JG, Kuczynski J, Stombaugh J, Bittinger K and others (2010) QIIME allows analysis of high-throughput community sequencing data. Nature Methods 7:335-336 30
Chen Y (2012) Comparative genomics of methylated amine utilization by marine Roseobacter clade bacteria and development of functional gene markers (tmm, gmaS). Environmental Microbiology 14:2308-2322
Chistoserdova L (2011) Modularity of methylotrophy, revisited. Environmental Microbiology 13:2603-2622
35
Dixon JL, Beale R, Nightingale PD (2011a) Microbial methanol uptake in northeast Atlantic waters. The ISME Journal 5:704 - 716
Dixon JL, Beale R, Nightingale PD (2011b) Rapid biological oxidation of methanol in the tropical Atlantic: significance as a microbial carbon source. Biogeosciences 8:2707-2716
5
Dixon JL, Nightingale PD (2012) Fine scale variability in methanol uptake and oxidation in the micro-layer and near-surface waters of the Atlantic. Biogeosciences 9:2961-2972 Dixon JL, Sargeant S, Nightingale PD, Murrell JC (2013) Gradients in microbial methanol
uptake: productive coastal upwelling waters to oligotrophic gyres in the Atlantic Ocean. The ISME Journal 7:568-580
10
Duncan B, Logan J (2008) Model analysis of the factors regulating the trends and variability of carbon monoxide between 1988 and 1997. Atmospheric Chemistry and Physics 8:7389-7403
Felix JD, Jones SB, Avery GB, Willey JD, Mead RN, Kieber RJ (2014) Temporal and spatial variations in rainwater methanol. Atmospheric Chemistry and Physics Discussions 15
14:1375 - 1398
Galbally I, Kirstine W (2002) The production of methanol by flowering plants and the global cycle of methanol. Journal of Atmospheric Chemistry 43:195-229
Gilbert JA, Steele JA, Caporaso JG, Steinbruck L and others (2012) Defining seasonal marine microbial community dynamics. The ISME Journal 6:298-308
20
Giovannoni SJ, Hayakawa DH, Tripp HJ, Stingl U and others (2008) The small genome of an abundant coastal ocean methylotroph. Environmental Microbiology 10:1771 - 1782 Giovannoni SJ, Tripp HJ, Givan S, Podar M and others (2005) Genome streamlining in a
cosmopolitan oceanic bacterium. Science 309:1242-1245
Grasshoff K (1976) Methods of seawater analysis, Vol, Weinheim, Germany 25
Grob C, Taubert M, Howat AM, Burns OJ and others (2015) Combining metagenomics with metaproteomics and stable isotope probing reveals metabolic pathways used by a naturally occuring marine methylotroph. Environmental Microbiology 17:4007-4018 Halsey KH, Carter AE, Giovannoni SJ (2012) Synergistic metabolism of a broad range of C1
compounds in the marine methylotrophic bacterium HTCC2181. Environmental 30
Microbiology 14:630-640
Harris R (2010) The L4 time-series: the first 20 years. Journal of Plankton Research 32:577-583
Heikes B, Chang W, Pilson M, Swift E and others (2002) Atmospheric methanol budget and ocean implication. Global Biogeochemical Cycles 16:1133
35
Kameyama S, Tanimoto H, Inomata S, Tsunogai U and others (2010) High-resolution measurement of multiple volatile organic compounds dissolved in seawater using equilibrator inlet–proton transfer reaction-mass spectrometry (EI–PTR-MS). Marine Chemistry 122:59-73
Kolb S (2009) Aerobic methanol-oxidising bacteria in soil. FEMS Microbiology Letters 1 - 40
10
Laghdass M, Catala P, Caparros J, Oriol L, Lebaron P, Obernosterer I (2012) High contribution of SAR11 to microbial activity in the north west Mediterranean Sea. Microbial Ecology 63:324 - 333
Lamy D, Obernosterer I, Laghdass M, Artigas L and others (2009) Temporal changes of 45
Madhaiyan M, Poonguzhali S, Lee JS, Lee KC, Sundaram S (2010) Flavobacterium glycines sp. nov., a facultative methylotroph isolated from the rhizosphere of soybean. International Journal of Systematic and Evolutionary Microbiology 60:2187-2192 Mantel N, Valand RS (1970) A technique of nonparametric multivariate analysis. Biometrics
26:547-558 5
Mary I, Cummings D, Biegala I, Burkill P, Archer S, Zubkov M (2006) Seasonal dynamics of bacterioplankton community structure at a coastal station in the western English Channel. Aquatic Microbial Ecology 42:119-126
McDonald IR, Murrell JC (1997) The methanol dehydrogenase structual gene mxaF and its use as a functional gene probe for methanotrophs and methylotrophs. Applied and 10
Environmental Microbiology 63:3218-3224
Millet D, Jacob D, Turquety S, Hudman R and others (2006) Formaldehyde distribution over North America: Implications for satellite retrievals of formaldehyde columns and isoprene emission. Journal of Geophysical Research: Atmospheres 111:2156-2202 Moosvi SA, McDonald IR, Pearce DA, Kelly DP, Wood AP (2005) Molecular detection and 15
isolation from Antarctica of methylotrophic bacteria able to grow with methylated sulfur compounds. Systematic and Applied Microbiology 28:541-554
Muyzer G, Brinkhoff T, Nubel U, Santegoeds C, Schäfer H, Waver C (1998) Denaturing gradient gel electrophoresis (DGGE) in microbial ecology. In: van Elsas JD, de Bruijn FJ (eds) Molecular Microbial Ecology Manual. Kluwer Academic Publishers, 20
Dordrecht, The Netherlands, p 1–27
Muyzer G, De Waal EC, Uitierlinden AG (1993) Profiling of complex microbial populations by Denaturing Gradient Gel Electrophoresis analysis of Polymerase Chain Reaction-amplified genes coding for 16S rRNA. Applied and Environmental Microbiology 59:695-700
25
Neufeld JD, Chen Y, Dumont MG, Murrell JC (2008) Marine methylotrophs revealed by stable-isotope probing, multiple displacement amplification and metagenomics. Environmental Microbiology 10:1526-1535
Neufeld JD, Schafer H, Cox MJ, Boden R, McDonald IR, Murrell JC (2007) Stable-isotope probing implicates Methylophaga spp and novel Gammaproteobacteria in marine 30
methanol and methylamine metabolism. The ISME Journal 1:480 - 491
Schäfer H (2007) Isolation of Methylophaga spp. from marine dimethylsulfide-degrading enrichment cultures and identification of polypeptides induced during growth on dimethylsulfide. Applied and Environmental Microbiology 73:2580-2591
Schmidt S, Christen P, Kiefer P, Vorholt JA (2010) Functional investigation of methanol 35
dehydrogenase-like protein XoxF in Methylobacterium extorquens AM1. Microbiology 156:2575-2586
Simon M, Azam F (1989) Protein content and protein synthesis rates of planktonic marine bacteria. Marine Ecology Progress Series 51:201 - 213
Singh H, Chen Y, Staudt A, Jacob D, Blake D, Heikes B, Snow J (2001) Evidence from the 40
Pacific troposphere for large Gloabal sources of oxygentated organic compounds. Nature 410:1078 - 1081
Singh H, Tabazadeh A, Evans M, Field B and others (2003) Oxygenated volatile organic chemicals in the oceans: Inferences and implications based on atmospheric observations and air-sea exchange models. Geophysical Research Letters 30:1-5 45
Smith DC, Azam F (1992) A simple, economical method for measuring bacterial protein synthesis rates in seawater using 3H-leucine. Marine Microbial Food Webs 6:107-114 Smyth T, Fishwick J, Lisa A-M, Cummings DG and others (2010) A broad spatio-temporal
view of the western English Channel Observatory. Journal of Plankton Research 32:585-601
Sowell SM, Abraham PE, Shah M, Verberkmoes NC, Smith DP, Barofsky DF, Giovannoni SJ (2010) Environmental proteomics of microbial plankton in a highly productive coastal upwelling system. The ISME Journal 5:856-865
Sun J, Steindler L, Thrash JC, Halsey KH and others (2011) One carbon metabolism in SAR11 pelagic marine bacteria. PLOS One 6:23973
5
Tarran GA, Heywood JL, Zubkov MV (2006) Latitudinal changes in the standing stocks of nano-and picoeukaryotic phytoplankton in the Atlantic Ocean. Deep Sea Research Part II: Topical Studies in Oceanography 53:1516 - 1529
Taubert M, Grob C, Howat AM, Burns OJ, Dixon JL, Chen Y, Murrell JC (2015) xoxF encoding an alternative methanol dehydrogenase is widespread in coastal marine 10
environments. Environmental Microbiology 17:3937-3948
Tilstone G, Smyth T, A. P, Hutson R (2009) Measured and remotely sensed estimates of primary production in the Atlantic Ocean from 1998 to 2005. Deep-Sea Research II 56:918-930
Williams J, Holzinger R, Gros V, Xu X, Atlas E, Wallace D (2004) Measurements of organic 15
species in air and seawater from the tropical Atlantic. Geophysical Research Letters 31
Wilson SM, Gleisten MP, Donohue TJ (2008) Identification of proteins involved in formaldehyde metabolism by Rhodobacter sphaeroides. Microbiology 154:296-305 Yang M, Beale R, Liss P, Johnson M, Blomquist B, Nightingale PD (2014a) Air-sea fluxes of 20
oxygenated volatile organic compounds accross the Atlantic Ocean. Atmospheric Chemistry and Physics 14:7499-7517
Yang M, Blomqvist B, Nightingale PD (2014b) Air-sea exchange of methanol and acetone during HiWinGS: Estimation of air phase, water phase gas transfer velocities. Journal of Geophysical Research 119:7308-7323
25
Yang M, Nightingale P, Beale R, Liss P, Blomquist B, Fairall C (2013) Atmospheric deposition of methanol over the Atlantic Ocean. Proceedings of the National Academy of Sciences USA 110:20034 - 20039
Zhang J, Chi J (2002) Automated analysis of nanomolar concentrations of phosphate in natural waters with liquid waveguides. Environmental science and technology 30
36:1048-1053
35
Titles and legends to figures
Figure 1. Temporal variability in microbial rates of methanol uptake: dissimilation (white circles) and assimilation (black circles) form April 2011 to April 2012 in surface waters at station L4. Shaded areas show the seasons. Error bars denote ± 1 SD of three replicates. 5
Figure 2. Temporal variability between April 2011 and April 2012 at station L4 in (a) bacterial growth efficiency for methanol (BGEM, black circles), rates of bacterial production (white squares), (b) numbers of heterotrophic bacteria, divided into high nucleic acid (HNA, black circles) and low nucleic acid (LNA, white circles), and dissolved organic carbon 10
(DOC) concentrations (white squares). Error bars denote ±1 SD of three replicates. Monthly averages of (c) nitrate (black diamonds) and phosphate (white diamonds) concentrations, (d) sea surface temperatures (black diamonds) and chlorophyll a concentrations (white diamonds). Error bars represent ±1 SD of monthly values. Numbers of (e) Synechococcus, (f) picoeukaryotes (black diamonds) and nanoeukaryotes (white diamonds). Error bars 15
denote ±1 SD of three replicates.
Figure 3. Bacterial community composition (identified using 16S rRNA gene sequencing) at station L4 at the order level. Analysis is based on a rarefied sample of 816 sequences per sample. Bacterial orders individually contributing to less than 5% of the total sample 20
sequences were pooled together into ‘Others (<5%)’ for clarity.
Figure 4. Comparison between the temporal variability of microbial methanol (a) dissimilation (white circles) with the sequence abundance of the SAR 11 clade (white bars) and (b) assimilation (black circles) with the sequence abundance of Rhodobacterales (shaded 25
Figure 1.
5
10
15
20
25
Figure 2.
5
Figure 3.
5
10
15
20
Figure 4.