USING REMOTE SENSING TO CALCULATE PLANT AVAILABLE NITROGEN FROM INDUSTRIAL HOG CAFOS IN NORTH CAROLINA AT THE SPRAYFIELD AND SUB-WATERSHED SCALES
Elizabeth Christenson
A thesis submitted to the faculty at the University of North Carolina at Chapel Hill in partial fulfillment of the requirements for the degree of Master of Science in the Department of Environmental
Sciences & Engineering in the Gillings School of Global Public Health.
Chapel Hill 2015
Approved by:
Marc Serre Jill Stewart Stephen Whalen
ii
© 2015 Elizabeth Christenson ALL RIGHTS RESERVED
iii ABSTRACT
Elizabeth Christenson: Using remote sensing to calculate plant available nitrogen from industrial hog CAFOs in North Carolina at the sprayfield and sub-watershed scales
(Under the direction of Marc Serre)
Duplin county, NC has the highest hog-population density of any county in the United States. Liquid manure from industrial-sized hog concentrated animal feeding operations (CAFOs) is stored in open-air lagoons and sprayed onto sprayfields as fertilizer. Hog CAFOs are regulated by the NC Department of Environment and Natural Resources (DENR) based on their ability to have nutrient management plans (NMPs) that have balanced plant available nitrogen (PAN) so that the estimated portion of nitrogen that remains available for crops to use after irrigation is absorbed. Objectives of this research are to quantify the difference in permitted PAN between CAFO point and sprayfield area locations at two sub-
watershed scales in Duplin county by conducting a review of all 485 active CAFOs and creating a
sprayfield spatial database. Second, a new method incorporating remote sensing data identifies annual PAN for crops on sprayfields and two sub-watershed scales in Duplin county between 2010-2014.
iv
To those of you who convinced me to return to graduate school:
my late friend and colleague Ovik Banerjee, my long-time mentor Professor William Gray,
and my church.
“Do unto those downstream as you would have those upstream do unto you.”
-Wendell Berry
v
ACKNOWLEDGEMENTS
I would like to thank everyone who contributed or believed that a sprayfield spatial database was even possible to create including my adviser Dr. Marc Serre and committee members Dr. Jill Stewart and Dr.
Stephen Whalen, staff members at the NC DENR Christine Lawson, JR Joshi, Miressa Garoma, and Karen Prather for logistical considerations while scanning NMPs, Dr. David Crouse at NC State University for extensive technical help regarding nutrient management plan creation and plant available nitrogen calculations, all of the unpaid volunteers of the Nutrient Management Plan Team including Emma Armstrong-Carter, Graysen Boles, Jack Cordes, Christina DeStefano, Jean Lin, Addison McGee, Joel McMath, Melanie Napier, Stephanie Phelps, Jessica Rinsky, Justine Santos, Patrick Stovall, Nirali Shah, Whitney Yaniero, Joe Ye Zhou, Nate Ziegl, and. Funding for my graduate school research for this thesis was given by the American Association of University Women and as part of the NSF grant 1316318 as part of the joint NSF-NIH-USDA Ecology and Evolution of Infectious Diseases program.
vi
TABLE OF CONTENTS
LIST OF TABLES ... vii
LIST OF FIGURES ... viii
LIST OF ABBREVIATIONS ... ix
CHAPTER 1: INTRODUCTION ... 1
Nutrient Management Plans ... 2
Objectives ... 3
CHAPTER 2: METHODS ... 5
Permitted Data ... 6
Data Sources: CAFO point locations... 6
Data Sources: creating sprayfield location ... 7
Data sources: creating the NMP database ... 9
Remote Sensing Data ... 13
Sub-Watershed Aggregation ... 17
CHAPTER 3: RESULTS ... 18
Characterization of Duplin county NMPs ... 18
Comparing CAFO Point to Sprayfield ... 18
Remote Sensing Approach ... 22
CHAPTER 4: DISCUSSION ... 27
CHAPTER 5: FUTURE WORK... 30
APPENDIX 1: SUPPLEMENTAL INFORMATION ... 32
REFERENCES... 33
vii LIST OF TABLES
Table 1: Average PANspray for anaerobic lagoon liquid in broadcast or irrigated systems
by type of swine in NC. Adapted from Crouse et al. 2014 ... 12 Table 2: Descriptive information regarding CAFO characteristics at different spatial scales
based on location of CAFO point. . ... 22 Table 3: Comparison of PANspray, PANcrops, and PANbal using CDLs for 2010-2014
and reported NMP values at the point locations ... 23
viii LIST OF FIGURES
Figure 1: All 2015 CAFOs permitted by DENR in NC with an inset of the study
area, Duplin county ... 5 Figure 2: Example of multiple sprinklers in an NMP combined and delineated as
one physical sprayfield ... 8 Figure 3: Data sources for sprayfield delination. ... 9 Figure 4: Cropland data layer identified crops on sprayfields for years 2008-2014
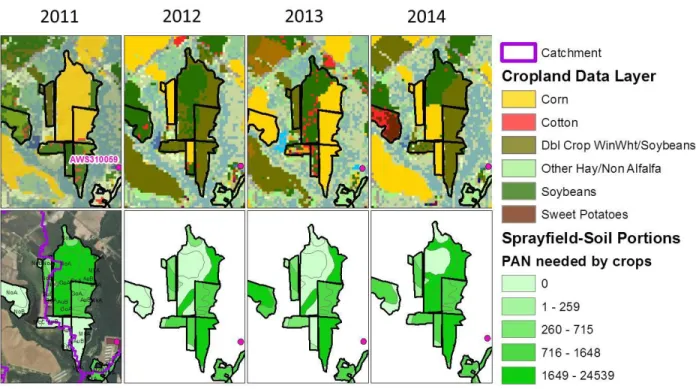
in Duplin county... 15 Figure 5: Identified crops using remote sensing CDLs between 2011 and 2014 and
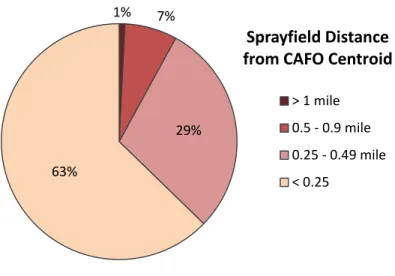
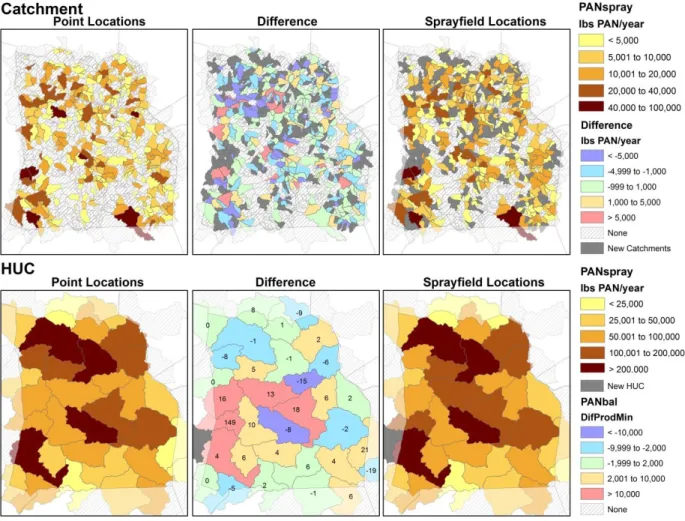
corresponding calculated PANcrops for soil-sprayfield portions of a CAFO .. ... 16 Figure 6: Proportion of Duplin sprayfield distances from CAFO centroid ... 19 Figure 7: Comparing PANsprayat the catchment and HUC12 sub-watershed levels
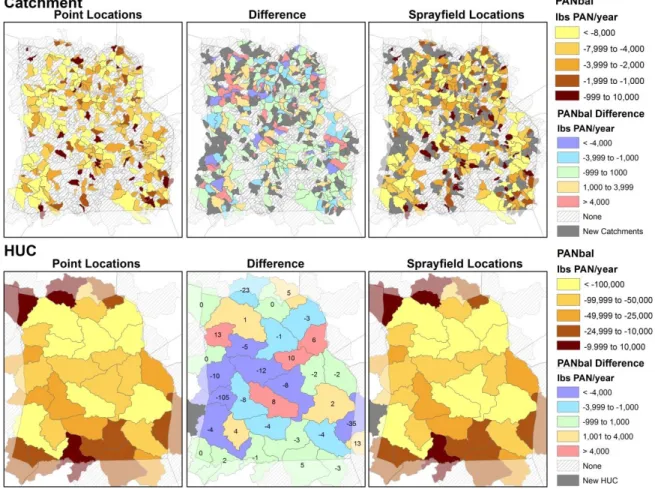
using point vs. sprayfield locations and permitted data. ... 20 Figure 8: Comparing PANbal at the catchment and HUC12 sub-watershed levels
using point vs. sprayfield locations and permitted data. ... 21 Figure 9: Catchment sub-watershed changes over time in PANspray, PANcrops,
and PANbal. Remote sensing was used to determine PANcrops. ... 24 Figure 10: HUC12 sub-watershed changes over time in PANspray, PANcrops, and
PANbal. Remote sensing was used to determine PANcrops. ... 25 Figure 11: Maximum range in PANcrops for CDL-identified crops for sprayfields
aggregated for two sub-watershed scales in Duplin county between 2010
and 2014 ... 26
ix
LIST OF ABBREVIATIONS
CAFOs Concentrated Animal Feeding Operations CDL Cropland Data Layer
DENR Department of Environment and Natural Resources NAIP National Agriculture Imagery Program
NC North Carolina
NMPs Nutrient Management Plans PAN Plant Available Nitrogen
PANcrops Plant Available Nitrogen needed by crops
PANspray Plant Available Nitrogen sprayed onto sprayfields PANbal Plant Available Nitrogen balance
RYE Realistic Yield Estimate
1
CHAPTER 1: INTRODUCTION
Swine industrial animal operations are of concern to public and environmental health (Wing et al.
2000) due to their effects surface water and groundwater quality (including private wells) for nutrient, pathogen, antibiotic, pesticide, and heavy metal loads as well as pathogen and algal growth (Burkholder et al. 2007; Hribar 2010; Messier et al. 2014). Industrial sized swine operations, termed concentrated animal feeding operations (CAFOs) have centralized, large volumes of swine waste (i.e. liquid effluent), generally stored in open air lagoons and sprayed as fertilizer for crops onto sprayfields. Specific, acute instances of swine CAFO effects on water quality include lagoon ruptures and breaks during extreme weather events such as during hurricanes, but also chronic water quality impacts such as nutrients carried offsite from sprayfields as runoff to nearby surface water from normal rain events (Mallin and Cahoon 2003). To protect water quality, liquid effluent is not permitted to be sprayed before rain events or when soils are saturated. However, elevated nutrients in surface water are found from lagoon seepage and surface runoff from sprayfields even when liquid effluent is applied at recommended application rates,(Burkholder et al. 2007). A decade-long analysis of nutrients in surface water found evidence that improvements in nutrient management have been offset by anthropogenic nutrient input, especially swine production (Burkholder et al. 2006).
NC is the second largest hog-producing state in the United States with 90% of swine CAFOs having 1000 swine or more. Duplin and neighboring Sampson county have the top two most densely hog- populated counties in the United States each having 2116 and 1963 hogs per square mile, respectively (USDA National Agricultural Statistics Service 2012a). Swine production in NC rapidly shifted to CAFOs in
2
the 1980s as the number of swine farms decreased by 62% while the number of hogs produced increased by 109% between 1982 and 1992 (Furuseth 1997). Furuseth provides well documented observations of the political, economic, and cultural climate that precipitated the transformation to industrial hog CAFOs in NC. With increasing swine production in the 1980s, regulation was minimal with swine CAFOs exempt from zoning laws. Lagoon construction was first regulated in 1993 with new lagoons required to have lining to prevent leaching into the groundwater (Burkholder et al. 1997). The consolidation of hog farms coupled with increased hog production continued until 1997 when a moratorium on new swine CAFOs was enacted. The moratorium became permanent on general swine CAFO permits in 2007 with the Swine Farm Environmental Performance Standards Act banning
construction of new, open air anaerobic lagoons and requiring any new swine CAFOs to have innovative or “environmentally superior technologies” (Nicole 2013) such as covered lagoon systems.
Nutrient Management Plans
Current environmental safeguards for swine CAFOs are based around nutrient and heavy metal regulation and are conducted based on NC public law 626 (1995) that created the swine permitting system in NC as well as an interagency guidance committee to provide assistance for creation of nutrient management plans (NMPs) for swine CAFO owners. The interagency guidance committee publishes
“uniform interpretation … regarding the requirements of the animal waste management rules,” with its most recent guidelines in 2009 (Hardee et al. 2009). Swine CAFOs are not regulated for any microbial or pathogen load. The Animal Operations unit of the Water Resources division of North Carolina’s
Department of Environment and Natural Resources (DENR) currently regulates permitting of swine CAFOs and requires NMPs for each swine CAFO with a swine CAFO having 250 or more swine.
NC DENR regulates NMPs based on their having balanced plant available nitrogen (PAN) as well as ensuring phosphorus and heavy metal build up in soil does not occur. Balanced PAN theoretically ensures that nitrogen in the liquid effluent is not over-applied onto sprayfield crops. PANspray is the
3
estimated portion of total nitrogen content of swine manure that remains available for crops to use after spraying the liquid effluent onto the sprayfield. For balanced PAN (PANbal) and for compliance with DENR, the estimated annual PANspray must be less than the estimated annual PAN utilized by crops grown on sprayfields (PANcrops). DENR reviews NMPs every five years to confirm that each CAFO has balanced PAN plans. NMPs are not required to be revised unless crop modification changes 25% of the PAN (Hardee et al. 2009). As such, many NMPs are not revised and re-submitted every five year permitting cycle. All NMPs contain data on the amount of PANspray and CAFO-level PANbal as well as field-specific data on crops grown and PANcrops, in addition to application rates, soil types, maps and other spatial information regarding location of swine CAFO sprayfields.
Objectives
Although NMPs are a rich data source, there exist regulatory, accessibility, and technical barriers for their use for water quality management and regulatory evaluation at the watershed scale. NMPs are technically publically available but they are not readily accessible or politically stable. Regulatory barriers include permit review timeframe, public record request protocol, and proposed legislation.
Because NMPs are re-submitted every five years, permits are typically housed in DENR’s Central Office Files, and public access requires a staff member to take time to travel to the basement, identify individual animal waste permit files, and deliver them to the person requesting public records.
Additionally, extensive public records requests are subject to fees, and in May 2014, although not passed into law, Senate Bill 762 (2014) proposed that aerial photographs and locations of CAFOs be removed from public record.
Readily accessible data on NC swine CAFOs include point latitude/longitude, number and type of permitted animals, CAFO owner and address, CAFO name and address, and type of permit available from DENR all available online (NC Department of Environment and Natural Resources 2015). Because watershed boundaries may divide a CAFO’s sprayfields among different watersheds, knowing the
4
sprayfield location improves currently known CAFO locational information, which only identifies the CAFO point latitude/longitude of the swine operation. Although NMPs have field-specific data, they do not aggregate PAN data at the watershed level. Identifying watersheds with large volumes of liquid effluent production or high PANspray and high PANbal may be beneficial to target water quality monitoring of swine CAFOs since
Finally, NMPs are unable to disaggregate PANbal by calendar year because NMPs provide multiple approved crop options or rotations throughout the five year permitting process. Remote sensing, however, can be used to identify crops grown on sprayfields for a given calendar year and used to identify PANbal annually.
Objectives of this research are first to quantify the difference in PANspray and PANbal between CAFO point and sprayfield area locations at two sub-watershed spatial scales in Duplin county, NC, the most densely hog-populated county in the United States (USDA National Agricultural Statistics Service 2012a). In doing so, a review of all NMP permits in Duplin county was conducted, the first and open source sprayfield spatial database created for swine CAFOs in NC, and summarized descriptive
characteristics of Duplin county NMPs are presented. Second, a new method was developed to identify PANcropsand PANbal on sprayfields using annual remotely sensed crop data to re-calculate PANbal on sprayfields over five years (2010-2014). PAN calculation methods using permit data and remote sensing data are compared.
5
CHAPTER 2: METHODS
Three methods of calculating PANbal are presented. Two use permitted NMP data and compare CAFO point and sprayfield locations aggregated at two watershed scales. Then, using sprayfield
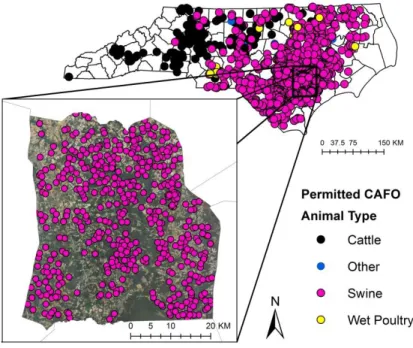
locations, remote sensing identifies crop data to calculate PANbal. Figure 1 displays all CAFOs in NC with an inset of the study area, Duplin county, and identifies swine CAFOs primarily in eastern NC and cattle CAFOs primarily in the west. Point locations of CAFOs regulated by DENR are publically available online (NC Department of Environment and Natural Resources 2015). DENR does not regulate dry poultry operations and these facility locations are not publically available.
Figure 1: All 2015 CAFOs permitted by DENR in NC with an inset of the study area, Duplin county
6 Permitted Data
To compare CAFO point to sprayfield areas, a spatial database identifying sprayfield areas and corresponding crop and nutrient application parameters was needed to improve estimation of permitted nutrient application at the watershed level.
All Duplin county NMPs from the Animal Operations unit of DENR in Raleigh, NC were converted into electronic files using hand scanners, data pertaining to sprayfield application of PAN and liquid swine effluent standardized and entered into a database, and NMP maps compared to orthoimagery to delineate sprayfields.
Data Sources: CAFO point locations
Point locations for swine CAFOs are based on the 2015 updated list of permitted swine operations available from NC DENR’s website for facilities with more than 250 permitted swine (NC Department of Environment and Natural Resources 2015). Swine CAFOs have three types of permits: animal waste swine (AWS), animal waste individual (AWI), and the federal National Pollutant Discharge Elimination System (NPDES) permit for North Carolina Animals (NCA). Of 492 unique facilities, 483 are AWS, 7 are AWI, and 2 are NCA. A total of seven facilities were removed from this analysis because one AWS facility is not yet built, three AWI permits double as AWS permits, two AWI are zero-animal and have lagoons but no longer have permitted animals, and one AWI is a livestock market with no active sprayfields.
Waste management systems for zero-animal facilities were not found and are not included in this analysis. Thus in Duplin county, there are 485 permitted active swine CAFOs in 2015.
All point locations were manually reviewed by comparing the DENR-provided latitude and longitude location with NMP maps and satellite imagery to ensure correct identification of facilities. The
latitude/longitude points were re-assigned to the centroid of lagoon locations, for the instance in which
7
a swine CAFO had more than one lagoon, or between the hog houses and the lagoon, for the instance in which the swine CAFO had one lagoon.
Data Sources: creating sprayfield location
DENR requires that NMPs identify the acreage used for sprayfields and provide maps identifying sprayfield location. Although maps are required, many NMPs omitted maps entirely or had poor quality sprayfield identification. Sprayfield delineation was implemented in ArcGIS 10.1 (ESRI 2011). Each delineated sprayfield is linked to the NMP data.
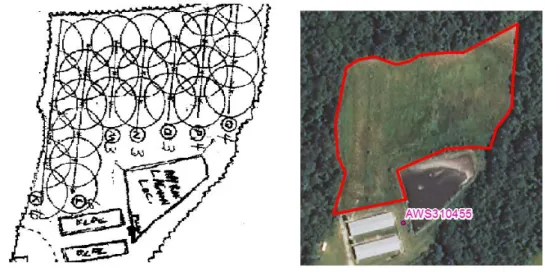
NMP maps are of varying quality ranging from satellite imagery with explicitly identified sprinkler pulls to land surveys from contractors to county land parcel maps from the mid to late 1990s to hand- drawn scrawls. NMP maps were compared to USDA National Agriculture Imagery Program (NAIP) high resolution aerial photographs or “orthoimagery” to identify and delineate sprayfields (USDA FSA Aerial Photography Field Office 2012). The NMPs have varied units of analysis for where lagoon effluent is sprayed including type of waste irrigation structure (e.g. hydrant, sprinkler, pull, or pivot), field, and sometimes tract. For every unit of analysis, NMPs identify PANcrops. Instead of delineating specific irrigation structures (e.g. delineating a specific sprinkler radius for a given field), sprayfields were delineated based on the physical sprayfield as seen in NAIP. For example, as in Figure 2, if seven sprinklers (left) from the NMP corresponded to the same physical sprayfield (right) growing corn, the seven sprinklers would be combined as one physical sprayfield with delineated sprayfield.
8
Figure 2: Example of multiple sprinklers in an NMP (left) combined and delineated as one physical sprayfield (right)
When NMP maps did not identify fields or when NMP maps were omitted or were of poor quality, external data was used to identify sprayfields by process of elimination. Subfields, aerways and
honeywagon fields (types of alternate irrigation systems), and buffer fields were assumed to correspond with their similarly named parent fields if not explicitly identified in the NMP maps. External data consisted of Duplin Tax Administration’s interactive website (Duplin County Tax Administration 2015), the USDA National Agricultural Statistics Service’s Cropland Data Layer (CDL) for years 2010-2014 (USDA National Agricultural Statistics Service), and soil for Duplin county from USDA’s National Cooperative Soil Survey, identified as SSURGO (Soil Survey Staff, Natural Resources Conservation Service). When external data was needed, sprayfields were manually identified using the reported CAFO owner to identify tax parcels unless land was explicitly marked as leased, matching reported crops grown and soil types with crops identified using the CDLs and SSURGO database, and finally, comparing reported acreage of fields to calculated acreage of sprayfields in ArcGIS. Figure 3 displays an example of using external data to identify sprayfield locations for one swine CAFO. Based on my review of Duplin county NMPs, of 24,528 reported sprayfield acres, 198 (0.8%) acres could not be identified using multiple sources, were not delineated, and were artificially centered over the parent CAFO’s point location.
9
Figure 3: Data sources for sprayfield delineation- Top: Original NMP map (left), Duplin County Tax administration (right); Bottom: CDL (left), final sprayfield delineation in red using 2012 NAIP aerial high resolution orthoimagery (right).
Data sources: creating the NMP database
Database standardization followed a procedure for NMP data entry and quality control. Data entered from the NMPs included information for each field including tract name, sprayfield name, sprayfield acreage, total PAN needed by crop per acre, residual PAN per acre, and commercial PAN applied per acre. CAFO-level information included annual volume of liquid effluent produced, PANspray, PANcrops, PANbal, number of swine, type of swine, NMP year created, and number of leased acres, if any.
Quality control for database entry included visual review and examination of all data entered from permits. Because the NMP reports PANbal at the CAFO level, re-calculation and summation of PANbal for each sprayfield for a given CAFO allowed direct comparison. Database standardization was required
10
since NMPs are created by various technicians and are not all formatted or calculated similarly.
PANspray, PANcrops, and PANbal were calculated using the technical standards at the time for which the NMP was created. Many old NMPs use technical standards that have since been grandfathered in without recalculating PAN based on present-day technical standards.
Calculating PANcrops:
PANcrops is calculated as the realistic yield estimate (RYE) of a given crop on a given soil and multiplied by a nitrogen factor, which is the amount of N required by the crop to produce the RYE. The nitrogen factor varies by the year for which an NMP was created due to differing technical standards for the nitrogen factor. Current nitrogen factors are reported in the Interagency Nutrient Management Committee’s crop yields and nitrogen factors database (North Carolina Interagency Nutrient
Management Committee 2014). NMPs calculate PANcrops on a sprayfield by sprayfield level as well as summed for the entire swine CAFO. Total PANcrops per acre equals the sum of residual, commercial, and liquid effluent PANapplied per acre. Unless commercial and residual PAN was identified in the NMP, PANcrops was assumed to come entirely from liquid effluent PAN. Many NMPs report optional crop rotations that may increase or decrease the reported PANbal. For this analysis, the most limiting and least limiting PANcrops scenarios were calculated based on the NMPs reported crop rotations and crop options so as to identify the full range of possible PANcrops. In most instances, reported PANcrops corresponded to the most limiting annual PANcrops. Fields reported as optional fields were omitted from this analysis.
Calculating PANspray:
NMPs provide the estimated total amount of PANspray for a swine CAFO. PANspray is the estimated portion of total nitrogen content of swine manure that remains available for crops to use after spraying the liquid effluent onto the sprayfield. PANspray is a difficult quantity to estimate
11
because the total nitrogen content of swine manure is not all plant available since some nitrogen is volatilized into the atmosphere while in the lagoon and while being sprayed onto fields during irrigation;
PANspray also depends on other variables such as humidity, temperature, wind speed, and
precipitation. Estimated PAN produced by the CAFO is also dependent on the irrigation type but for Duplin county, all NMPs reported broadcast (i.e. sprayfield) irrigation systems which estimates that 50%
of nitrogen that is in liquid effluent exiting the lagoon to be sprayed onto the fields is lost due to volatilization before reaching the crops (Crouse et al. 2014).
Equation 1 is the average estimated PANsprayfor a given swine CAFO, adapted from the NC Agricultural Chemicals Manual for 2015 (Crouse et al. 2014).
𝑃𝐴𝑁𝑠𝑝𝑟𝑎𝑦 = 𝑛𝑖∗ 𝑉𝑖∗ 𝑁𝑖∗ 𝑘 Equation 1
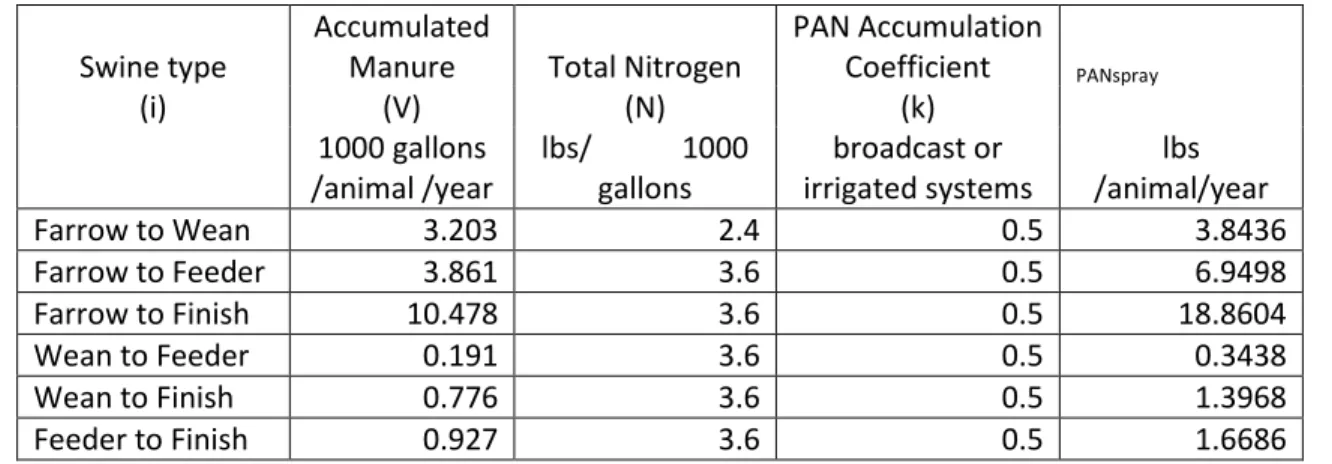
PANsprayis based on number of swine of type i (i.e. life-stage, e.g. farrow to wean or feeder to finish), V is the accumulated manure or liquid effluent volume of swine of type i in 1000 gallons per year, N is the total nitrogen per 1000 gallons of liquid effluent of swine type i, and k is the PAN availability coefficient for a given irrigation type.
To estimate PANspray, Table 1 presents the technical standards for PANspray for differentiation by type of swine. The PAN availability coefficient is 0.5 indicating that 50% of total nitrogen being sprayed is considered plant available.
12 Swine type
Accumulated
Manure Total Nitrogen
PAN Accumulation
Coefficient PANspray
(i) (V) (N) (k)
1000 gallons /animal /year
lbs/ 1000 gallons
broadcast or irrigated systems
lbs /animal/year
Farrow to Wean 3.203 2.4 0.5 3.8436
Farrow to Feeder 3.861 3.6 0.5 6.9498
Farrow to Finish 10.478 3.6 0.5 18.8604
Wean to Feeder 0.191 3.6 0.5 0.3438
Wean to Finish 0.776 3.6 0.5 1.3968
Feeder to Finish 0.927 3.6 0.5 1.6686
Table 1: Average PANspray for anaerobic lagoon liquid in broadcast or irrigated systems by type of swine in NC. Adapted from Crouse et al. 2014
Some NMPs reported on-farm analyses of PANspraycontent over a three year period. Generally, the PANspray from on-farm analyses are less than the calculated PANspray since the calculated PANsprayis based on average values in NC. For this analysis, PANspray was calculated using the
reported equation from tables updated and first implemented in July 2013 and published in the 2014 NC Agricultural Chemicals Manual (Crouse et al. 2014) rather than incorporating older on-farm records primarily because on-farm records were outdated (usually over a decade old). It should be noted that the vast majority of NMPs calculate PANspray using older standards.
To calculate sprayfield-level PANspray, because PANspray is reported on a CAFO-level, PANspray for each CAFO’s sprayfields is weighted by the fraction of PANcrops for a sprayfield compared to the total PANcrops of the entire CAFO. Instead of weighting PANspray by sprayfield acreage or applying
PANspray evenly across sprayfields, this approach allows that sprayfields with crops that need more nitrogen, with higher PANcrops, require more liquid effluent and hence more PANspray applied to this sprayfield.
Calculating PANbal:
NMPs are regulated such that the PANbal must be negative to be in compliance with DENR. The PANbal equals the PANspray minus the PANcrops. A positive PANbal represents PAN that cannot be
13
absorbed by the crops currently grown on the sprayfield if effluent is sprayed into sprayfields. NMPs report average annual CAFO-level PANbal.
Sprayfield-level PANbal was calculated by subtracting reported sprayfield-level PANcrops from calculated sprayfield-level PANspray. Summation of each CAFO’s sprayfield-level calculations of PANbal was compared to the reported CAFO-level PANbal and quality control ensured that calculations fell within 5% error and below a difference of 400 lbs PAN compared to reported PANbal. This quality control step identified inconsistent PANbal calculations in some NMPs. Inconsistent PANbal calculations were standardized resulting in some sprayfield-level summations of PANbal that do not match the reported CAFO-level PANbal. This data standardization included the following: reported acres of sprayfields were used to calculate PANcrops rather than the minimum portion of the sprayfield needed to be in compliance, NMP addendums with updated crop information were included even if the
reported PANbal omitted these crops entirely, all crop rotations that included soybean such as corn- wheat-soybean rotations were standardized and disaggregated to an annual level such that corn and wheat (or winter annuals) were grown in one year (i.e. double cropped corn and wheat) and soybeans grown in a second year.
Remote Sensing Data
Using the locations of sprayfields, a new method using remote sensing identifies PANcrops and PANbal at an annual level. NMPs do not identify the calendar year for which a crop is grown. For example, the PANcrops for corn and wheat planted in one year is much greater than the PANcrops for soybeans following in the second year.
Calculating PANcrops:
Recall that PANcrops is calculated based on the RYE for a given crop on a given soil and multiplied by the nitrogen factor. The RYE and nitrogen factor needed to calculate PANcrops are available from a crop
14
yield database managed by the NC Interagency Nutrient Management Committee (North Carolina Interagency Nutrient Management Committee 2014). The nitrogen factor depends on crop type and soil type. For Duplin county, the crop yield database identifies the RYE and nitrogen factor for 32 crop types for each of 44 soil types.
Crop type and soil type were identified for each sprayfield as follows using ArcGIS 10.1. Sprayfields were electronically delineated as described previously. Soil type was identified using SSURGO (Soil Survey Staff, Natural Resources Conservation Service) and the majority crop type for each sprayfield-soil portion was identified using the Cropland Data Layer (CDL) between 2010 and 2014 (years for which CDL was available in NC). Sprayfields were split into portions if multiple soil types intersected the sprayfield.
The CDL uses remote sensing at a 30x30m resolution for years 2010-2014 and 56x56m resolution for 2008-2009. Years 2008-2009 were not included because the resolution was poor relative to the size of the sprayfields.
𝑃𝐴𝑁𝑐𝑟𝑜𝑝𝑠 = ∑ 𝑠𝑙𝑜𝑝𝑒𝑠,𝑐∗ 𝑅𝑌𝐸𝑠,𝑐∗ 𝑁𝑠,𝑐∗ 𝑎𝑐𝑟𝑒𝑠
𝑛
𝑖=1
Equation 2
Equation 2 represents how PANcrops was calculated once soil type and crop type were identified for a sprayfield where i is the sprayfield-soil portion and if a sprayfield has one soil type n=1, s is the type of soil, c is the crop type, slope is a slope correction coefficient, RYE is the realistic yield estimate, N is a nitrogen factor per acre. Slope, RYE, and N for a given s and c are defined in the crop yield database.
PANcrops per acre was identified by matching the crop and soil types identified from the CDL and SSURGO datasets with crop and soil types in crop yields database. Matching crop types identified on sprayfields from CDL to the crop yield database was done as follows: corn, rye, oats, sorghum, and winter wheat were re-classified as grown for grain rather than silage, soybeans were assumed to be full season since double cropped soybeans were identified separately by CDL, and millet was assumed to be
15
grown for hay. Double cropped crops summed PAN for each crop (e.g. double cropped soybeans with winter wheat sums PAN for soybeans and PAN for winter wheat). All CDL-identified grass, pasture, other hay, non-alfalfa, sod, grass seed, fallow, and idle cropland were re-classified as hybrid
bermudagrass for overseed rather than grown for hay or grazed. All non-agricultural land including water, shrubland, barren land, and all types of forest, wetland, and developed land were not matched to the crop yield database and omitted from PAN calculations even if identified on a sprayfield. All
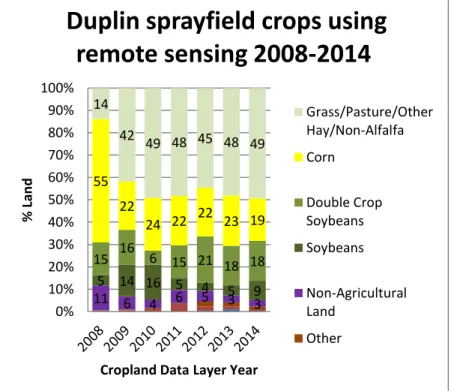
miscellaneous and other vegetables including squash, cucumbers, sweet potatoes, blueberries were not matched to the crop yield database and also omitted. Table S1 in Supplemental Information provides a full table of CDL-identified crops and re-classified crops matched to the crop yield database. Unmatched crops without crop yield or PAN values (i.e. non-agricultural and miscellaneous crops) comprise 3-6% of sprayfield acreage between 2010-2014. Figure 4 displays acreage for different crop types on Duplin county sprayfields between 2008 and 2014.
Figure 4: Cropland data layer identified crops on sprayfields for years 2008-2014 in Duplin county
11 6 4 6 5 3 3 5 14 16 5 4 5 9 15 16
6 15 21 18 18 55
22
24 22 22 23 19 14
42 49 48 45 48 49
0%
10%
20%
30%
40%
50%
60%
70%
80%
90%
100%
% Land
Cropland Data Layer Year
Duplin sprayfield crops using remote sensing 2008-2014
Grass/Pasture/Other Hay/Non-Alfalfa Corn
Double Crop Soybeans Soybeans
Non-Agricultural Land
Other
16
Figure 5 identifies sprayfield-soil portions and corresponding calculated PANcrops for one permitted swine CAFO for years 2011-2014. Sprayfields growing soybean have zero PANcropsneeded but have with higher PANcrops needed when growing corn and cotton crops which require more PAN than soybeans.
Figure 5: Identified crops using remote sensing CDLs between 2011 and 2014(top row) and corresponding calculated PANcrops for soil-sprayfield portions of a CAFO (bottom row). Soil types (SSURGO) are labeled in the bottom right.
Calculating PANspray:
PANspray was calculated as when comparing permitted data by multiplying the number of swine of a given type times the PAN factor as outlined by Crouse et al. 2014 (see Table 1 and equation 1).
Similarly, sprayfield-level PANspraywas weighted by the proportion of total PANcrops for the swine CAFO.
17 Calculating PANbal:
As discussed previously, PANbal equals the PANspray minus PANcrops and was calculated at the sprayfield level.
Sub-Watershed Aggregation
For permitted point data, and permitted and remotely sensed field-level data, PANspray, PANcrops, and PANbal were summed over two sub-watershed scales for any sub-watershed that intersects or is within Duplin county: 1134 catchments averaging 529 acres apeice from the National Hydrography Dataset (USGS and EPA 2012) and 34 USGS-defined sub-watersheds at the “HUC12” level averaging 20704 acres (USGS and USDA - NRCS). Sprayfields that crossed into more than one sub-watershed had all PAN values weighted by proportion of acreage in each sub-watershed.
18
CHAPTER 3: RESULTS
All PANcrops and PANbal presented hereafter are based on the most limiting crop rotation scenario, that is, the crop rotation that has the lowest PANcrops for a given CAFO.
Characterization of Duplin county NMPs
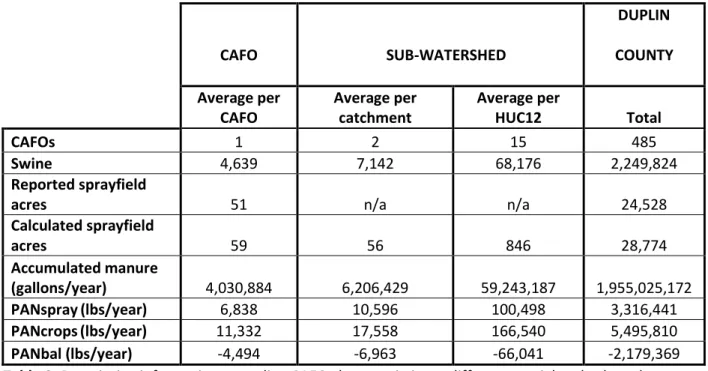
Although maps are required as nutrient management plans, many NMPs were incomplete. Other inconsistencies especially with regard to how PANcrops was calculated had to be standardized. Table 2 summarizes permitted data for Duplin county. Duplin county has permitted 24,528 sprayfield acres receiving lagoon effluent and over two million swine producing almost two billion gallons of liquid swine effluent per year. All NMPs in Duplin county use a broadcast or irrigated irrigation system and none of the NMPs in Duplin county incorporated sludge PAN into their PANbal. The average age of Duplin county NMPs submitted in 2014 is seven years (created in 2007), with nearly one third of NMPs created one decade before the 2014 submission and some as old as 1996, when DENR first began permitting swine CAFOs.
Comparing CAFO Point to Sprayfield
Sprayfields in Duplin county range from being located directly next to lagoons and CAFO centroid locations to being up to four miles from the CAFO centroid. The majority (63%) of sprayfields are located less than a quarter mile from farm centroids, however 8% of sprayfields are located over half a mile from the CAFO centroid.
19
Figure 6: Proportion of Duplin sprayfield distances from CAFO centroid
By using sprayfield location compared to using CAFO point location, of 1134 catchments in Duplin county 311 have permitted lagoon effluent applied on them when using point locations. Of 311 initial catchments, 30% of catchments varied by at least 50% and 50% of catchments varied by at least 25% for PANbalwhen compared to using sprayfield location. Additionally, as a result of using sprayfields, 198 additional catchments and 1 additional HUC12 were identified as having permitted lagoon effluent applied. Figure 7 displays change in PANspray aggregated at the catchment and HUC12 sub-watershed levels for point locations compared to sprayfield locations with a middle column displaying the
difference (labeled in percent difference) between point and sprayfield location. Figure 8 similarly shows the same data for PANbal. The PANbal difference identifies sub-watersheds that have a more positive shift, indicating PANbal has increased and has less crop availability to absorb PANspray
nutrients. Dark grey sub-watersheds distinguish identified sub-watersheds as a result of using sprayfield location. Smaller spatial scales have more variation compared to the larger HUC12 sub-watershed scale.
1% 7%
29%
63%
Sprayfield Distance from CAFO Centroid
> 1 mile 0.5 - 0.9 mile 0.25 - 0.49 mile
< 0.25
20
Figure 7: Comparing PANsprayat the catchment and HUC12 sub-watershed levels using point vs.
sprayfield locations and permitted data. Difference identifies shifts in sub-watersheds with labeled numbers identifying percent change.
21
Figure 8: Comparing PANbal at the catchment and HUC12 sub-watershed levels using point vs. sprayfield locations and permitted data. Difference identifies shifts in sub-watersheds with labeled numbers identifying percent change
In addition to presenting spatial distribution of PANspray and PANbal, Table 2 compares number of swine, sprayfield acreage, accumulated manure, and the average values of PANspray, PANcrops, and PANbal at the CAFO, catchment, HUC12, and county levels.
22
CAFO SUB-WATERSHED
DUPLIN COUNTY
Average per CAFO
Average per catchment
Average per
HUC12 Total
CAFOs 1 2 15 485
Swine 4,639 7,142 68,176 2,249,824
Reported sprayfield
acres 51 n/a n/a 24,528
Calculated sprayfield
acres 59 56 846 28,774
Accumulated manure
(gallons/year) 4,030,884 6,206,429 59,243,187 1,955,025,172
PANspray(lbs/year) 6,838 10,596 100,498 3,316,441
PANcrops(lbs/year) 11,332 17,558 166,540 5,495,810
PANbal (lbs/year) -4,494 -6,963 -66,041 -2,179,369
Table 2: Descriptive information regarding CAFO characteristics at different spatial scales based on location of CAFO point. All data is based on permitted data for Duplin county except calculated sprayfield acreage which was calculated in ArcGIS 10.2 using delineated sprayfield data.
Remote Sensing Approach
Remotely sensed crop data allowed annual PANcropsto be calculated. Table 3 identifies average PANspray, average PANcrops, and average PANbal for years 2010-2014 at the catchment and HUC12 sub-watershed scales as calculated using the CDLs compared to reported NMP values. NMP reported metrics are assigned at the point location. As such, catchment averages for CDL identified metrics are lower than NMP values because NMP values are averaged over fewer catchments. Additionally, Table 3 identifies that total average PANcrops identified by using the CDL is 6.2 million pounds of PAN compared to 5.5 million pounds compared to 5.5 million pounds as permitted by NMPs, a 13% increase.
23
Unit of
Analysis PANspray PANcrops PANbal
2010
Catchment 6,485.03 11,888.17 -5403.15
HUC12 97,279.48 178,204.80 -80888.45
Total 3,307,363.64 6,062,968.05 -2755604.41
2011
Catchment 6,485.03 12,096.31 -5611.28
HUC12 97,279.48 181,313.63 -84034.16
Total 3,307,363.64 6,169,116.34 -2861752.71
2012
Catchment 6,485.03 11,890.68 -5405.65
HUC12 97,279.48 178,204.80 -80925.32
Total 3,307,363.64 6,064,245.33 -2756881.69
2013
Catchment 6,485.03 12,512.79 -6027.76
HUC12 97,279.48 187,601.97 -90322.50
Total 3,307,363.64 6,381,520.68 -3074157.04
2014
Catchment 6,485.03 12,282.62 -5797.60
HUC12 97,279.48 184,166.75 -86887.27
Total 3,307,363.64 6,264,137.86 -2956774.23 CDL
Average
Catchment 6,485.03 12,134.11 -5649.09
HUC12 97,279.48 181,898.39 -84611.54
Total 3,307,363.64 6,188,397.65 -2881034.02 NMP
Reported Average
Catchment 10,596.00 17,558.00 -6963.00 HUC12 100,598.00 166,540.00 -66041.00 Total 3,316,441.00 5,495,810.00 -2179369.00
Table 3: Comparison of PANspray, PANcrops, and PANbal using CDLs for 2010-2014 and reported NMP values at the point locations
For every sprayfield, catchment, and HUC12, PANspray, PANcrops, and PANbal were calculated for years 2010-2014. Figures 9 and 10 display PANspray, PANcrops, and PANbal at the catchment and HUC12 sub-watershed scales for years 2010-2014. Figure 11 shows the maximum range of PANcrops identified over 2010-2014 for two sub-watershed scales where the darker the color, the more variation in PANcrops. Although variation in PANspray does not change much from year to year, the variability in the PANbalis primarily a result of variation in PANcrops. The range between the minimum PANcrops and maximum PANcrops can be interpreted as how variable the unit of analysis is in terms of crop types
24
planted. Variability can be explained by common corn/soybean rotations in which soybeans do not require much (if any) PAN for a calendar year and corn requires much more PAN.
Figure 9: Catchment sub-watershed changes over time in PANspray, PANcrops, and PANbal. Remote sensing was used to determine PANcrops.
25
Figure 10: HUC12 sub-watershed changes over time in PANspray, PANcrops, and PANbal. Remote sensing was used to determine PANcrops.
26
Figure 11: maximum range in PANcrops for CDL-identified crops for sprayfields aggregated for two sub- watershed scales in Duplin county between 2010 and 2014
27
CHAPTER 4: DISCUSSION
Using sprayfield location rather than CAFO point location markedly affected PANbal at the catchment and HUC12 scales. Many more shifts in PANspray and PANbalwere observed at the catchment level compared to the larger HUC12 sub-watershed scale.
Sprayfield location limitations included that calculated acreage of delineated sprayfields are generally larger than reported acres because NMPs require that claimed acreage for liquid waste application must be deemed “wettable acres,” that is, not including spray gaps and buffers around the fields. As such, calculating acres of delineated sprayfields may overestimate wettable acreage.
However, reported NMP acres may be compared to calculated acreage to help determine error in correct identification of sprayfield extent. A conservative model would use centroid of sprayfields rather than edges of sprayfields when using sprayfield data in future analyses. Fields with sludge
application were not explicitly identified in any of the NMPs and may be applied elsewhere. Sludge from lagoons typically have higher phosphorus and heavy metal content than liquid effluent. Optional fields are omitted. Finally, sub-watersheds (catchments or HUC12s) that are not completely contained within Duplin county may have omitted sprayfields that are within the sub-watershed but not in Duplin county.
Limitations using permitted data to calculate PANbal at the watershed level include all internal inconsistencies in NMP calculations for estimated PANcrops (e.g. varying technical standards, difficulty in estimating PAN). Assumptions regarding estimated PANspray require averaging volatilization from lagoon effluent as well as volatilization during irrigation. PAN accumulating as sludge is not
incorporated into the NMP balance although sludge must be removed every five years, on average, and land-applied. Additionally, on-farm records identifying CAFO-specific PANspraywere not used and
28 assumed to be too old and no longer applicable.
Identifying annual change in PANbal at the sprayfield and sub-watershed scales was done using remote sensing data to identify crops. NMP PANbal calculations are averaged annually and do not disaggregate by year or are able to identify calendar year for which a particular crop is grown. Many NMPs have many potential crop options with a large range of PANcrops. The annual time step of CDLs allows a crop grown for a specific calendar year to be identified and potentially linked to water
monitoring data.
From a regulatory and efficiency standpoint, remote sensing is much more time efficient. Most public records requests and most of the data entry is eliminated once sprayfield location is known when using the remote sensing approach. Permitted data is only needed to determine PANspray which is dependent only on number and type of swine, both of which are reported online by DENR and easily accessible.
The biggest limitations to the remote sensing approach are crop identification validation and probably to a lesser extent, internal inconsistencies in the NMPs themselves. The USDA 2012
agricultural census reported 36,724 acres of harvested corn for grain in Duplin county, while the 2012 CDL reported 42,841, a 16% increase(USDA National Agricultural Statistics Service 2012b). The CDL is a USDA product and data validation estimates that corn is correctly identified about 95% of the time in NC. In addition to CDL mis-identification, some corn may not be harvested and thus not counted in the USDA census. The remote sensing approach makes some assumptions with regard to matching crop type identified from the CDL to the crop yields database. The CDLs cannot identify whether hybrid bermudagrass is cut for grass, grazed, or overseeded, which affects the PANcrops. Hybrid bermudagrass was assumed to be all overseeded based on personal communication with Dr. David Crouse, a nutrient management expert and soil scientist, who indicated that hybrid bermudagrass is usually overseeded in NC. Additionally, when comparing the remote sensing method to permitted NMP data, remote sensing
29
calculates PANcropsusing current standards for nitrogen factors whereas nitrogen factors are not standardized and are internally inconsistent over all permitted NMPs. Thus, when comparing PANcrops using the remote sensing approach to the permitted data approach (e.g. as in Table 4), differences in total PANcrops in Duplin county may be a result of differences in nitrogen factor calculations. As such we cannot truly identify whether changes in PANcrops are based on differences in identifying PAN needs by crop or in actual differences in crop values as identified by the CDLs.
Even with internal inconsistencies of the permitted data, remote sensing provides a time efficient method to identify PAN needs by crops on sprayfields. NMPs are unable to identify PANcrops for specific calendar years. For corn and soybean rotation fields, CDL-identified crops are easily matched to the crop yield database and PANbal confidence is much higher compared to fields of hybrid
bermudagrass.
30
CHAPTER 5: FUTURE WORK
First, sprayfield data will be made available online to distribute. Sprayfield data will include sprayfield location and permitted data associated with the sprayfield.
On reviewing permitted data, I have identified a few recommendations for improved NMPs. It was found that although sludge PAN is identified, it is not incorporated into the PANbal of the NMP. Future work will identify where sludge application fields are and I would suggest that this be included in the NMP. Additional recommendations for NMP revisions include compliance being for the most limiting scenario of PANbal rather than an average of PANbal over multiple crop years. Multiple NMPs were found that had above zero PANbal when disaggregated by year. Compliance being a PANbal less than zero for the most limiting crop scenario would ensure that years when, soybeans are planted, for example, the PANbal remains negative. Finally, many NMPs reduce their estimated accumulated manure and PANspray volumes based on on-farm records from over a decade ago. Recommendations are to specify minimum time intervals for on-farm records. Additionally, as a regulatory aid, having a spatial database of sprayfields identifies when some fields are claimed as optional for one CAFO, but claimed as required wettable acres on another CAFO.
Additional work may explore re-calculating PANcrops from permitted data using standardized and current nitrogen factors to determine the extent to which internal NMP inconsistencies contribute to PANcrops error in the remote sensing method. Although older permits are allowed, from a regulatory standpoint, to use older nitrogen factor standards, identifying positive PANbal using current nitrogen factors would identify sub-watersheds for water quality monitoring.
31
Creating a spatial database of sprayfields and permitted PANbal facilitates targeted water quality monitoring by being able to identify susceptible sub-watersheds that have both high permitted PANspray production and close to zero or above zero permitted PANbal, where there may be a potential for elevated nutrient load at smaller spatial scales. Targeting sub-watersheds with high permitted PANspray also allows for the ability to target water quality monitoring for pollutants other than nitrogen such as microbial contamination.
32
APPENDIX 1: SUPPLEMENTAL INFORMATION
CDL Identified Crop Reclassified Crop
Corn Corn Grain
Cotton Cotton
Dbl Crop
WinWht/Sorghum
Double Crop Winter Wheat/Sorghum
Tobacco Flue Cured Tobacco
Fallow/Idle Cropland Hybrid Bermudagrass Overseed Grass/Pasture Hybrid Bermudagrass Overseed Sod/Grass Seed Hybrid Bermudagrass Overseed Other Hay/Non Alfalfa Hybrid Bermudagrass Overseed
Squash Other
Misc Vegs & Fruits Other
Cucumbers Other
Sweet Potatoes Other
Other Crops Other
Blueberries Other
Open Water Non-Agricultural Land Deciduous Forest Non-Agricultural Land Developed/Low Intensity Non-Agricultural Land Developed/Open Space Non-Agricultural Land Evergreen Forest Non-Agricultural Land Herbaceous Wetlands Non-Agricultural Land Mixed Forest Non-Agricultural Land Woody Wetlands Non-Agricultural Land
Barren Non-Agricultural Land
Shrubland Non-Agricultural Land
Forest Non-Agricultural Land
Dbl Crop Soybeans/Oats Oats - Grain
Peanuts Peanuts
Millet Pearl Millet Hay
Rye Rye Grain
Sorghum Sorghum Grain
Soybeans Soybeans - Full Season
Dbl Crop
WinWht/Soybeans
Double Crop Winter Wheat/Soybean
Winter Wheat Wheat Grain
Table S1: Reclassifying crops identified by the Cropland Data Layer to crops that have N factors from the NC crop yield database
33 REFERENCES
Burkholder J, Libra B, Weyer P, Heathcote S, Kolpin D, Thorne PS, et al. Impacts of waste from
concentrated animal feeding operations on water quality. Environ Health Perspect [Internet]. 2007 Feb [cited 2014 Nov 24];115(2):308–12. Available from:
http://www.pubmedcentral.nih.gov/articlerender.fcgi?artid=1817674&tool=pmcentrez&rendertyp e=abstract
Burkholder JM, Dickey DA, Kinder CA, Reed RE, Michael A, Mciver MR, et al. Comprehensive trend analysis of nutrients and relateed variables in a large eutrophic estuary: A decadal study of anthropogenic and climatic influences. Limnol Ocean. 2006;51:463–87.
Burkholder JM, Mallin MA., Glasgow HB, Larsen LM, McIver MR, Shank GC, et al. Impacts to a Coastal River and Estuary from Rupture of a Large Swine Waste Holding Lagoon. J Environ Qual.
1997;26:1451.
Crouse D, Smyth T, Crozier C, Shah S, Cleveland B. Livestock & Poultry Manure Production Rates and Nutrient Content. North Carolina Agric. Chem. Man. 2014.
Duplin County Tax Administration. Duplin County Tax Administration [Internet]. Kenansville, NC: Gary M.
Rose, Assessor; 2015. Available from: http://gis.duplincountync.com/maps/map.htm#
ESRI. ArcGIS Desktop. Redlands, CA: Environmental Systems Research Institute; 2011.
Furuseth OJ. Restructuring of Hog Farming in North Carolina: Explosion and Implosion. Prof Geogr [Internet]. 1997 Nov [cited 2014 Aug 23];49(4):391–403. Available from:
http://www.tandfonline.com/doi/abs/10.1111/0033-0124.00086
General Assembly of North Carolina. An act to implement recommendations of the blue ribbon study commission on agricultural waste. SL-1995-626 1995.
General Assembly of North Carolina. Farm GPS Coordinates/Photos/Public Records. SB-762 2014.
Hardee D, Hall T, Spencer J, Cutts T, Evans R, Crouse D, et al. Ninth Senate Bill ( SB ) 1217 Interagency Group Guidance Document. 2009.
Hribar C. Understanding Concentrated Animal Feeding Operations and Their Impact on Communities [Internet]. Bowling Green, Ohio; 2010. Available from:
http://www.cdc.gov/nceh/ehs/docs/understanding_cafos_nalboh.pdf
Mallin M, Cahoon L. Industrialized animal production – A major source of nutriet and microbial pollution to aquatic ecosystems. Popul Environ. 2003;24(5):369–85.
Messier KP, Kane E, Bolich R, Serre ML. Nitrate Variability in Groundwater of North Carolina using Monitoring and Private Well Data Models. Environ Sci Technol. 2014;14:10804–12.
34
NC Department of Environment and Natural Resources. List of Permitted Animal Facilities [Internet].
Raleigh, NC; 2015. Available from: http://portal.ncdenr.org/web/wq/animal-facility-map Nicole W. CAFOs and Environmental Justice: The Case of North Carolina. Environ Health Perspect.
2013;121(6):182–90.
North Carolina Interagency Nutrient Management Committee. Realistic yields and nitrogen application factors for North Carolina crops [Internet]. Raleigh, NC: North Carolina State University, North Carolina Department of Agriculture and Consumer Services, North Carolina Department of Environment and Natural Resources, Natural Resources Conservation Service; 2014. Available from: http://yields.soil.ncsu.edu
Soil Survey Staff, Natural Resources Conservation Service USD of A. Web Soil Survey [Internet]. USDA- NRCS; Available from: http://websoilsurvey.nrcs.usda.gov/.
USDA FSA Aerial Photography Field Office. NAIP 2012: Orthoimagery [Internet]. Salt Lake City, UT: UDSA- FSA-APFO; 2012. Available from: http://datagateway.nrcs.usda.gov/GDGHome.aspx
USDA National Agricultural Statistics Service. Cropland Data Layer [Internet]. Washington, DC: USDA- NASS; Available from: http://nassgeodata.gmu.edu/CropScape/
USDA National Agricultural Statistics Service. Census of Agriculture [Internet]. QuickStats 2.0. 2012a.
Available from: http://quickstats.nass.usda.gov/
USDA National Agricultural Statistics Service. County Summary Highlights 2012 [Internet]. 2012b.
Available from:
http://www.agcensus.usda.gov/Publications/2012/Full_Report/Volume_1,_Chapter_2_County_Le vel/North_Carolina/st37_2_001_001.pdf
USGS, EPA. National Hydrography Dataset Plus v. 2 [Internet]. 2012. Available from:
http://www.horizon-systems.com/NHDPlus/index.php
USGS, USDA - NRCS. Watershed Boundary Dataset [Internet]. Available from:
http://water.usgs.gov/GIS/huc.html
Wing S, Cole D, Grant G. Injustice in North Carolina’s Hog Industry. Environ Health Perspect.
2000;108(3):225–31.