Abstract— There exists a generalized interest in the improvement of safety issues in buses due to the social alarm brought on by accidents in which buses are involved. Accident statistics show that bus rollover accidents occur with relative low frequency, taking into account all kinds of bus accidents. Nevertheless the risk of mortality in the case of rollover is five times greater compared with any other possible bus accident typology.
The object of this paper is the development of a numerical technique able to simulate the mechanical behaviour of bus body sections in the case of rollover. This technique will permit the analysis of different material systems that could be used in the building of buses in order to achieve the best structural behaviour against rollover. Simulations will be based on UNECE Regulation no. 66 (ECE66) specifications: “Uniform technical prescriptions concerning the approval of large passenger vehicles with regard to the strength of their superstructure”. Different F.E.M. numerical models are developed and tests are simulated by the finite element method. A sensibility analysis has also been carried out, taking into account several parameters affecting the calculations such as the strain rate and the type of elements used in the model.
Index Terms— Rollover, bus, vehicle safety, ECE66
regulation.
I. ANALYSIS PROCESS
The development of adequate finite element models for bus rollover impact simulations has been the first step to reach the considered objectives [1]. In this sense, several models of bus body sections have been modeled. It was decided to use a body section instead of the whole bus in the simulations not
Manuscript received March 4, 2010 for the WCE 1010
D. Valladares is a researcher in the staff of the Mechanical Department of the University of Zaragoza, Spain (phone: +34/976761888; fax: +34/9762670; e-mail: [email protected]).
R. Miralbes is a Professor in the Design and Manufacture Department of the University of Zaragoza, and is a researcher in the staff of the Mechanical Department of the University of Zaragoza, Spain (phone: +34/976761888; fax: +34/9762670; e-mail: [email protected])
L. Castejon is a Professor in the Mechanical Department of the University of Zaragoza, Spain (phone: +34/976761888; fax: +34/9762670; e-mail: [email protected]).
only to simplify the modeling tasks but also to reduce the computer resources needed. As stated in regulation No. 66 [2], a body section means a structural unit, which represents one part of the bus superstructure for the purposes of an approval test containing at least two bays connected by representative connecting elements (side, roof, and underfloor structures). In this case, a six-bay bus has been considered, so the body section mass will represent one third of the whole bus. The finite element software PATRAN has been used as pre-processor for this step.
In the next step, boundary and load conditions have been applied. Calculations have finally been carried out with the finite element software ABAQUS Explicit. For the different models, results will be analysed, taking into account the following influence variables:
- Steel strain rate.
- Use of different types of elements and material systems for the bus body section models.
- Use of rigidity curves characterizing the mechanical behaviour of rectangular cross section beams in the bays.
II.STEEL STRAIN RATE
Quasi-static tensile test strain rates normally range from 10-5 s-1 to 10-3 s-1. Nevertheless, the strain rate for an impact situation may reach a much higher value ranging from 103 s-1 to 105 s-1. So as to determine the influence in the results of the material strain rate, steel mechanical properties variation has been incorporated to the finite element calculation [3]. Experimental stress-strain curves, including strain rate effect, for AISI 1044 carbon steel have been introduced in ABAQUS by means of bilinear elastic-plastic curves.
Development of a Numerical Technique for Bus
Rollover Test Simulation by the F.E.M.
Fig. 1: Experimental and approximated stress-strain curves for AISI 1044 steel
III.BUS BODY SECTION MODELS
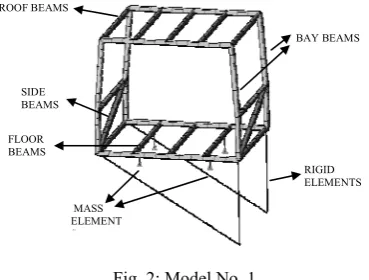
Rollover test simulations of three different finite element models have been carried out. Each model represents a body section of the whole bus. All these F.E. models have been assigned a mass of one third of the bus mass, so four point elements with the necessary mass have been incorporated to each model. These mass points have been connected to the structure by means of rigid elements. The bus total mass considered is 11800 kg.
Model No. 1: Initial model meshed with beam elements
MASS ELEMENT S FLOOR BEAMS SIDE BEAMS
RIGID ELEMENTS BAY BEAMS ROOF BEAMS
Fig. 2: Model No. 1
Model No. 2: This model is very similar to model no1 with
the addition of sandwich structures in the floor, the roof and sides of the bus to improve its rigidity [4][5][6]. All these sandwich structures consist of a polyurethane core of 56 mm fixed with an adhesive to two steel skins of 2 mm. Shell elements have been used to simulate these sandwich structures in model no 2.
The model has also been calculated using rigidity curves to characterize the mechanical behaviour of bay beams, adding plasticity, instability and collapse phenomena [7] to the simulation.
BAY BEAMS
RIGID ELEMENTS MASS
ELEMENTS SIDE BEAMS
ROOF BEAMS
SANDWICH
[image:2.595.335.514.114.259.2]STRUCTURES FLOOR BEAMS
Fig. 3: Model No. 2
Model No. 3: This is a much more detailed model which
incorporates shell elements to simulate the bus structural beams. In this case sandwich structures have been modeled by means of shell elements in the steel skins and solid elements in the foam and the adhesive. Dimensions are the same as model No. 2.
RIGID ELEMENTS MASS
ELEMENTS
SANDWICH STRUCTURE DETAIL STRUCTURAL BEAMS WITH SHELL ELEMENTS
[image:2.595.342.504.363.710.2] [image:2.595.84.269.548.688.2]IV.RIGIDITY CURVES CHARACTERIZING THE MECHANICAL BEHAVIOUR OF THE BAYS IN MODEL NO.2
Model No. 2 has been analysed by two ways. In the first one the beam elements simulating the bays have been assigned the corresponding cross sectional dimensions and material mechanical properties as appearing by default in ABAQUS. In the second one the bays have been assigned a mechanical behaviour defined by rigidity curves (bending moment-rotation). These rigidity curves were previously obtained from a F.E.M. model of a beam section meshed with shell elements.
100 mm 60 mm
100 mm
RIGID ELEMENTS
SHELL ELEMENTS
1
[image:3.595.61.267.211.331.2]2
Fig. 5: Beam section modeled with shell elements. Cross section 100mm x 60mm x 5 mm
While at one end the beam is fully constrained, a bending moment is applied at the other end by means of a rigid plate. The graphs of moment reaction against rotation angle of the rigid plate are then obtained.
Maximum moment 18116.2 N·m
Maximum moment 29626.4 N·m
Rotation (rad/m)
Rotation (rad/m)
Fig. 6: Beam section 100 mm long with cross section 100 mm x 60 mm x 5 mm. Bending moments in directions 1 and 2 against rotation angle.
In this case the geometry and mechanical behaviour of the beams are introduced by means of these rigidity curves and it is not necessary for ABAQUS to recalculate the cross section mechanical properties of the beam as it buckles.
V.MODEL POSITIONING, INITIAL AND BOUNDARY CONDITIONS
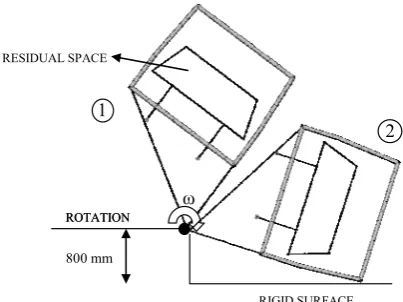
Regulation no 66 of Geneva defines a tilting platform test in which the vehicle is tilted without rocking and without dynamic effects until it reaches unstable equilibrium.
Rollover simulations have carried out positioning the bus models at a moment of a few milliseconds before impact. At the start of the simulation an initial angular velocity has been applied to the mesh model, equal to the angular velocity that the vehicle would have if the rollover started with zero velocity, and with the centre of gravity of the bus located over an imaginary vertical line passing through the axle of rotation. According to Geneva regulation no 66, an initial zero velocity is considered at the start of the rollover test. The conservation of mechanical energy law (1) has been applied for the angular velocity calculation:
(1) Regulation no 66 defines a “residual space” to be preserved in the passenger compartment. During the test, no part of the structure will be allowed to invade this residual space.
ROTATION
800 mm
2
RESIDUAL SPACE
1
ROTATION ω
[image:3.595.333.535.356.507.2]RIGID SURFACE
Fig. 7: Finite element model positions and residual space.
Apart from the initial angular velocity, the gravity acceleration to all the nodes of the structure has also been applied. Two nodes that are connected to the structure by rigid elements are positioned on the axle of rotation of the test. This position is defined by the most exterior points of the tyres of the bus in contact with the tilting platform. These nodes have all degrees of freedom constrained except for the rotation. A contact condition between the nodes of the model and the rigid ground has also been defined.
The residual space has been simulated by means of rigid elements connected to the floor of the bus. The dimensional specifications of the regulation have been taken into account for this.
I Δh g M 2 ω
ω I 2 1 Δh g M
2
2 2
[image:3.595.54.290.437.610.2]VI.OBTAINED RESULTS
For each mode two calculations have been carried out: Calculation 1: Analysis considering the strain rate
curves
Calculation 2: Analysis without the strain rate curves The following initial dimensions have been considered in all the models:
Table 1: Beam initial dimensions
BEAM CROSS SECCIÓN (mm)
Bay beams Rectangular 100 x 60 x 5 Floor, roof and side
beams
Rectangular 60 x 40 x 4
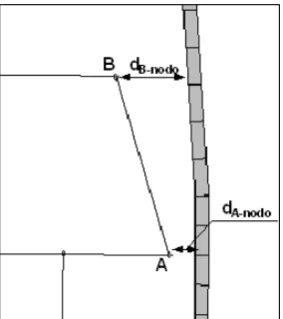
Two coefficients of safety have been defined in order to meet Geneva regulation no 66 according to figure 8:
Models no 1 and no 2: Point A: ) (
150
150
node A final Ad
N
(2)Point B: ) (
6
.
371
6
.
371
node B final Bd
N
(3)Model no 3: Point A: ) (
150
150
node A final Ad
N
(4)Point B: ) (
28
.
365
28
.
365
node B final Bd
N
(5)Values for the final distance (d final ) between points A and B and the bays are measured at the moment of maximum structural deformation.
Figure 8: Definition of points A and B. Distances between these points and the bay.
[image:4.595.48.553.131.490.2]All results obtained in the calculations carried out are shown in table 2. Those models with insufficient rigidity have been recalculated with a larger bay cross section (100x80x5)
Table 2: Results table
Bay cross section
(mm2)
Max. Von Mises Stress (MPa) Coef. of safety Point A Coef. of safety Point B Residual space Regulation no 66
Model no 1 Calculation 1
100x60x5 445.6 --- --- Insufficient
100x80x5 440.6 1.41 1.28 satisfactory
Model no 1 Calculation 2
100x60x5 473.3 --- --- Insufficient
100x80x5 468.9 1.56 1.38 satisfactory
Model no 2
Calculation 1 100x60x5 422.6 2.60 1.67 satisfactory
Model no 2
Calculation 2 100x60x5 447.1 2.89 1.80 satisfactory
Model no 2 With rigidity curves
100x60x5 597.94 2.11 1.40 satisfactory
Model no 3
Calculation 1 100x60x5 650 1.29 1.15 satisfactory
Model no 3
Calculation 2 100x60x5 762 1.53 1.26 satisfactory
7.CONCLUDING REMARKS
[image:4.595.96.238.565.725.2]It is concluded that those simulations considering the strain rate influence result in a more rigid structural behaviour with greater coefficient of safety. As shown in table 3, the coefficients of safety have the following increases:
Table 3: Strain rate influence. Increase in coefficient of safety
FINITE ELEMENT MODEL Increase in NA Increase in NB
Model no 1 --- ---
Model no 1 modified 10.63 % 7.8 %
Model no 2 11.15 % 7.78 %
Model no 3 18.60 % 9.56 %
Model no 1 does not verify the residual space non intrusion condition. The addition of sandwich structures in model no 2 improve the initial structural behaviour greatly: Model no 2 meets the regulation.
Model no 3 has a significant reduction in the coefficient of safety compared with model no 2. Whereas model no 2 reaches yield stress and has a plastic behaviour only in the plastic hinges located in the upper corners of the bays, model no 3 reaches a much more plastic behaviour with the failure of elements that directly impact the rigid ground
So the more detailed the finite element model is, the more restrictive to satisfy regulation no 66 rollover test specifications the model becomes. From the point of view of safety it will be necessary to model the vehicle with great detail so simplified finite element models should only be used at preliminary design phases.
Finally, as seen in model no 2, the use of rigidity curves for defining the mechanical behaviour of the bays leads to smaller coefficients of safety. Therefore model no 2 with rigidity curves is more restrictive than model no 2 with the default beam behaviour definition and more approximated to model no 3 behaviour.
REFERENCES
[1] O.C. Zienkiewicz, R.L. Taylor, “El Método de los Elementos Finitos. Vol. 1, las bases”.2004. Ed. Cimne
[2] E/ECE/324,E/ECE/TRANS/505, 2006, Addendum 65, Regulation no 66, “Uniform Technical Prescriptions concerning the approval of large passenger vehicles with regard to the strength of their superstructure” UNITED NATIONS.
[3] S. Simunovic, J. Fekete, D. Meulemann, Modeling of Strain Rate Effects in Automotive Impact, SAE-Paper No. 2003-01-1383, Detroit, Mi, USA, 2003.
[4] A. Miravete, Materiales compuestos, Ed. A. Miravete, 2000
[5] L. Castejón, A. Miravete, J. Cuartero, “Composite bus rollover simulation and testing”, International Journal of Heavy Vehicle Systems 2006, Vol. 13, Nº 4 pp. 281-297.
[6] G. Caprino, R.Tetti, Sandwich structures, Ed. Il Patro, 1989. [7] G.Belingardi, P.Martella and L. Peroni, Analysis of the coach rollover