An Evaluation of 3D OSEM, and a Comparison with FBP in
99mTC SPECT Images
Alzimami K, Sassi Sand Spyrou NM
Abstract
—The main thrust of this study is to evaluate 3D
ordered-subsets expectation maximization (OSEM) algorithm in 99mTc SPECT images for different noise levels. Also this study aims to compare 3D OSEM, with filtered back projection (FBP) with an optimized set of filter parameters, both with and without attenuation correction (AC). The SPECT images of a Jaszczak phantom filled with uniform 99m
Tc solution, and capillary line sources with 99mTc were acquired using a Siemens e-Cam Dual Head Gamma Camera. Three noise levels were achieved by acquiring the SPECT images of the Jaszczak phantom for 30, 20 and 10 seconds per projection angle. As expected, noise increases with increasing number of iterations. There is a significant increase in contrast with increasing number of subsets and iterations. In terms of noise, results have shown that 3D OSEM was significantly better than FBP for low count statistics Without AC, there was no significant difference between FBP and 3D OSEM., The key results of the present study are that improved spatial resolution was achieved using 3D OSEM. and constant resolution was obtained after 17 and 22 iterations in the centre and periphery of the FOV respectively. Furthermore, applying AC with 3D OSEM results in an improved image contrast in comparison to FBP.
Index Terms—3-D OSEM; AC; FBP; SPECT.
I. INTRODUCTION
There is increasing recognition that iterative reconstruction plays a key role in improving the quality of image reconstruction, particularly where attenuation is non homogeneous or where a more exact model of the emission and detection processes is required [1, 2]. Due to advances in computer power and improvements in reconstruction algorithms, iterative reconstruction methods, such as ordered-subsets expectation maximization (OSEM) has become a practical alternative to filtered back projection (FBP) [3].
Manuscript received March 6, 2008.
Alzimami K is with the Department of Physics, University of Surrey, Guildford, Surrey GU2 7XH, UK (Corresponding author. Tel. +441483689423. Email address: [email protected]).
Sassi S is with the Royal Marsden NHS Foundation Trust, Sutton, Surrey SM2 5PT, UK.
Spyrou NM is with the Department of Physics, University of Surrey, Guildford, Surrey GU2 7XH, UK.
The main thrust of this study is to evaluate a 3D OSEM algorithm (Flash 3D) with 3D beam modelling and optional
attenuation correction using 99mTc SPECT images for
different noise levels, and compare Flash 3D, with conventional FBP with an optimised set of filter parameters, both with and without attenuation correction (AC). This involved evaluation of contrast, noise and spatial resolution.
2. METHODS
A Jaszczak phantom filled with water containing 99mTc
(500 MBq) was used to measure contrast and noise in reconstructed SPECT images. Two capillary line sources filled with 99mTc were used to assess the tomographic spatial
resolution in air.
Image acquisition was performed using a Siemens e-Cam dual-head gamma camera (Siemens Medical Systems, Inc., Hoffman Estates, Ill., USA) equipped with a low-energy high-resolution collimator. SPECT acquisitions were performed using a 180° non-circular orbit for each detector, with 128 projection angles, a 128 × 128 matrix size, and zoom factor of 1. The pixel size of 4.75 mm was set according to the one used in clinical cardiac SPECT studies. A symmetrical 15% wide energy window for the acquisition was centered at 140 keV. Three noise levels were simulated by acquiring the SPECT images of the Jaszczak phantom for 30, 20 and 10 seconds per projection angles.
Acquired projection data was transferred to a Siemens e-Soft image processing station. The reconstruction algorithms considered in this study were FBP and 3D OSEM with 3D beam modelling and optional attenuation correction (Flash 3D) [4].
The OSEM reconstructions were halted after 1, 4, 8, 12 and 24 iterations using 2, 4, 8 and 16 subsets. Gaussian 3D post reconstruction filter was used. The linear attenuation coefficient was set to 0.15 cm-1. The statistical significance
of differences in contrast, noise and FWHM between different methods of reconstruction was assessed by a two-tailed T-test. Statistical significance was defined as P = 0.01.
The data was analysed according to the National Electrical Manufacturers Association (NEMA) guidelines for quality control of SPECT images [5]. The analysis was carried out by calculating the following parameters:
Contrast
Contrast C was defined as:
B B S
C = −
Where,the signal, S, in a single reconstructed slice of a cold sphere was defined as the average pixel value in the ROI. For the 10 mm diameter sphere, an ROI of two pixels covering the entire area of the cold sphere was employed. The background B was defined as the average pixel value in a circular ROI (≈ 2 pixels) positioned in the uniform region of the phantom.
Noise
Image noise was calculated from one axial tomographic slice through the uniform portion of the Jaszczak phantom. The noise was estimated by calculating the variation coefficient (VC), defined as:
M
VC = σ
Where σ : Standard Deviation of the mean pixel value. M: Mean pixel value.
Spatial Resolution
The spatial resolution was obtained by measuring a line profile across two point sources located in the centre and in the periphery of the FOV and calculating the FWHM of each curve.
3. RESULTS AND DISCUSSIONS
In this work, 3D OSEM performance, with and without AC, was characterized with respect to subset and iteration number for a constant pixel size and fixed post reconstruction filtering. 3D OSEM was compared to the conventional image reconstruction technique FBP with using Butterworth, Metz and Weiner filters.
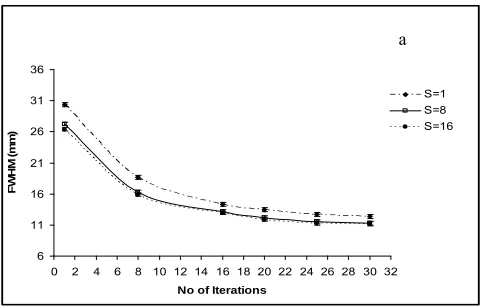
As shown in Fig. 1, for the same number of subsets, there is a linear relationship between the variation coefficient (noise) and the number of iterations. The graph also shows a linear relationship between noise and number of subsets for the same number of iterations.
This linear relationship (R2≈ 0.91) leads to a predictable
[image:2.612.316.557.448.601.2]and accurate characterisation of noise. Also, Fig. 1 clearly shows that the effect of number of subsets and iterations over noise is additive, in accordance with OSEM theory [3].
Fig. 1: Linear relationship between noise and number of iterations at different number of subsets.
It has been found that number of iterations needed to reach a constant FWHM was approximately 17 for the periphery and 22 for the centre of the FOV as shown in Figures 5.5a and 5.5b. These results agree with those reported by Pan et al., Yokio et al. and Kohli et al [3, 5, 6]. Kohli et al concluded that the reason for slow convergence in the central region was the effect of attenuation [6]. However this is not right as the simulation by Yokio et al. assumed no attenuating medium for a point source phantom [6]. According to Yokio et al. the reason of the slow convergence is that the SPECT resolution is originally better at the periphery than at the centre [6]. A more reasonable explanation of the slow convergence could be due to that objects located at the centre are back-projected more than that at the periphery [7].
6 11 16 21 26 31 36
0 2 4 6 8 10 12 14 16 18 20 22 24 26 28 30 32
No of Iterations
FW
HM
(
m
m
)
6 11 16 21 26 31
0 2 4 6 8 10 12 14 16 18 20 22 24 26 28 30 32
No of Iterations
FW
HM
(m
m
)
[image:3.612.316.556.70.399.2]S=1 S=8 S=16
Fig. 2: Variation of the spatial resolution (FVHM) with the number of iterations for a range of subsets. (a) at the centre; (b) in the periphery.
Fig. 3 demonstrates the superiority of 3D OSEM with respect to FBP in terms of spatial resolution. The improvement is considered to be statistically significant (P < 0.01). This could be due to the use of 3D beam modeling in the iteration process of the 3D OSEM algorithm. Unlike conventional 1D (e.g., FBP) or 2D reconstruction methods (e.g., 2D OSEM), all slices are reconstructed simultaneously, and not successively in the interactive calculation [4].
8 9 10 11 12 13 14 15
0.5/4 0.6/8 0.7/12 0.8/25 0.9/30
Cut-off Frequency/Iteration NO
FW
H
M
(m
m
)
3D OSEM, 8 subsets FBP, Wiener, Order=20
Fig. 3: Spatial resolution versus number of iterations in 3D OSEM with 8 subsets and cut-off frequency in FBP with a Wiener filter with order of 20.
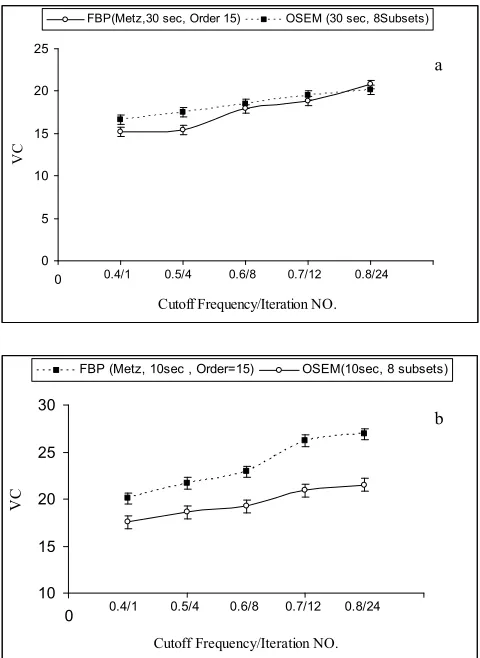
Fig. 4.a and Fig. 4b illustrate that 3D OSEM is the best choice for low count statistics study as 3D OSEM is significantly (P < 0.01) better than FBP in terms of noise. This could be due to the fact that iterative algorithms take the Poisson nature of the data into account [8].
0 5 10 15 20 25
0 1 2 3 4 5 6
Cutoff Frequency/Iteration NO.
VC
FBP(Metz,30 sec, Order 15) OSEM (30 sec, 8Subsets)
0.5/4 0.6/8 0.7/12 0.8/24
0.4/1 b
a
10 15 20 25 30
0 2 4 6
Cutoff Frequency/Iteration NO.
VC
FBP (Metz, 10sec , Order=15) OSEM(10sec, 8 subsets)
0.4/1 0.5/4 0.6/8 0.7/12 0.8/24
b
Fig. 4: Estimated noise versus number of iteration in 3D OSEM and cut-off frequency in FBP with Metz filter with order of 15: (a) for 30 seconds per projection angle; (b) for 10 seconds per projection angle.
[image:3.612.54.297.71.224.2] [image:3.612.56.297.383.520.2]0 2 4 6 8 10 12 14
0.4 / 1 0.5 / 4 0.6 / 8 0.7 / 12 0.8 / 25
Cut-off Frequency / Iteration NO.
Co
nt
ra
st
(%
)
[image:4.612.323.549.69.207.2]FBP, Butterworth (Order=15) OSEM (Subsets=8)
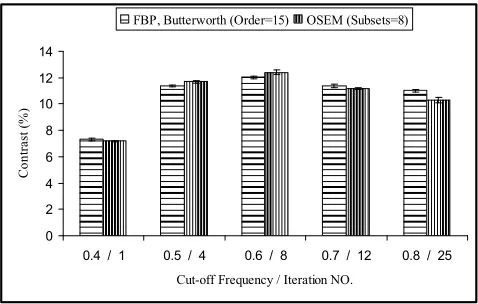
Fig. 5: Measured contrast without AC versus number of iteration in 3D OSEM and cut-off frequency in FBP with Butterworth filter with order of 15.
0 2 4 6 8 10 12 14 16
0.4 / 1 0.5 / 4 0.6 / 8 0.7 / 12 0.8 / 25
Cut-off Frequency / Iteration NO.
Co
nt
ra
st
(%
)
[image:4.612.56.295.71.223.2]FBP, Butterworth (Order=15) OSEM (Subsets=8)
Fig. 6: Measured contrast with AC versus number of iteration in 3D OSEM and cut-off frequency in FBP with Butterworth filter with order of 15.
Fig. 7 and Fig.8 show clinical scans (bone and adrenal; respectively) reconstructed with 3D OSEM and FBP with the optimum set of parameters. Visual assessment of these images reveals the higher spatial resolution obtained with 3D OSEM. Furthermore, streak artifacts are clearly visible in Fig. 7a and Fig.8a obtained with FBP.
Fig. 8: Reconstructed axial images of an adrenal scan; (a): using FBP - Metz filter (Cut-off: 0.7 / Order: 15) and (b): using 3D OSEM (Subsets: 8 / Iterations: 12).
4. CONCLUSSION
The performance of 3D OSEM algorithm with 3D beam modelling and optional attenuation correction was evaluated, and compared to the conventional image reconstruction technique (FBP). The major findings of this study are the demonstration of suitability of 3D OSEM for low count statistics studies compared to FBP, and the superiority of 3D OSEM with respect to FBP in terms of spatial resolution. Furthermore, 3D OSEM with AC may improve detectability due to significant improvement in contrast. However, caution is advised in generalising the context of this study. In clinical situations involving structurally more complex images than those obtained with a Jaszczak phantom and different diagnostic applications other results are possible. Nevertheless, we feel that the results of this investigation offer important insight into the performance of these image reconstruction techniques in SPECT imaging.
REFERENCES
[1] B. F. Hutton and Y. H. Lau, "Application of distance-dependent resolution compensation and post-reconstruction filtering for myocardial SPECT", Phys. Med. Biol., 43, pp: 1679-1693, 1998.
[2] T. Yukoi, H. Shinohara and H. Onishi, "Performance evaluation of OSEM reconstruction algorithm incorporating three-dimensional distance-dependent resolution compensation for brain SPECT: A simulation study", Annals of Nuclear Medicine, 16(1), pp: 11-18, 2002.
[image:4.612.56.295.277.421.2] [image:4.612.62.280.548.668.2][5] NEMA NU-1 2001: Performance measurements of scintillation cameras. National Electrical Manufacturers Association, 1300 North 17th Street, Suite 1752, Rosslyn, Virginia, USA. http://www.nema.org/stds/nu1.cfm
[6] TS. Pan, DS. Luo, V. Kohli and M. King, "Influence of OSEM, elliptical orbits and background activity on SPECT 3D resolution recovery", Phys. Med. Biol.; 42, pp: 2517– 2529, 1997.
[7] V. Kohli, M. King, Glick SJ, TS. Pan, "Comparison of frequency-distance relationship and Gaussian-diffusionbased method of compensation for distance-dependent spatial resolution in SPECT imaging", Phys. Med. Biol.; 43, pp: 1025–1037, 1998.
[8] S.R. Cherry, J.A. Sorenson and M.E. Phelps, Physics in nuclear medicine, Saunders, USA, 2003.
[9] B.M.W. Tsui and E.C. Frey, Analytical Image Reconstruction Methods in Emisssion Computed Tomography, Quantitative Analysis in Nuclear Medicine Imaging, H. Zaidi, Editor, Springer Sience: New York, pp: 82-106, 2005.
[10] Wells GR, King MA, Simkin PH, Judy PF, Brill AB, Gifford HC, et al. "Comparing filtered backprojection and ordered subsets expectation maximization for small-lesions detection and localization in 67Ga SPECT",J Nucl Med, 41: