Re-evaluating Automatic Metrics for Image Captioning
Mert Kilickaya, Aykut Erdem, Nazli Ikizler-Cinbis, and Erkut Erdem Hacettepe University Computer Vision Lab
Dept. of Computer Engineering, Hacettepe University, Ankara, TURKEY
[email protected],{aykut,nazli,erkut}@cs.hacettepe.edu.tr
Abstract
The task of generating natural language descriptions from images has received a lot of attention in recent years. Conse-quently, it is becoming increasingly im-portant to evaluate such image captioning approaches in an automatic manner. In this paper, we provide an in-depth evalua-tion of the existing image capevalua-tioning met-rics through a series of carefully designed experiments. Moreover, we explore the utilization of the recently proposed Word
Mover’s Distance (WMD) document
met-ric for the purpose of image captioning. Our findings outline the differences and/or similarities between metrics and their rela-tive robustness by means of extensive cor-relation, accuracy and distraction based evaluations. Our results also demonstrate
thatWMDprovides strong advantages over
other metrics.
1 Introduction
There has been a growing interest in research on integrating vision and language in natural lan-guage processing and computer vision communi-ties. As one of the key problems in this emerg-ing area, image captionemerg-ing aims at generatemerg-ing natural descriptions of a given image (Bernardi et al., 2016). This is a challenging problem since it requires the ability to not only under-stand the visual content, but also to generate a linguistic description of that content. In this regard, it can be framed as a machine trans-lation task where the source language denotes the visual domain and the target language is a specific language such as English. The re-cently proposed deep image captioning studies follow this interpretation and model the process
via an encoder-decoder architecture (Vinyals et al., 2015; Xu et al., 2015; Karpathy and Fei-Fei, 2015; Jia et al., 2015). These approaches have attained considerable success in the recent
benchmarks such as FLICKR8K (Hodosh et al.,
2013), FLICKR30K (Young et al., 2014) and MS
COCO (Lin et al., 2014) as compared to the
ear-lier techniques which explicitly detect objects and generate descriptions by using surface realization techniques (Kulkarni et al., 2013; Li et al., 2011; Elliott and Keller, 2013).
With the size of the benchmark datasets be-coming larger and larger, evaluating image cap-tioning models has become increasingly impor-tant. Human-based evaluations become obsolete as they are costly to acquire and, more impor-tantly, not repeatable. Automatic evaluation met-rics are employed as an alternative to human eval-uation in both developing new models and com-paring them against the state-of-the-art. These metrics compute a score that indicates the simi-larity/dissimilarity between an automatically gen-erated caption and a number of human-written ref-erence (gold standard) descriptions.
Some of these automatic metrics such as
BLEU (Papineni et al., 2002), ROUGE (Lin,
2004), METEOR (Banerjee and Lavie, 2005), and
TER (Snover et al., 2006) have originated from the readily available metrics for machine transla-tion and/or text summarizatransla-tion. On the contrary, the more recent metrics such asCIDEr (Vedantam
et al., 2015) andSPICE(Anderson et al., 2016) are
specifically developed for image caption evalua-tion task.
Evaluation with automatic metrics has some challenges as well. As previously analyzed in (El-liott and Keller, 2014), the existing automatic eval-uation measures have proven to be inadequate in successfully mimicking the human judgements for evaluating the image descriptions. The latest
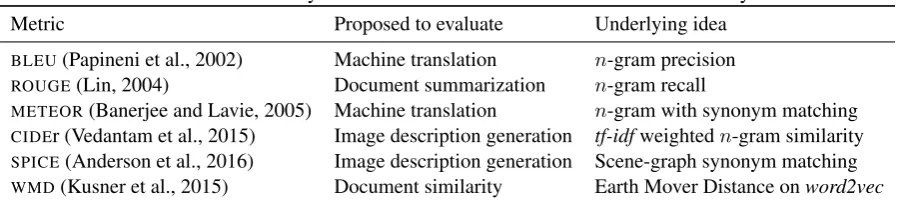
Table 1: A summary of the evaluation metrics considered in this study.
Metric Proposed to evaluate Underlying idea
BLEU(Papineni et al., 2002) Machine translation n-gram precision
ROUGE(Lin, 2004) Document summarization n-gram recall
METEOR(Banerjee and Lavie, 2005) Machine translation n-gram with synonym matching CIDEr (Vedantam et al., 2015) Image description generation tf-idfweightedn-gram similarity
SPICE(Anderson et al., 2016) Image description generation Scene-graph synonym matching
WMD(Kusner et al., 2015) Document similarity Earth Mover Distance onword2vec
uation results of 2015MS COCOChallenge on
im-age captioning has also revealed some interesting findings in line with this observation (Vinyals et al., 2016). In the challenge, the recent deep mod-els outperform the human upper bound according to automatic measures, yet they could not beat the humans when the subjective human judgements are considered. These demonstrate that we need to better understand the drawbacks of existing au-tomatic evaluation metrics. This motivates us to present an in-depth analysis of the current metrics employed in image description evaluation.
We first reviewBLEU,ROUGE,METEOR,CIDEr
and SPICE metrics, and discuss their main
draw-backs. In this context, we additionally describe
WMD metric which has been recently proposed
as a distance measure between text documents in (Kusner et al., 2015). We then investigate the performance of these automatic metrics through different experiments. We analyze how well these metrics mimic human assessments by estimat-ing their correlations with the collected human judgements. Different from the previous related work (Elliott and Keller, 2014; Vedantam et al., 2015; Anderson et al., 2016), we perform a more accurate analysis by additionally reporting the re-sults of Williams significance test. This further al-lows us to figure out the differences and/or simi-larities between a pair of metrics, whether any two metrics complement each other or provide similar results. We then test the ability of these metrics to distinguish certain pairs of captions from one an-other in reference to a ground truth caption. Next, we carry out an analysis on robustness of these metrics by analyzing how well they cope with the distractions in the descriptions (Hodosh and Hock-enmaier, 2016).
2 Evaluation Metrics
A summary of the metrics investigated in our study is given in Table 1. All these metrics
ex-cept SPICE and WMD define the similarity over
words orn-grams of reference and candidate de-scriptions by considering different formulas. On the other hand,SPICE(Anderson et al., 2016)
con-siders a scene-graph representation of an image by encoding objects, their attributes and relations
between them, and WMD leverages word
embed-dings to match groundtruth descriptions with gen-erated captions.
2.1 BLEU
BLEU(Papineni et al., 2002) is one of the first
met-rics that have been in use for measuring similarity between two sentences. It has been initially pro-posed for machine translation, and defined as the geometric mean ofn-gram precision scores multi-plied by a brevity penalty for short sentences. In our experiments, we use the smoothed version of
BLEUas described in (Lin and Och, 2004). 2.2 ROUGE
ROUGE (Lin, 2004) is initially proposed for
eval-uation of summarization systems, and this evalu-ation is done via comparing overlappingn-grams, word sequences and word pairs. In this study, we use ROUGE-L version, which basically measures
the longest common subsequences between a pair
of sentences. Since ROUGE metric relies highly
on recall, it favors long sentences, as also noted by (Vedantam et al., 2015).
2.3 METEOR
METEOR (Banerjee and Lavie, 2005) is another
machine translation metric. It is defined as the harmonic mean of precision and recall of uni-gram matches between sentences. Additionally, it makes use of synonyms and paraphrase matching.
METEOR addresses several deficiencies of BLEU
such as recall evaluation and the lack of explicit
word matching.n-gram based measures work
between reference and candidate sentences; how-ever they fail to spot semantic similarity when
the common words are scarce. METEORhandles
this issue to some extent using WordNet-based synonym matching, however just looking at syn-onyms may be too restrictive to capture overall se-mantic similarity.
2.4 CIDEr
CIDEr (Vedantam et al., 2015) is a recent
met-ric proposed for evaluating the quality of image descriptions. It measures the consensus between candidate image description ci and the reference
sentences, which is a setSi ={si1, . . . , sim}
pro-vided by human annotators. For calculating this metric, an initial stemming is applied and each sentence is represented with a set of 1-4 grams. Then, the co-occurrences ofn-grams in the refer-ence sentrefer-ences and candidate sentrefer-ence are calcu-lated. InCIDEr, similar totf-idf, then-grams that
are common in all image descriptions are down-weighted. Finally, the cosine similarity between
n-grams (referred asCIDErn) of the candidate and
the references is computed.
CIDEr is designed as a specialized metric for
image captioning evaluation, however, it works in a purely linguistic manner, and only extends ex-isting metrics withtf-idfweighting overn-grams. This sometimes causes unimportant details of a sentence to be weighted more, resulting in a rel-atively ineffective caption evaluation.
2.5 SPICE
Another recently proposed metric for evaluating image caption similarity isSPICE(Anderson et al.,
2016). It is based on the agreement of the scene-graph tuples (Johnson et al., 2015; Schuster et al., 2015) of the candidate sentence and all reference sentences. Scene-graph is essentially a semantic representation that parses the given sentence to se-mantic tokens such as object classes C, relation typesR and attribute typesA. Formally, a candi-date captioncis parsed into a scene-graph as
G(c) =hO(c), E(c), K(c)i
whereG(c)denotes the scene graph of captionc,
O(c) ⊆ C is the set of object mentions,E(c) ⊆ O(c)×R×O(c) is the set of hyper-edges rep-resenting relations between objects, and K(c) ⊆ O(c) ×A is the set of attributes associated with objects. Once the parsing is done, a set of tuples is
swimming in
have
through with mouth
dog
grey river
stick
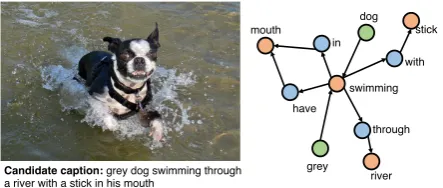
[image:3.595.307.529.62.156.2]Candidate caption: grey dog swimming through a river with a stick in his mouth
Figure 1: An example image with its Scene Graph where the parser fails to parse the candidate sen-tence accurately, which could result in wrong cal-culation ofSPICEmetric. See text for details.
formed by using the elements ofGand their pos-sible combinations. SPICEscore is then defined as
theF1-score based on the agreement between the
candidate and reference caption tuples. For tuple
matching, SPICE uses WordNet synonym
match-ing (Pedersen et al., 2004) as inMETEOR
(Baner-jee and Lavie, 2005). One problem is that the per-formance becomes quite dependent on the quality of the parsing. Figure 1 illustrates an example case of failure. Here,swimming is parsed as an object, with all its relations, and dog is parsed as an at-tribute.
2.6 WMD
Two captions may not share the same words or any synonyms; yet they can be semantically similar. On the contrary, two captions may include similar objects, attributes or relations yet they may not be semantically similar. Metrics that are currently in use fail to correctly identify and assess the quality of such cases. To address this issue, we propose to use a recently introduced document distance
mea-sure called Word Mover’s Distance (WMD)
(Kus-ner et al., 2015) for evaluating image captioning
approaches.WMDcasts the distance between
doc-uments as an instance of Earth Mover’s Distance (EMD) (Rubner et al., 2000), where travel costs
are calculated based onword2vec(Mikolov et al., 2013) embeddings of the words.
For WMD, text documents (in our case image
captions) are first represented by their normalized bag-of-words (nBOW) vectors, accounting for all
words except stopwords. More formally, each text document is represented as vectorsd ∈ Rn,
where,di= Σnci
j=1cj if a wordiappearscitimes in
the document. WMD incorporates semantic
Table 2: Drawbacks of automatic evaluation metrics for image captioning. See text for details.
Description BLEU METEOR ROUGE CIDEr SPICE WMD
original a man wearing a red life jacket is sitting in a canoe
on a lake 1 1 1 10 1 1
candidate a man wearing a life jacket is in a small boat on a
lake 0.45 0.28 0.67 2.19 0.40 0.19
synonyms aguywearing a lifevestis in a small boat on a
lake 0.20 0.17 0.57 0.65 0.00 0.10
redundancy a man wearing a life jacket is in a small boat on a
lakeat sunset 0.45 0.28 0.66 2.01 0.36 0.18
word order in a small boat on a lakea man is wearing a life
jacket 0.26 0.26 0.38 1.32 0.40 0.19
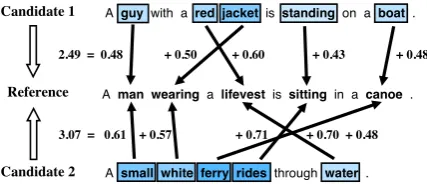
Candidate 1
A man wearinga lifevest is sittingin a canoe. A guywith a red jacketis standingon a boat .
A small white ferry ridesthroughwater .
2.49 = 0.48 + 0.50 + 0.60 + 0.43 + 0.48
3.07 = 0.61 + 0.57 + 0.71 + 0.70 + 0.48
Reference
Candidate 2
Figure 2: An illustration of the distance
calcula-tion ofWMDmetric comparing two candidate
cap-tions with a reference caption.
word2vecembedding space. Specifically, the
dis-tance between word i and word j in two
docu-ments is set as the Euclidean distance between
each of the corresponding word2vecembeddings
xi andxj,i.e.,c(i, j) =kxi−xjk2.
The distances between words serve as build-ing blocks to define distances between documents, hence captions. The flow between word vectors is defined with the sparse flow matrix T ∈ Rn×n,
withTij representing the travel amount of wordi
to word j. The distance between two documents
is then defined withΣi,jTijc(i, j), i.e. the
mini-mum cumulative cost required to move all words between documents. This minimum cumulative cost is found by solving the corresponding linear optimization problem, which is cast as a special case ofEMDmetric (Rubner et al., 2000). An
ex-ample matching result is shown in Figure 2. By usingword2vecembeddings, semantic similarities between words are more accurately identified. In our experiments, we convert the distance scores to similarities by using a negative exponential.
2.7 Drawbacks of the metrics
In order to illustrate the drawbacks of these au-tomatic evaluation metrics, we provide an
exam-ple case in Table 2. In this table, an original cap-tion is given, together with the upper bound val-ues for each metric,i.e.when this original caption is compared to itself. The second line includes a candidate caption that is semantically very simi-lar to the original one and the corresponding sim-ilarity scores according to evaluation metrics. We then modify the candidate sentence slightly and observe how the metric scores are affected from these small modifications. First, we observe that all the scores decrease when some words are re-placed with their synonyms. The change is espe-cially significant forSPICEandCIDEr. In this
ex-ample, failure of SPICEis likely due to incorrect
parsing or the failure of synonym matching. On the other hand, failure of CIDEr is likely due to
unbalancedtf-idfweighting. Second, we observe
that the metrics are not affected much from the in-troduction of additional (redundant) words in the sentences. However, when the order of the words are changed, we see thatBLEU,ROUGEandCIDEr
scores decrease notably, due to their dependence
onn-gram matching. Note that, WMDandSPICE
are not influenced from the change in word order.
3 Evaluation and Discussion 3.1 Quality
[image:4.595.78.292.236.328.2]lin-ear, and Kendall’s correlation, which is another rank correlation measure.
The above correlation analysis is a well-established practice for automatic metric evalua-tion, but it is not complete in the sense that it is not meaningful to draw conclusions from it about the differences or similarities between a pair of met-rics. That is, comparing the corresponding corre-lations relative to each other does not say much since they are both computed on the same dataset, and thus not independent. To address this issue, Graham and Baldwin (2014) have suggested to use Williams significance test (Williams, 1959), which also takes into account the degree to which the two metrics correlate with each other, and can reveal whether one metric significantly outperforms the other. The test has shown to be valuable for eval-uation of document and segment-level machine translation (Graham and Baldwin, 2014; Graham et al., 2015; Graham and Liu, 2016) and summa-rization metrics (Graham, 2015). In this study, we extend the previous correlation-based evalua-tions of image captioning metrics by providing a more conclusive analysis based on Williams sig-nificance test.
Williams test (Williams, 1959) calculates the statistical significance of differences in dependent correlations, and formulated as testing whether the population correlation betweenX1andX3 equals the population correlation betweenX2 andX3:
t(n−3) = (r13−r23)
p
(n−1)(1 +r12)
q
2K(n−1
n−3) +(r23+r13)
2
4 (1−r12)3
(1) where rij is the correlation betweenXi andXj,
andnis the size of the population, with
K= 1−r2
12−r132 −r223+ 2r12r13r23. (2)
To analyze statistical significance in the au-tomatic metrics listed in Section 2, we use the publicly available FLICKR-8K (Elliott and Keller,
2014) and COMPOSITE (Aditya et al., 2015)
datasets, which we describe below. We note that in our experiments, we first lowercase and tok-enize the candidate and reference captions using
ptbtokenizer.pyscript fromMS COCO
eval-uation tools1. We use the implementations of the metrics from the same evaluation kit with the
ex-1https://github.com/peteanderson80/
coco-caption
ception ofWMD. For theWMDmetric, we employ
the code provided by Kusner et al. (2015)2.
FLICKR-8K3 dataset contains quality
judge-ments for 5822 candidate sentences for the images in its test set (Hodosh et al., 2013). These judge-ments are collected from 3 human experts and they are on a scale of[1,4], with a score of 1 denoting a description totally unrelated to the image con-tent, and 4 meaning a perfect description for the image. Candidate captions are all obtained from a retrieval based model, hence they are grammati-cally correct.
COMPOSITE4 dataset contains human
judge-ments for 11,985 candidate captions for the sub-sets ofFLICKR-8K(Hodosh et al., 2013),FLICKR
-30K (Young et al., 2014) and MS COCO (Lin et
al., 2014) datasets. The AMT workers were asked to judge the candidate caption for an image us-ing two aspects: (i)correctness, and (ii) thorough-ness of the candidate caption, both on a scale of [1,5]where 1 means not relevant/less detailed and 5 denotes the candidate caption perfectly describ-ing the image. Candidate captions were sampled from the human reference captions and the cap-tioning models in (Aditya et al., 2015; Karpathy and Fei-Fei, 2015).
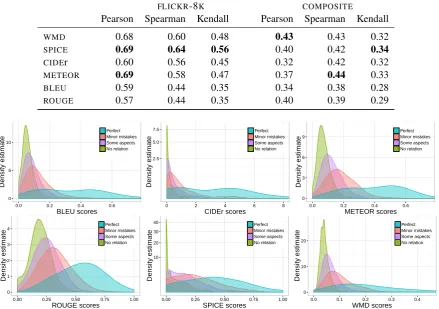
Table 3 shows Pearson’s, Spearman’s and Kendall’s correlation of the metrics with the
hu-man judgements in FLICKR-8K and COMPOSITE
datasets. ForFLICKR-8K, we follow the
method-ology in (Elliott and Keller, 2014) and compute correlations with the human expert scores. On the
other hand. for COMPOSITE, we report the mean
of the correlations withcorrectnessand thorough-nessscores. In terms of these correlations, while
SPICEproduces the highest quality comparisons in FLICKR-8K,WMDandMETEORgive better results
in COMPOSITE in general. However, if one
fur-ther inspects the score distributions of the metrics (onFLICKR-8Kdataset) shown in Figure 3, while SPICEcan identify irrelevant captions remarkably
well, it can not effectively distinguish bad captions from relatively better ones.
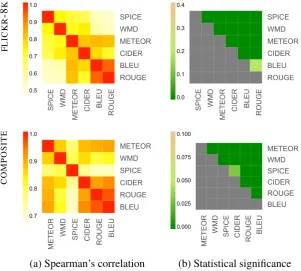
In Figure 4(a), we show Spearman’s correlation between each pair of metrics, where the metrics are ordered from highest to lowest correlation with
2https://github.com/mkusner/wmd
3https://github.com/elliottd/
compareImageDescriptionMeasures
4https://imagesdg.wordpress.com/
Table 3: Correlation between automatic image captioning metrics and human judgement scores.
FLICKR-8K COMPOSITE
Pearson Spearman Kendall Pearson Spearman Kendall
WMD 0.68 0.60 0.48 0.43 0.43 0.32
SPICE 0.69 0.64 0.56 0.40 0.42 0.34
CIDEr 0.60 0.56 0.45 0.32 0.42 0.32
METEOR 0.69 0.58 0.47 0.37 0.44 0.33
BLEU 0.59 0.44 0.35 0.34 0.38 0.28
ROUGE 0.57 0.44 0.35 0.40 0.39 0.29
0 5 10
0.0 0.2 0.4 0.6
BLEU scores
Density estimate
Perfect Minor mistakes Some aspects No relation
2.5 5.0 7.5
0 2 4 6 8
CIDEr scores
Density estimate
Perfect Minor mistakes Some aspects No relation
0 3 6 9
0.0 0.2 0.4 0.6
METEOR scores
Density estimate
Perfect Minor mistakes Some aspects No relation
0 1 2 3 4
0.00 0.25 0.50 0.75 1.00
ROUGE scores
Density estimate
Perfect Minor mistakes Some aspects No relation
10 20 30 40
0.00 0.25 0.50 0.75 1.00
SPICE scores
Density estimate
Perfect Minor mistakes Some aspects No relation
0 10 20
0.0 0.1 0.2 0.3 0.4
WMD scores
Density estimate
Perfect Minor mistakes Some aspects No relation
Figure 3: Score distributions of the metrics onFLICKR-8Kdataset. Four different rating scales are used:
1 for no relation, 2 for minor mistakes, 3 for some true aspects and 4 for perfect match. For CIDEr
andSPICE metrics, square-root transform is performed on they-axis to better illustrate how the score
distributions overlap with each other.
human judgements5. Overall, the pairwise corre-lations are generally high for both datasets. We additionally observe that the metrics which de-pend on similar structures are grouped together
using these correlations. For example, the n
-gram based metrics BLEU and ROUGE provide
scores that are highly correlated with each other forFLICKR-8K. The correlations withinCOMPOS -ITE dataset are even very high for all the metrics
that considern-grams, namely BLEU,CIDEr,ME -TEOR andROUGE. On the other hand, the
corre-lations of these metrics against SPICE and WMD
are not that high. Moreover , the pairwise
correla-tions betweenSPICE andWMD are relatively low
as well. All these findings suggest that these three groups of metrics, then-gram based metrics, the
scene-graph basedSPICEand the word embedding
5Here, we only report Spearman’s correlation since, com-pared to Pearson’s, it provides a more consistent ranking of the metrics across the two datasets, and is similar to Kendall’s correlation.
basedWMD, can be complementary to each other.
Finally, in Figure 4(b), we provide the results of Williams significance test, which compares two different metrics with respect to their correlations against human judgements. Our results show that all the metric pairs have a significant difference in correlation with human judgement at p < 0.05. This reveals that the pair of metrics which has close correlation scores with human judgements
(e.g. SPICEandWMD inFLICKR-8K dataset) are
found to be statistically different than each other. These findings collectively support our previous conclusion that all metrics considered here can complement each other in evaluating the quality of the generated captions.
3.2 Accuracy
FL
IC
K
R
-8
K
C
O
M
PO
SI
T
E
[image:7.595.147.449.64.335.2](a) Spearman’s correlation (b) Statistical significance
Figure 4: Significance test results for pairs of automatic metrics onFLICKR-8KandCOMPOSITEdatasets.
(a) Spearman correlation between pairs of metrics; and (b)p-value of Williams significance tests, green cells indicate a significant win for metric in row i over metric in column j.
a groundtruth caption. We employ the human consensus scores while evaluating the accuracies. In particular, for evaluation, a triplet of tions, one reference and two candidate descrip-tions, is shown to human subjects and they are asked to determine the candidate description that is more similar to the reference. A metric is ac-curate if it provides a higher score to the descrip-tion chosen by the human subject as being more similar to the reference caption. For this analy-sis, we carry out our experiments onPASCAL-50S
and ABSTRACT-50S datasets6. We consider
dif-ferent kinds of pairs such as (human-human cor-rect) HC, human incorcor-rect) HI, (human-machine) HM, and (machine-(human-machine) MM. As the candidate sentences are generated by both hu-mans and machines, each test scenario has a dif-ferent level of difficulty.
ABSTRACT-50S(Vedantam et al., 2015) dataset
is a subset of the Abstract Scenes Dataset (Zit-nick and Parikh, 2013), which includes 500 im-ages containing clipart objects in everyday scenes. Each image is annotated with 50 different descrip-tions. For evaluation, 48 of these 50 descriptions are used as reference descriptions and the
remain-6http://vrama91.github.io/cider
ing 2 descriptions are employed as candidate de-scriptions. For 400 pairs of these descriptions, hu-man consensus scores are available, with the first 200 are for HC and the remaining 200 are for HI.
PASCAL-50S (Vedantam et al., 2015) dataset
is an extended version of the Pascal Sen-tences (Farhadi et al., 2010) dataset that con-tains 1000 images from PASCAL Object Detec-tion challenge (Everingham et al., 2010) of 20 different object classes like person, car, horse, etc. This version includes 50 captions per image and human judgements for 4000 candidate pairs for the aforementioned binary-forced choice task, which are all collected through Amazon Mechan-ical Turk (AMT). For this dataset, all four differ-ent categories are available, having 1000 pairs for each category.
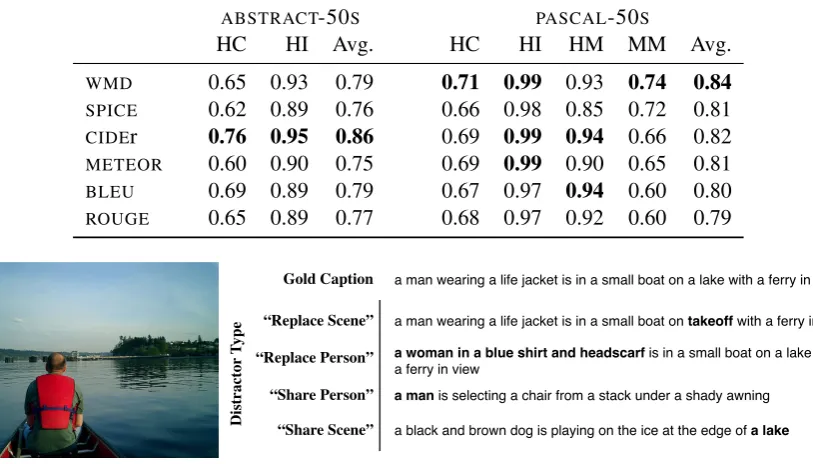
In Table 4, we present caption-level classifica-tion accuracy scores of automatic evaluaclassifica-tion met-rics at matching human consensus scores. On
ABSTRACT-50Sdataset, theCIDEr metric
outper-forms all other metrics in both HC and HI cases.
On the other hand, on PASCAL-50S dataset, the
WMD metric gives the best scores in three out of
chal-Table 4: Description-level classification accuracies of automatic evaluation metrics.
ABSTRACT-50S PASCAL-50S
HC HI Avg. HC HI HM MM Avg.
WMD 0.65 0.93 0.79 0.71 0.99 0.93 0.74 0.84
SPICE 0.62 0.89 0.76 0.66 0.98 0.85 0.72 0.81
CIDEr 0.76 0.95 0.86 0.69 0.99 0.94 0.66 0.82
METEOR 0.60 0.90 0.75 0.69 0.99 0.90 0.65 0.81
BLEU 0.69 0.89 0.79 0.67 0.97 0.94 0.60 0.80
ROUGE 0.65 0.89 0.77 0.68 0.97 0.92 0.60 0.79
a man wearing a life jacket is in a small boat on a lake with a ferry in view
a man wearing a life jacket is in a small boat on takeoffwith a ferry in view
a woman in a blue shirt and headscarf is in a small boat on a lake with a ferry in view
a man is selecting a chair from a stack under a shady awning
a black and brown dog is playing on the ice at the edge of a lake
Gold Caption
“Replace Scene”
“Share Person” “Replace Person”
“Share Scene”
D
is
tr
ac
tor
T
yp
[image:8.595.75.509.83.317.2]e
[image:8.595.93.500.85.317.2]Figure 5: Distracted versions of an image descriptions for a sample image.
Table 5: Distraction analysis.
Case # Instances BLEU METEOR ROUGE CIDEr SPICE WMD
Replace-Scene 2514 0.62 0.69 0.63 0.83 0.54 0.76
Replace-Person 5817 0.73 0.77 0.78 0.78 0.67 0.80
Share-Scene 2621 0.79 0.85 0.79 0.81 0.70 0.87
Share-Person 4596 0.78 0.85 0.78 0.83 0.67 0.88
Overall 15548 0.73 0.79 0.75 0.81 0.65 0.83
lenging MM and HC cases, which require distin-guishing fine-grained differences between descrip-tions. On average, the performances of all the other metrics are very similar to each other.
3.3 Robustness
In this section, we evaluate the robustness of the automatic image captioning metrics. For this purpose, we employ the binary (two-alternative) forced choice task introduced in (Hodosh and Hockenmaier, 2016) to compare the existing im-age captioning models. For a given imim-age, this task involves distinguishing a correct description from its slightly distracted incorrect versions. In our case, a robust image captioning metric should always choose the correct caption over the dis-tracted ones.
In our experiments, we use the data7 provided
7http://nlp.cs.illinois.edu/
HockenmaierGroup/Papers/VL2016/
HodoshHockenmaier16_BinaryTasks_Data.tar
by the authors for a subset of FLICKR-30K
(Ho-dosh et al., 2013). Specifically, we consider four different types of distractions for the im-age descriptions, namely 1) Replace-Scene, 2) Replace-Person, 3) Scene, and 4) Share-Person, which results 15548 correct and distracted caption pairs in total. For Replace-Scene and Replace-Person tasks, the distracted descriptions were artificially constructed by replacing the main actor (first person) and the scene in the orig-inal caption by random person and scene ele-ments, respectively. For Scene and Share-Person tasks, the distracted captions were se-lected from the sentences from the training part of
FLICKR-30K (Young et al., 2014) dataset whose
[image:8.595.116.481.366.459.2]captions for that image by considering tested eval-uation metrics, and then estimate an average accu-racy score. In Table 5, we present the classifica-tion accuracies of the evaluaclassifica-tion metrics for each
distraction type. As can be seen, the WMD
met-ric gives the best results for three out of four cate-gories, and provides the second best result for the
Replace-Scene case. Overall,METEORandCIDEr
metrics seem to be also robust to these
distrac-tions. The very recently proposed SPICE metric
performs the worst for this task. This is somewhat expected as it is even affected by the use of syn-onyms of the words as we have previously shown in Table 2.
3.4 Discussion
As the experiments on quality, accuracy and ro-bustness tests demonstrate in Sections 3.1-3.3, ex-isting automatic image captioning metrics all have some strengths and weaknesses due to their
de-sign choices. For example, whileSPICE,METEOR
and WMD give the best performances in terms
of our correlation analysis against human judge-ments, CIDEr andWMD provide the best
classifi-cation scores for our accuracy experiments.
More-over, CIDEr, METEOR and WMD are found to be
less affected by the distractors. Overall, our anal-ysis suggests that the recently proposedWMD
doc-ument metric is also quite effective for image cap-tioning since it has high correlations with the hu-man scores, is much less sensitive to synonym swapping and additionally performs well at the ac-curacy and distraction tasks.
Our analysis also shows that the existing met-rics both theoretically and empirically differ from each other with significant differences. Compared to the recent results of significance testing of ma-chine translation and summarization metrics (Gra-ham and Baldwin, 2014; Gra(Gra-ham et al., 2015; Graham and Liu, 2016; Graham, 2015), our re-sults suggest that there remains much room for improvement in developing more effective im-age captioning evaluation metrics. We leave this for future work, but a very naive idea would be combining different metrics into a unified met-ric and we simply test this idea using score combination, after normalizing the score of each metric to the range [0,1]. Among all possible combinations, we find that the combination of
WMD+SPICE+METEOR performs the best with a
Spearman’s correlation of 0.66 forFLICKR-8Kand
0.45 forCOMPOSITEdataset, yielding an
improve-ment from SPICE (0.64 and 0.42). In addition,
we should add that this unified metric significantly outperforms the individual metrics according to Williams test (p <0.01).
4 Conclusion
In this paper, we provide a careful evaluation of the automatic image captioning metrics, and
pro-pose to use WMD, which utilizes word2vec
em-beddings of the words to compute a semantic similarity of sentences. We highlight the draw-backs of the existing metrics, and we empirically show that they are significantly different than each other. We hope that this work motivates further research into developing better evaluation metrics, probably learning based ones, as previously stud-ied in machine translation literature (Kotani and Yoshimi, 2010; Guzm´an et al., 2015). We also observe that incorporating visual information (via
Scene-graph used by SPICE) and semantic
infor-mation (viaWMD) is useful for the caption
evalu-ation task, which motivates the use of multimodal embeddings (Kottur et al., 2015).
Acknowledgments
We thank the anonymous reviewers for their valu-able comments. This work is supported in part by The Scientific and Technological Research Council of Turkey (TUBITAK), with award no 113E116.
References
Somak Aditya, Yezhou Yang, Chitta Baral, Cor-nelia Fermuller, and Yiannis Aloimonos. 2015. From images to sentences through scene description graphs using commonsense reasoning and knowl-edge. arXiv preprint arXiv:1511.03292.
Peter Anderson, Basura Fernando, Mark Johnson, and Stephen Gould. 2016. SPICE: Semantic proposi-tional image caption evaluation. InECCV.
Satanjeev Banerjee and Alon Lavie. 2005. METEOR: An automatic metric for mt evaluation with im-proved correlation with human judgments. InACL Workshop on intrinsic and extrinsic evaluation mea-sures for machine translation and/or summarization, volume 29, pages 65–72.
2016. Automatic description generation from im-ages: A survey of models, datasets, and evaluation measures. JAIR, 55:409–442.
Desmond Elliott and Frank Keller. 2013. Image de-scription using visual dependency representations. InEMNLP, volume 13, pages 1292–1302.
Desmond Elliott and Frank Keller. 2014. Comparing automatic evaluation measures for image descrip-tion. InACL, pages 452–457.
Mark Everingham, Luc Van Gool, Christopher KI Williams, John Winn, and Andrew Zisserman. 2010. The Pascal visual object classes (VOC) chal-lenge. IJCV, 88(2):303–338.
Ali Farhadi, Mohsen Hejrati, Mohammad Amin Sadeghi, Peter Young, Cyrus Rashtchian, Julia Hockenmaier, and David Forsyth. 2010. Every pic-ture tells a story: Generating sentences from images. InECCV, pages 15–29.
Yvette Graham and Timothy Baldwin. 2014. Testing for significance of increased correlation with human judgment. InEMNLP, pages 172–176.
Yvette Graham and Qun Liu. 2016. Achieving accu-rate conclusions in evaluation of automatic machine translation metrics. InNAACL-HLT.
Yvette Graham, Nitika Mathur, and Timothy Baldwin. 2015. Accurate evaluation of segment-level ma-chine translation metrics. InNAACL-HLT.
Yvette Graham. 2015. Re-evaluating automatic sum-marization with BLEU and 192 shades of ROUGE. InEMNLP, pages 128–137.
Francisco Guzm´an, Shafiq Joty, Llu´ıs M´arquez, and Preslav Nakov. 2015. Pairwise neural machine translation evaluation. InACL-IJNLP, pages 805– 814.
Micah Hodosh and Julia Hockenmaier. 2016. Focused evaluation for image description with binary forced-choice tasks. InVL.
Micah Hodosh, Peter Young, and Julia Hockenmaier. 2013. Framing image description as a ranking task: Data, models and evaluation metrics. JAIR, 47:853– 899.
Xu Jia, Efstratios Gavves, Basura Fernando, and Tinne Tuytelaars. 2015. Guiding long-short term mem-ory for image caption generation. arXiv preprint arXiv:1509.04942.
Justin Johnson, Ranjay Krishna, Michael Stark, Li-Jia Li, David A Shamma, Michael S Bernstein, and Li Fei-Fei. 2015. Image retrieval using scene graphs. InCVPR, pages 3668–3678.
Andrej Karpathy and Li Fei-Fei. 2015. Deep visual-semantic alignments for generating image descrip-tions. InCVPR, pages 3128–3137.
Katsunori Kotani and Takehiko Yoshimi. 2010. A ma-chine learning-based evaluation method for mama-chine translation. InSETN, pages 351–356.
Satwik Kottur, Ramakrishna Vedantam, Jos´e MF Moura, and Devi Parikh. 2015. Visual Word2Vec (vis-w2v): Learning visually grounded word em-beddings using abstract scenes. arXiv preprint arXiv:1511.07067.
Girish Kulkarni, Visruth Premraj, Vicente Ordonez, Sagnik Dhar, Siming Li, Yejin Choi, Alexander C Berg, and Tamara L Berg. 2013. Babytalk: Un-derstanding and generating simple image descrip-tions. IEEE Trans. Pattern Anal. Mach. Intel., 35(12):2891–2903.
Matt J. Kusner, Yu Sun, Nicholas I. Kolkin, and Kil-ian Q. Weinberger. 2015. From word embeddings to document distances. InICML, pages 957–966.
Siming Li, Girish Kulkarni, Tamara L. Berg, Alexan-der C. Berg, and Yejin Choi. 2011. Composing sim-ple image descriptions using web-scale n-grams. In CoNLL, pages 220–228.
Chin-Yew Lin and Franz Josef Och. 2004. Auto-matic evaluation of machine translation quality us-ing longest common subsequence and skip-bigram statistics. InACL, pages 605–612.
Tsung-Yi Lin, Michael Maire, Serge Belongie, James Hays, Pietro Perona, Deva Ramanan, Piotr Doll´ar, and C Lawrence Zitnick. 2014. Microsoft COCO: Common objects in context. InECCV, pages 740– 755.
Chin-Yew Lin. 2004. ROUGE: A package for auto-matic evaluation of summaries. InText summariza-tion branches out: Proceedings of the ACL-04 work-shop, volume 8.
T. Mikolov, K. Chen, G. Corrado, and J. Dean. 2013. Distributed representations of words and phrases and their compositionality. InNIPS.
Kishore Papineni, Salim Roukos, Todd Ward, and Wei-Jing Zhu. 2002. BLEU: a method for automatic evaluation of machine translation. In ACL, pages 311–318.
Ted Pedersen, Siddharth Patwardhan, and Jason Miche-lizzi. 2004. Wordnet::similarity:measuring the re-latedness of concepts. InDemonstration papers at HLT-NAACL 2004, pages 38–41.
Yossi Rubner, Carlo Tomasi, and Leonidas J. Guibas. 2000. The earth mover’s distance as a metric for image retrieval. IJCV, 40(2):99–121.
Matthew Snover, Bonnie Dorr, and Richard Schwartz. 2006. A study of translation edit rate with targeted human annotation. InAMTA.
Ramakrishna Vedantam, C Lawrence Zitnick, and Devi Parikh. 2015. Cider: Consensus-based image de-scription evaluation. InCVPR, pages 4566–4575. Oriol Vinyals, Alexander Toshev, Samy Bengio, and
Dumitru Erhan. 2015. Show and tell: A neural im-age caption generator. InCVPR, pages 3156–3164. Oriol Vinyals, Alexander Toshev, Samy Bengio, and
Dumitru Erhan. 2016. Show and Tell: Lessons learned from the 2015 MSCOCO image captioning challenge. arXiv preprint arXiv:1609.06647. Evan J. Williams. 1959. Regression analysis,
vol-ume 14. Wiley New York.
Kelvin Xu, Jimmy Ba, Ryan Kiros, Kyunghyun Cho, Aaron Courville, Ruslan Salakhutdinov, Richard S. Zemel, and Yoshua Bengio. 2015. Show, attend and tell: Neural image caption generation with visual at-tention. arXiv preprint arXiv:1502.03044.
Peter Young, Alice Lai, Micah Hodosh, and Julia Hockenmaier. 2014. From image descriptions to vi-sual denotations: New similarity metrics for seman-tic inference over event descriptions. TACL, 2:67– 78.