Shortest-Path Graph Kernels for Document Similarity
Giannis Nikolentzos ´Ecole Polytechnique and AUEB
Polykarpos Meladianos ´Ecole Polytechnique and AUEB
Franc¸ois Rousseau ´Ecole Polytechnique
Michalis Vazirgiannis ´Ecole Polytechnique and AUEB
Yannis Stavrakas IMIS / RC ATHENA
Abstract
In this paper, we present a novel docu-ment similarity measure based on the def-inition of a graph kernel between pairs of documents. The proposed measure takes into account both the terms contained in the documents and the relationships be-tween them. By representing each doc-ument as a graph-of-words, we are able to model these relationships and then de-termine how similar two documents are by using a modified shortest-path graph kernel. We evaluate our approach on two tasks and compare it against several baseline approaches using various perfor-mance metrics such as DET curves and macro-average F1-score. Experimental re-sults on a range of datasets showed that our proposed approach outperforms tradi-tional techniques and is capable of mea-suring more accurately the similarity be-tween two documents.
1 Introduction
In recent years, we have witnessed a tremendous growth in the volume of textual documents avail-able on the Web. With this rapid increase in the number of available content, new opportunities for knowledge extraction have arisen. Many text min-ing tasks such as information retrieval, text catego-rization and document clustering involve the direct comparison of two documents. It is thus crucial to be able to determine accurately how similar two documents are by defining a document similarity measure.
Generally speaking, a similarity measure is a real-valued function that quantifies the common
information shared by two objects (in our case documents). Determining the similarity between two documents is not a trivial task. Whether two documents are similar or different is not always clear and may vary from application to applica-tion.
Similarity measures that make use of the vector-space model (Salton et al.,1975) treat words in a document as if they were independent of one an-other, which is not realistic. In fact, words relate to one another to form meaningful phrases and to develop ideas. It is known that the human brain utilizes these relations between words to facilitate understanding (Altmann and Steedman,1988). In general, we assume that two terms are related if they co-occur together in a small context, typi-cally a phrase or a window of specific size, which resulted in n-gram features in many text mining tasks (ann-gram is a sequence of nterms in this paper). Butn-grams correspond to sequences of words and thus fail to capture word inversion and subset matching (e. g., “article about news” vs. “news article”). To take into account these statis-tical relations, we propose to represent each doc-ument as a graph-of-words instead. And then, in order to measure the similarity between two doc-uments, we capitalize on recent advances in graph kernels. Kernels can be thought of as measures of similarity between pairs of objects (Sch¨olkopf and Smola, 2002). A graph kernel is a kernel func-tion that measures the similarity between pairs of graphs.
Our aim in this paper is neither to define a sim-ilarity measure for only a certain category of doc-uments based on background knowledge and fea-tures specific to that field nor to improve similar-ity estimation by using external knowledge.
stead, we propose to define a similarity measure that does not incorporate any background or ex-ternal knowledge. Hence it is, without changes, applicable to all types of textual documents even if they come from different areas. The method takes as input a pair of documents and automati-cally computes how similar they are to each other based solely on their content.
The rest of this paper is organized as follows. Section2provides an overview of the related work and elaborates our contribution. Section 3 pro-vides a detailed description of our proposed graph-of-words kernel. Section4evaluates the proposed approach on a wide range of tasks. Finally, Sec-tion5summarizes the work and presents potential future work.
2 Related Work
In this section, we review the related work published in the areas of document similarity,
graph kernels, kernel-based text categorization
andgraph-based text categorization.
2.1 Document Similarity
There has been a variety of similarity measures de-fined to assess how close two objects are to each other, including documents. Let< d1, d2 >be a
pair of documents andD1 (resp. D2) the set of
terms in d1 (resp. d2). Common similarity
mea-sures discussed by Manning (1999) are defined as follows:
Matching(d1, d2) =|D1∩D2|
Dice(d1, d2) = 2|D|D1∩D2| 1|+|D2|
Jaccard(d1, d2) = ||DD1∩D2| 1∪D2|
Overlap(d1, d2) = min|D(|1D∩D2| 1|,|D2|)
Cosine(d1, d2) = p|D1∩D2| |D1| × |D2|
The terms might be processed unigrams as well as processedn-grams present in the text. The set of operations described above are equivalent to vector operations when representingd1 andd2 as
binary vectors.
2.2 Graph Kernels
Graph kernels are instances of the R-convolution kernels introduced by Haussler (1999).
Convo-lution kernels have been proposed as a princi-pled way of designing kernels on structured ob-jects, such as sequences, trees and graphs. Graph kernels compute the similarity between pairs of graphs, based on common substructures they share. A wide variety of substructures has been proposed, such as random walks (G¨artner et al., 2003;Vishwanathan et al., 2010), shortest paths (Borgwardt and Kriegel, 2005), subtrees (Ramon and G¨artner,2003), cycles (Horv´ath et al.,2004), and graphlets (Shervashidze et al.,2009).
2.3 Kernel-based Text Categorization
In recent years, there has been a great deal of work in using kernel methods, such as SVMs for text classification (Joachims,1998;Dumais et al., 1998). Such work concentrates on building spe-cialized kernels aimed at measuring similarity be-tween documents. We outline some of these ap-proaches below.
se-quences of words and we used a graph kernel in-stead of a sequence kernel to measure the similar-ity between pairs of documents. Other text cate-gorization works use kernels that measure the se-mantic similarity between concepts extracted from the text (Bleik et al.,2013;Wang and Domeniconi, 2008).
2.4 Graph-based Text Categorization
Our work is also related to methods that repre-sent documents as graphs and perform graph min-ing tasks to achieve improved classification per-formance. These methods either extract frequent subgraphs which are then used to produce fea-ture vectors for the documents (Jiang et al.,2010; Rousseau et al., 2015) or they determine term weights to be used in the vector-space model based on centrality criteria or random walks (Hassan et al.,2007;Malliaros and Skianis,2015).
3 A Graph Kernel for Document Similarity
In this section, we first discuss the essential def-initions from graph theory. We then present our graph-of-words model for representing tex-tual documents. And finally, we define our cus-tom Shortest-Path Graph Kernel (SPGK) capable of measuring the similarity between pairs of doc-uments.
3.1 Graph Concepts
LetG= (V,E)be an undirected and unweighted graph consisting of a set V of vertices and a set
E of edges between them. In this paper, we will denote bynthe number of vertices and bymthe number of edges.
A labeled graph is a graph with labels on ver-tices and/or edges. Given a set of labels L, ` :
V → L is a function that assigns labels to the and/or edges of the graph. In our case, we deal with fully-labeled graphs as labels are assigned both to vertices and to edges.
A graph Gcan be represented by its adjacency matrixA. The(i, j)thentry ofAis1if the edge
(vi, vj) between vertices vi and vj exists, and 0 otherwise.
A walk in a graph G is a sequence of vertices v1, v2, . . . , vk+1wherevi ∈ V and(vi, vi+1) ∈ E
for1≤ i≤k. The length of the walk is equal to the number of edges in the sequence, i. e. kin the above case. A walk in whichvi 6= vj ⇔ i 6= j
is called a path. In other words, a path is a walk without repetition of nodes.
3.2 Graph-of-words
We chose to represent each textual document as a statistical graph-of-words, following earlier ap-proaches in keyword extraction (Ohsawa et al., 1998; Mihalcea and Tarau, 2004) and more re-cent ones in ad hoc IR (Blanco and Lioma,2012; Rousseau and Vazirgiannis,2013) and in summa-rization (Meladianos et al.,2015).
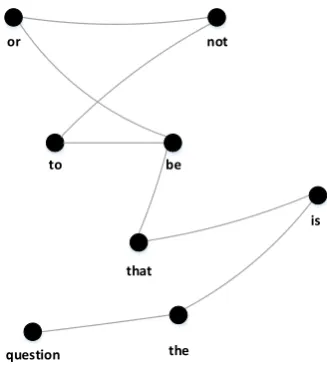
The construction of each graph is preceded by a preprocessing phase where standard text process-ing tasks such as tokenization, stopword, punctua-tion and special character removal, and stemming are performed. The processed document is then transformed into an unweighted, undirected graph whose vertices represent unique terms and whose edges represent co-occurrences between the con-nected terms within a fixed-size window (hence the statistical denomination). The graph-of-words representation of text provides enhanced model-ing capabilities compared to the bag-of-words rep-resentation. Besides the terms (vertices), it also models the relationships between them (edges). All the words present in a document have some relationships with one another, modulo a window size outside of which the relationship is not taken into consideration, and graphs are able to capture these dependencies. The extended modeling capa-bilities, however, come with an increase in com-plexity.
An example of a document represented as an unweighted undirected graph is given in Figure1. The source text comes from Shakespeare’s play “Hamlet”: “to be or not to be: that is the ques-tion”. For illustration purposes, only the colon is removed and no other text processing tasks are performed. The size of the window is set to 2, i. e. it captures bigram relationships. Hence, each word (vertex) is connected with an edge with its previous and its next word, if any.
3.3 Shortest-Path Graph-of-words Kernel (SPGK)
to be
or not
that
is
[image:4.595.96.260.72.255.2]the question
Figure 1: Example of the graph representation of a textual document.
we modify it to compare the graph representations of pairs of documents.
The first step of our proposed approach is to transform the graph-of-words representation of each documentGinto another graphCwhose ver-tices are connected with an edge only if the short-est distance between them is not greater than a variabled. The emerging graph contains the same set of vertices as the graph-of-words from which it was generated. However, there exist edges only between vertices that are connected by a path of length at mostd. Every node inCis labeled by the term that it represents, while every edge between two vertices is labeled by the shortest distance be-tween these vertices given that it is no greater than d. Specifically, the label of an edge ethat links two vertices whose shortest path ispis set equal to label(e) =1/p. Ford= 1, the emerging network
is equivalent in a structural sense to its correspond-ing graph-of-words. For greater values ofd, it is very likely that the number of edges of the graph will have increased compared to its predecessor.
The commonly-used unigram bag-of-words representation assumes that words in a document are independent of one another. Although sim-ilarity measures based on this assumption have shown to work well in practice in many fields, it is not rational to completely ignore word order and word dependence. Hence, the distance between two terms in a document determines their rela-tionship. This led us to explore alternative
doc-ument similarity metrics that take into account the co-occurrence of words in the documents. More specifically, we assume that two terms are re-lated given that they appear together inside a win-dow. The underlying assumption is that each word present in a document has some relationship with the other words that are close to it. We set the size of the window over the processed text equal to2. Therefore, in our graph-of-words representation of a document, each term is linked with its preceding and its following term with an edge. In our trans-formed graphs, terms are not only connected with terms that are next to them, but also with terms that are close to their neighbors (d = 2), with lower label values, and close to neighbors of their neigh-bors (d= 3), with even lower label values. Param-eterddetermines how far from the initial terms we allow the paths to go. Our intuition is that given an initial term, terms that are close to terms that are close to the initial term or beyond, may have also some relation with the initial term, and the strength of this relation decreases as the shortest path length increases. Therefore, although the pro-posed kernel does not incorporate any knowledge of the language being used, it does capture some statistical information and is thus capable of out-performing metrics based on the unigram and even n-gram vector-space model.
To determine the edge labels in the new graph
C, we can perform depth-first search (DFS) or breadth-first search (BFS) traversals from each vertex in the graph, limiting the depth to d. The complexity for calculating paths of length up to dfrom a source vertex to all other vertices using either DFS or BFS is at most O(bd), whereb is the average branching factor. The branching fac-tor depends on the average degree of the vertices of the graphs-of-words G which, in its turn, de-pends on the selected size of the sliding window. ForW = 2, the average degree of the vertices will be typically only slightly above2and the branch-ing factor will be only slightly above 1. Calcu-lating paths of length up todfor all vertices takes thusO(nbd)time. This still yields reasonable time complexity estimates for small values ofd.
After our original graphs have been transformed into the graphs described above, we can measure their similarity using the following kernel:
Definition 1(Custom shortest-path graph kernel).
transformed into graphs C1, C2 through the pro-cess described above. The proposed Shortest-Path Graph Kernel (SPGK) onC1 = (V1,E1)and C2= (V2,E2)is defined as follows:
k(d1, d2) =
P
v1∈V1,v2∈V2knode(v1, v2) +Pe1∈E1,e2∈E2k(1)walk(e1, e2)
!
norm
(1)
where knode is a positive definite kernel for
com-paring two vertices, kwalk(1) a positive definite ker-nel for comparing two edge walks of length 1 in C (i. e. up todin G) andnorm a normalization factor described next.
The similarity value generated by our custom shortest-path graph kernel is equal to the sum over the kernel values of all pairs of vertices on the transformed graphs plus the sum over the kernel values of all pairs of edge walks of length1over a positive normalization factor. Theknode kernel is a function for comparing two vertices. In practice, we use a delta kernel defined as:
knode(v1, v2) =
1 if`(v1) =`(v2), 0 otherwise (2)
but other works have considered distances in word embeddings for instance to account for word sim-ilarity at the cost of having to compare every node of a graph to every other nodes of the other graph (Srivastava et al.,2013).
The normalization factor is introduced because the nominator of the proposed kernel depends on the length of the compared documents. Specifi-cally, given the adjacency matrices of the trans-formed graph representations of two documents A1,A2where the value of each entry in the
adja-cency matrix is set equal to the label of the corre-sponding edge, and the diagonal matricesD1,D2
with diagonal entries set to 1 if the correspond-ing term exists in the correspondcorrespond-ing document, we first compute the matrices M1, M2 as shown
be-low:
M1=A1+D1
M2=A2+D2
and we then compute the normalization factor us-ing the followus-ing formula:
norm=kM1kF × kM2kF
wherek · kF is the Frobenius norm for matrices.
Thek(1)walkkernel can be expressed as the prod-uct of kernels on vertices and edges along the walk. Only walks of length 1 in C are consid-ered, therefore, k(1)walk can be calculated in terms of the original vertex, the destination vertex, and the edge connecting them.
Definition 2 (Custom edge walk kernel). Let
u1, v1 be two vertices of graph C1 (u1, v1 ∈ V1) ande1 the edge connecting them. Let also u2, v2 be two vertices of graphC2 (u2, v2 ∈ V2) and e2 the edge connecting them. The edge walk kernel is defined as follows:
kwalk(1) (e1, e2) =knode(u1, u2)×kedge(e1, e2) ×knode(v1, v2)
(3)
where knode is the kernel function defined above
andkedge is a kernel function for comparing two
edges defined as follows:
kedge(e1, e2) =
`(e1)×`(e2) ife1∈ E1∧
e2 ∈ E2,
0 otherwise
(4) The measure of similarity between two graphs depends on the kernel values corresponding to the vertices and edges that compose each walk, while the matching between two vertices or two edges is determined by comparing their labels. The val-ues of our kernel function lie in the interval[0,1]. It takes a value equal to0for documents with no common terms and a value equal to1for identical documents.
Lemma 1. SPGK is a valid kernel.
Proof. Based on the proofs presented in (Borg-wardt and Kriegel, 2005) and (Borgwardt et al., 2005), we show that our custom shortest-path graph kernel is positive definite. Theknode kernel is a delta kernel, which is known to be positive def-inite (Sch¨olkopf and Smola,2002) and therefore a valid kernel. Thekedgekernel is also a delta ker-nel multiplied by a positive real number. Since the multiplication of a kernel by a positive constant preserves positive definiteness, this kernel is also valid. Regarding the kwalk(1) kernel, it is positive definite as the point-wise multiplication of posi-tive definite kernels(knode,kedge)preserves posi-tive definiteness. ThePv1∈V1,v2∈V2knode(v1, v2)
hence, it is also positive definite. Regarding the P
e1∈E1,e2∈E2k (1)
walk(e1, e2) function, it is a walk kernel that takes into account only walks of length
1on the transformed graphs and is zero-extended to the whole set of pairs of walks that do not sat-isfy the above constraint. Therefore, kernel values for walks with length greater than1are set to zero. This zero-extension is known to preserve positive definiteness (Haussler, 1999). This function is a convolution kernel, which is proven to be positive definite (Haussler,1999). Finally, the kernel is di-vided by a positive constant and its positive defi-niteness is preserved.
3.4 Run Time Complexity
We now determine the time complexity of our pro-posed kernel for measuring the similarity between two documents. Let us assume that the graph-of-words representations of the two documents con-sist ofnvertices each. To determine the shortest paths of length at mostdfrom a root vertex to all other vertices, we needO(bd) time when using a graph traversal algorithm (depth-first or breadth-first search). There are alsonvertices in the trans-formed graph, hence, the transformation will re-quireO(nbd)time for each graph. In order to de-termine the kernel value, it is necessary to com-pute the value of kwalk(1) for all pairs of edges be-tween the two transformed graphs. The number of edges in the transformed graph can be at most n2 in the case all the shortest paths in the
origi-nal graph are no longer than d. Thus, there are at most n2 ·n2 = n4 pairs of edges. However,
due to the label enrichment that has been applied to the vertices of the transformed graphs, the num-ber of matching nodes in the two graphs has been radically reduced and the number of pairs of edges that have to be considered is also reduced. Specifi-cally, we have to considern2pairs of edges as only
paths between vertices whose label is the same in the two graphs are considered. The kernel value can thus be computed inO(n2+nbd)time.
3.5 Alternative Computation Method for
d= 1
In the case we consider only the common paths of length1, there is a more efficient algorithm to compute the kernel values. The common paths of length1correspond to common edges between the graph representations of the documents. The emerging kernel takes into account the number of
common vertices (terms) between the two graphs and the number of common edges (terms co-occurring in the same window) as well. More specifically, given two documentsd1 and d2, the
adjacency matrices of their graph representations A1,A2 where each entry in the adjacency matrix
is set to 1if the corresponding edge exists in the graph and the diagonal matricesD1,D2 with
di-agonal entries set to 1 if the corresponding term exists in the document, we first compute the ma-trices M1,M2 as described previously and then
we compute the kernel value using the following formula:
k(d1, d2) =
P
M1◦M2
kM1kF × kM2kF (5)
where(·◦·)is the Hadamard or element-wise prod-uct between matrices.
If n is the number of unique node labels, i. e. the length of the vocabulary, and m the number of edges, the computation of the kernel values re-quiresO(n+m)time in the worst case scenario. For the baseline similarity measures, with unigram features, the computational cost isO(n) time but it goes up as we consider higher ordern-grams.
4 Experiments and Evaluation
In this section, we present the experiments we con-ducted to evaluate and validate our proposed ker-nel between documents.
4.1 Evaluation Metrics
To assess the effectiveness of the different ap-proaches, we employed a set of well-known eval-uation metrics inherited from Information Re-trieval:accuracy,macro-average F1-scoreand for the story link detection taskDET curves (Martin et al.,1997).
The DET curve is a variant of the ROC curve that plots the missed detection probability
(Pmiss =fn/(tp+fn)) versus thefalse alarm prob-ability(Pfa = fp/(tn+fp)) for various system op-erating points, which allows someone to get a greater insight into the effectiveness of the eval-uated approaches. A method is considered to per-form best at thresholds that correspond to points that are close to the lower-left of the graph (i. e. lower error probabilities) and the area under the curve should be minimal.
Dataset # trainingexamples examples# test # classes vocabularysize per documentavg. terms degreeavg.
WebKB 2,803 1,396 4 7,772 77.93 2.54
News 32,604 CV 7 34,131 25.57 2.08
Subjectivity 10,000 CV 2 21,335 20.74 2.08
Amazon 6,400 1,600 4 39,133 86.96 2.67
[image:7.595.117.482.62.146.2]Polarity 10,662 CV 2 18,777 18.44 2.00
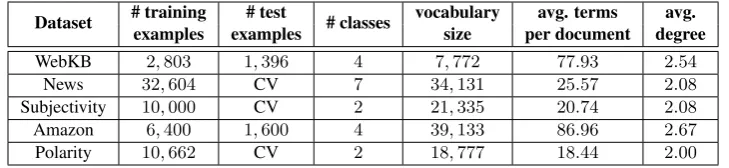
Table 1: Summary of the5datasets that were used in our text categorization experiments.
standard performance measure of TDT as de-scribed in (Fiscus and Wheatley,2004).
4.2 Datasets
We evaluate the SPGK and the baselines on5 stan-dard datasets for text categorization: (1)WebKB: Web pages collected from Computer Science de-partments of various Universities manually classi-fied into7categories (we removed Web pages that belong to the classes “staff”, “department” and “other”) (Craven et al., 1998). (2) News: News extracted from RSS feeds of popular newspaper websites classified into7 categories based on the taxonomies of their publishing websites (Vitale et al., 2012). (3) Subjectivity: Subjective and objective sentences corresponding to movie reviews from Rotten Tomatoes and to plot sum-maries gathered from the Internet Movie Database respectively (Pang and Lee,2004). (4)Amazon: Product reviews over four different sub-collections (Blitzer et al., 2007). (5) Polarity: Positive and negative snippets acquired from Rotten Toma-toes (Pang and Lee,2005). Table1shows statistics of the datasets that were used for the evaluation. For the Story Link Detection task, we employed the TDT-5 corpus that contains stories from var-ious newswire sources (Glenn et al., 2006;Graff and Kong,2006). We only used the English part of the dataset for our experiments consisting of
221,306documents.
4.3 Baselines
The similarity measure presented in this paper is best suited for settings where the concept of a pre-defined corpus does not exist. For example, it could find applications in plagiarism detection and in cases where independent pairs of documents must be compared to each other. In such settings, due to the absense of a corpus, we cannot learn mappings of terms to a vector space (i. e. word em-beddings) or use methods that take advantage of the corpus to increase their performance. Hence,
our set of baselines includes methods that take as input two documents and output their similarity.
More specifically, the performance of our pro-posed kernel was compared to the performances of three baseline kernels based on similarity mea-sures between pairs of documents< d1, d2 > in
then-gram feature space (up to4-grams):
1. The linear kernel, which uses thedot productas similarity measure:kdp(d~1, ~d2) =d~1·d~2where
~dis the n-gram feature vector associated with the documentd;
2. Cosine, which measures the cosine of the an-gle between the two vectors: kc(d~1, ~d2) =
~ d1·d~2
kd~1k×kd~2k wherek · kis theL2−norm.
3. Tanimoto coefficient(also known as Jaccard co-efficient), which measures the intersection of features divided by their union: ktc(d~1, ~d2) =
~ d1·d~2
kd~1k2+kd~2k2−d~1·d~2
Method Dataset Accuracy F1-score Accuracy F1-score Accuracy F1-score Accuracy F1-score Accuracy F1-scoreWebKB News Subjectivity Amazon Polarity
Dot product
n= 1 0.9026 0.8923 0.8110 0.7764 0.8992 0.8992 0.9188 0.9188 0.7627 0.7626
n= 2 0.9047 0.8950 0.8091 0.7732 0.9101 0.9101 0.9200 0.9202 0.7746 0.7745
n= 3 0.9026 0.8917 0.8072 0.7710 0.9090 0.9090 0.9181 0.9185 0.7741 0.7740
n= 4 0.8940 0.8813 0.8031 0.7651 0.9039 0.9039 0.9131 0.9133 0.7719 0.7718
Cosine
n= 1 0.9248 0.9188 0.8117 0.7766 0.9003 0.9002 0.9400 0.9400 0.7670 0.7669
n= 2 0.9305 0.9275 0.8149 0.7797 0.9094 0.9094 0.9413 0.9413 0.7756 0.7756
n= 3 0.9298 0.9259 0.8097 0.7738 0.9099 0.9099 0.9419 0.9418 0.7765 0.7765
n= 4 0.9248 0.9208 0.8076 0.7709 0.9076 0.9075 0.9413 0.9413 0.7753 0.7753
Tanimoto
n= 1 0.9062 0.8983 0.8155 0.7815 0.9094 0.9093 0.9225 0.9226 0.7749 0.7748
n= 2 0.9040 0.8945 0.8075 0.7700 0.9061 0.9060 0.9181 0.9185 0.7735 0.7735
n= 3 0.9241 0.9180 0.7980 0.7575 0.9021 0.9020 0.9344 0.9347 0.7648 0.7648
n= 4 0.9176 0.9084 0.7899 0.7483 0.8953 0.8952 0.9300 0.9300 0.7586 0.7586
DCNN 0.8918 0.8799 0.7991 0.7615 0.9026 0.9026 0.9181 0.9181 0.7326 0.7326
CNN static,rand >1day 0.7757 0.7337 0.8716 0.8715 0.8881 0.8882 0.7150 0.7150
non-static,rand >1day 0.8113 0.7749 0.8961 0.8960 0.9356 0.9356 0.7654 0.7653
SPGK
d= 1 0.9327 0.9278 0.8104 0.7749 0.9148* 0.9148 0.9400 0.9401 0.7776 0.7775
d= 2 0.9370* 0.9336 0.8089 0.7729 0.9146* 0.9146 0.9413 0.9413 0.7789* 0.7788
d= 3 0.9291 0.9233 0.8078 0.7703 0.9137* 0.9137 0.9444 0.9444 0.7761 0.7760
[image:8.595.72.530.61.279.2]d= 4 0.9291 0.9223 0.8097 0.7730 0.9118 0.9118 0.9463 0.9463 0.7780 0.7780
Table 2: Performance of the6 approaches in text categorization. * indicates statistical significance in accuracy improvement atp < 0.05using the micro sign test against the Cosine (n= 2) baseline of the same column.>1day indicates that the computation did not finish after1day.
4.4 Text Categorization
To perform text categorization, for all methods ex-cept the DCNN and the two CNNs, we employed a Support Vector Machine (SVM) classifier (Boser et al.,1992). It is interesting to note that all we need to train an SVM classifier is the kernel ma-trix of the training examples. We optimized the parameter C of the SVM by performing 10-fold cross-validation on the training set. We then made predictions on the test set using the optimal value ofC. For DCNN the dimensionality of the gen-erated embeddings was set to 100, while for the two CNNs it was set to300. For DCNN and the two CNNs, the number of training epochs was set to 25. All similarity measures were coded in Python1.
For each value of the parameter d, we obtain a new kernel and in turn the resultant kernel matrix contains different values. To study the effect of parameterdon the classification performance, we performed tests for values ofdranging from1to
4. We did not further increase the value ofdsince in most cases, for values greater than4, the perfor-mance of the classifier stayed the same.
Table 2shows the performance of the baseline methods and the proposed shortest-path graph ker-nel (SPGK), on the five datasets. Bold font marks the best performance in a column, while ∗ indi-1Code available at: http://www.db-net.aueb.
gr/nikolentzos/code/spgk.zip
cates statistical significance in accuracy improve-ment atp < 0.05 using the micro sign test (Yang and Liu,1999) against the Cosine (n= 2) baseline of the same column. We chose to test for signifi-cance against that measure, as it corresponds to the best-performing baseline. On all datasets except one (News), SPGK outperforms the other three similarity measures and the neural network archi-tectures. In addition, the results show a statisti-cally significant improvement of at least one of our kernels over the Cosine (n = 2) approach on all datasets except two (News, Amazon). In general, our kernel is followed in performance by Cosine, Tanimoto, Dot Product in that order. The three neural network architectures fail to outperform the proposed kernel even on a single dataset. Further-more, the approaches that make use of the whole corpus to generate embeddings (DCNN and CNN non-static,rand) do not seem to gain any advantage from having access to the whole dataset. This may be due to the fact that the size of the datasets is not large enough for learning high-quality representa-tions.
4.5 Story Link Detection
0.1 1.0 10.0 100.0 1
10 100
False Alarm probability (%)
Missed Detection probability (%)
Dot product Cosine
[image:9.595.71.285.66.235.2]Tanimoto coefficient SPGK
Figure 2: DET curves for all similarity measures on story link detection track.
Similarity measure (Cdet)norm
Dot product 0.3908
Cosine 0.0953
Tanimoto coefficient 0.1453
SPGK
d= 1 0.0883 d= 2 0.0884
d= 3 0.0888
d= 4 0.0888
Table 3: Performance of all similarity measures in story link detection.
an event is something that happens at some spe-cific time and place and two stories are “linked” if they discuss the same event.
In Figure 2, we plot the DET curves compar-ing the proposed approaches. For clarity, we only plot one curve for our SPGK approach (d = 1) since the plots overlapped, and the best perform-ing curve for each of the baseline approaches. It is clear that our approach outperforms the base-lines over the whole set of operating points. We also searched for the threshold values for which each approach maximizes its performance. Our next step was to compare the four systems in terms of detection effectiveness at that optimal thresh-old. Table3illustrates the normalizedCdetof the proposed methods and the baselines. We can see that the proposed methods are better than baseline methods in terms of the normalizedCdetmetric.
5 Conclusion
In this paper, we presented a graph kernel for mea-suring the similarity between pairs of documents. The graph-of-words representation of textual doc-uments allows us to model relationships between
terms in documents and, hence, to go beyond the limits of the vector-space model. At the same time, it allows us to measure the similarity be-tween two documents by comparing their graph representations using kernel functions. The effec-tiveness of the proposed kernel was empirically tested on two different tasks, namely text catego-rization and story link detection. The proposed measure showed improved performance on both tasks compared to the baselines.
References
J. Allan. 2002. Introduction to Topic Detection and
Tracking. In Topic Detection and Tracking, pages
1–16.
G. Altmann and M. Steedman. 1988. Interaction with
context during human sentence processing.
Cogni-tion, 30(3):191–238.
R. Blanco and C. Lioma. 2012. Graph-based term weighting for information retrieval. Information re-trieval, 15(1):54–92.
S. Bleik, M. Mishra, J. Huan, and M. Song. 2013. Text Categorization of Biomedical Data Sets using Graph
Kernels and a Controlled Vocabulary. IEEE/ACM
Transactions on Computational Biology and Bioin-formatics, 10(5):1211–1217.
J. Blitzer, M. Dredze, and F. Pereira. 2007. Biogra-phies, Bollywood, Boomboxes and Blenders: Do-main Adaptation for Sentiment Classification. In
Proceedings of the 45th Annual Meeting of the As-sociation of Computational Linguistics, pages 440– 447.
K. M. Borgwardt and H. Kriegel. 2005. Shortest-path
kernels on graphs. InProceedings of the 5th IEEE
International Conference on Data Mining, pages 74––81.
K. M. Borgwardt, C. S. Ong, S. Sch¨onauer, S. Vish-wanathan, A. J. Smola, and H. Kriegel. 2005. Pro-tein function prediction via graph kernels. Bioinfor-matics, 21(suppl 1):i47–i56.
B. E. Boser, I. M. Guyon, and V. N. Vapnik. 1992. A Training Algorithm for Optimal Margin Classifiers. InProceedings of the 5th Annual Workshop on Com-putational Learning Theory, pages 144–152. N. Cancedda, E. Gaussier, C. Goutte, and J. M.
Ren-ders. 2003. Word-Sequence Kernels. The Journal
of Machine Learning Research, 3:1059–1082. M. Craven, D. DiPasquo, D. Freitag, A. McCallum,
T. Mitchell, K. Nigam, and S. Slattery. 1998. Learn-ing to Extract Symbolic Knowledge from the World
Wide Web. InProceedings of the 10th Conference
[image:9.595.107.256.286.382.2]S. Dumais, J. Platt, D. Heckerman, and M. Sahami. 1998. Inductive Learning Algorithms and
Represen-tations for Text Categorization. InProceedings of
the 7th ACM International Conference on Informa-tion and Knowledge Management, pages 148–155. J. Fiscus and B. Wheatley. 2004. Overview of the TDT
2004 Evaluation and Results. InTDT Workshop.
T. G¨artner, P. Flach, and S. Wrobel. 2003. On Graph Kernels: Hardness Results and Efficient
Alterna-tives. In Learning Theory and Kernel Machines,
pages 129–143.
M. Glenn, S. Strassel, J. Kong, and K. Maeda. 2006.
TDT5 Topics and Annotations. Linguistic Data
Consortium (LDC).
D. Graff and J. Kong. 2006. TDT5 Multilingual Text.
Linguistic Data Consortium (LDC).
S. Hassan, R. Mihalcea, and C. Banea. 2007. Random-Walk Term Weighting for Improved Text Classifica-tion. International Journal of Semantic Computing, 1(04):421–439.
D. Haussler. 1999. Convolution Kernels on Discrete Structures. Technical report, UCSC-CRL-99-10, Department of Computer Science, University of Cal-ifornia, Santa Cruz.
T. Horv´ath, T. G¨artner, and S. Wrobel. 2004. Cyclic Pattern Kernels for Predictive Graph Mining. In
Proceedings of the 10th ACM SIGKDD Interna-tional Conference on Knowledge Discovery and Data Mining, pages 158–167.
C. Jiang, F. Coenen, R. Sanderson, and M. Zito. 2010. Text classification using graph mining-based feature
extraction. Knowledge-Based Systems, 23(4):302–
308.
T. Joachims. 1998. Text Categorization with Support
Vector Machines: Learning with Many Relevant Features.
N. Kalchbrenner, E. Grefenstette, and P. Blunsom. 2014. A Convolutional Neural Network for
Mod-elling Sentences. In Proceedings of the 52nd
An-nual Meeting of the Association for Computational Linguistics.
Y. Kim. 2014. Convolutional Neural Networks for
Sen-tence Classification. In Proceedings of the 2014
Conference on Empirical Methods in Natural Lan-guage Processing, pages 1746–1751.
H. Lodhi, C. Saunders, J. Shawe-Taylor, N. Cristian-ini, and C. Watkins. 2002. Text Classification using
String Kernels. The Journal of Machine Learning
Research, 2:419–444.
F. Malliaros and K. Skianis. 2015. Graph-Based Term
Weighting for Text Categorization. InProceedings
of the 2015 International Conference on Advances in Social Networks Analysis and Mining, pages 1473– 1479.
C. D. Manning and H. Sch¨utze. 1999. Foundations
of Statistical Natural Language Processing. MIT press.
A. Martin, G. Doddington, T. Kamm, M. Ordowski, and M. Przybocki. 1997. The DET Curve in As-sessment of Detection Task Performance. Technical report, DTIC Document.
P. Meladianos, G. Nikolentzos, F. Rousseau,
Y. Stavrakas, and M. Vazirgiannis. 2015.
Degeneracy-based Real-Time Sub-Event De-tection in Twitter Stream. InProceedings of the 9th AAAI Conference on Web and Social Media, pages 248–257.
R. Mihalcea and P. Tarau. 2004. TextRank:
Bring-ing Order into Texts. In Proceedings of the
Con-ference on Empirical Methods in Natural Language Processing, pages 404–411.
Y. Ohsawa, N. E. Benson, and M. Yachida. 1998. KeyGraph: Automatic Indexing by Co-occurrence Graph based on Building Construction Metaphor. InProceedings of the Advances in Digital Libraries Conference, pages 12–18.
B. Pang and L. Lee. 2004. A Sentimental Education: Sentiment Analysis using Subjectivity
Summariza-tion based on Minimum Cuts. InProceedings of the
42nd Annual Meeting on Association for Computa-tional Linguistics, pages 271–278.
B. Pang and L. Lee. 2005. Seeing stars: Exploiting class relationships for sentiment categorization with respect to rating scales. InProceedings of the 43rd Annual Meeting on Association for Computational Linguistics, pages 115–124.
J. Ramon and T. G¨artner. 2003. Expressivity versus
Efficiency of Graph Kernels. In 1st International
Workshop on Mining Graphs, Trees and Sequences, pages 65–74.
F. Rousseau, E. Kiagias, and M. Vazirgiannis. 2015. Text Categorization as a Graph Classification
Prob-lem. In Proceedings of the 53rd Annual Meeting
of the Association for Computational Linguistics, pages 1702–1712.
F. Rousseau and M. Vazirgiannis. 2013. Graph-of-word and TW-IDF: New Approach to Ad Hoc IR. In
Proceedings of the 22nd ACM International Confer-ence on Information and Knowledge Management, pages 59–68.
G. Salton, A. Wong, and C. Yang. 1975. A Vector
Space Model for Automatic Indexing.
Communica-tions of the ACM, 18(11):613–620.
B. Sch¨olkopf and A. J. Smola. 2002. Learning with
N. Shervashidze, T. Petri, K. Mehlhorn, K. M.
Borg-wardt, and S. Vishwanathan. 2009. Efficient
Graphlet Kernels for Large Graph Comparison. In
Proceedings of the 12th International Conference on Artificial Intelligence and Statistics, pages 488–495. S. Srivastava, D. Hovy, and E. H. Hovy. 2013. A Walk-Based Semantically Enriched Tree Kernel Over
Dis-tributed Word Representations. In Proceedings of
the 2013 Conference on Empirical Methods in Nat-ural Language Processing, pages 1411–1416. S. Vishwanathan, N. N. Schraudolph, R. Kondor, and
K. M. Borgwardt. 2010. Graph Kernels. The
Jour-nal of Machine Learning Research, 11:1201–1242. D. Vitale, P. Ferragina, and U. Scaiella. 2012.
Classi-fication of Short Texts by Deploying Topical Anno-tations. InAdvances in Information Retrieval, pages 376–387.
P. Wang and C. Domeniconi. 2008. Building Seman-tic Kernels for Text Classification using Wikipedia. In Proceedings of the 14th ACM SIGKDD Inter-national Conference on Knowledge Discovery and Data Mining, pages 713–721.
Y. Yang and X. Liu. 1999. A Re-examination of Text
Categorization Methods. InProceedings of the 22nd