REVIEW
Nanostructured TiO
2
(B): the effect of size and shape
on anode properties for Li-ion batteries
Zheng Liu
a, Yuri G. Andreev
a, A. Robert Armstrong
a, Sergio Brutti
b,
Yu Ren
c,n, Peter G. Bruce
a,nna
School of Chemistry and EaStChem, University of St Andrews, St Andrews, Fife KY16 9ST, UK
b
Dipartimento di Scienze, Unversità della Basilicata, V.le Ateneo Lucano 10, Potenza 85100, Italy
c
National Institute of Clean-and-low-carbon Energy (NICE), Future Science& Technology City, Changping, Beijing, 102209, China
Received 26 September 2012; accepted 20 March 2013 Available online 18 June 2013
KEYWORDS
TiO2(B);
Synthesis; Anode; Nanostructure; Li-ion batteries
Abstract Reducing the dimensions of electrode materials from the micron to the nanoscale can have a profound influence on their properties and hence on the performance of electrochemical devices, e.g. Li-ion batteries, that employ such electrodes. TiO2(B) has received growing interest as a possible anode for Li-ion
batteries in recent years. It offers the possibility of higher energy storage compared with the commercialized Li4Ti5O12. Bulk, nanowire, nanotube, and nanoparticle morphologies have been prepared and studied.
However, to date these materials have not be compared in one article. In the current review we first summarize the different synthesis methods for the preparation of nanostructured TiO2(B); then present the
effects of size and shape on the electrochemical properties. Finally TiO2(B) with nanometer dimensions
exhibit a higher capacity to store Li, regardless of rate, due to structural distortions inherent at the nanoscale.
&2013 Chinese Materials Research Society. Production and hosting by Elsevier B.V. All rights reserved.
1. Introduction
TiO2(B), although less well known than rutile, anatase, or
brookite, is a better host for lithium intercalation than the other three (Fig. 1).“B”stands for bronze, by analogy with the tungsten
bronze compounds. These four phases plus the other known TiO2
polymorphs are listed inTable 1.
Titanates are being intensively investigated as anode materials for lithium-ion batteries due to their superior safety compared with graphite, Si, Sn or other low voltage anodes. Such safety arises in
Chinese Materials Research Society
www.elsevier.com/locate/pnsmi www.sciencedirect.com
Progress in Natural Science: Materials International
1002-0071&2013 Chinese Materials Research Society. Production and hosting by Elsevier B.V. All rights reserved. http://dx.doi.org/10.1016/j.pnsc.2013.05.001
nCorresponding author. Tel.:+86 10 57339664; fax:+86 10 57339649x9664. nnCorresponding author. Tel.:+44 1334 46 3825; fax:+44 1334 46 3808.
E-mail addresses: renyu@nicenergy.com (Y. Ren), p.g.bruce@st-andrews.ac.uk (P.G. Bruce).
part from the high voltage of the titanates (1.5–1.7 V) compared with
∼0 V for graphite, although, unless the high voltage anode is compensated by a high voltage cathode, the overall cell voltage will be reduced. One advantage of anodes operating at higher potential than graphite is that the cells can be charged at high rates with good safety. In order to achieve this high rate performance in the titanates it requires the use of nanostructured materials. Therefore much of the focus on titanate anodes has been on nanomaterials[1–13]. Li4Ti5O12spinel is
now used as the anode in commercial lithium-ion batteries[14–17]. TiO2 possesses twice the theoretical specific capacity (335 mAh/g)
compared with Li4Ti5O12 (175 mAh/g), i.e., has a specific capacity
comparable to that of graphite, and as oxides have twice the density of graphite, they have twice the theoretical volumetric energy density (although nanostructuring can compromise this to an extent). These potential advantages render TiO2 attractive as an anode for Li-ion
batteries[2–8,10,12,13,18,19].
Some of the earliest work on titanate nanotubes/nanowires claimed the synthesis of TiO2-anatase [20,21]. However,
subse-quent studies showed that the nanotubes/nanowires were com-posed of the layered titanate H2Ti3O7and the“scroll”mechanism
of tube formation was proposed[22].
The titanate nanotubes/nanowires were generally prepared by the hydrothermal reaction between NaOH and anatase. We found that the composition and structure of both the tubes and wires are more complex than had been recognized
previou-sly[23,24]. The as-synthesized nanotubes and nanowires are sodium hydrogen titanates of general formula NayH2-yTinO2n+1xH2O.Acid
washing of such materials results in ion exchange to produce the layered hydrogen titanates H2TinO2n+1xH2O, which exhibit features
similar to H2Ti3O7, H2Ti4O9H2O, and other members of the
hydrogen titanate family. After controlled thermal treatment, the nanotubes transform into TiO2(B) nanotubes[25].
In the following sections we will describe the synthesis of TiO2(B) nanotubes, nanowires and the smallest nanoparticles of
any titanate, their morpohology, mitigation of thefirst cycle irre-versible capacity (a major problem and common feature of many nanostrucured electrodes), and the remarkable ability of nanostrucurred matetials to accommodate more Li than their bulk conternparts, regardless of rate.
2. Synthesis of different TiO2(B) morphologies
2.1. Bulk TiO2(B)
Bulk TiO2(B) wasfirst prepared by Marchand et al. in 1980[29].
Synthesis involves high temperature solid state reaction between K2CO3and TiO2to form K2Ti4O9, ion exchange of K+with H+to
form a hydrated hydrogen titanate, heating to 5001C, thus inducing transformation into TiO2(B). The resulting morphology
Fig. 1 The structure of (a) anatase, (b) brookite, (c) rutile, and (d) TiO2(B); (e) the images of the TiO2(B) structure before and after
[image:2.595.63.540.59.399.2]Table 1 Structure information of TiO2polymorphs.
Crystal form Space group Density Synthesis method Lithiation
amout at bulk
Lithiation amout at nano
Anatase[26–28] Tetragonal, I41/amd
3.79 – 0.5 1.0
Rutile[26–28] Tetragonal, P42/mnm
4.13 – 0.1 0.85
Brookite[26,28] Orthorhombic, Pbca
3.99 – – 1.0
TiO2(B), bronze[26,28,29] Monoclinic,
C2/m
3.64 Hydrolysis of K2Ti4O9followed by
heating
0.71 1.0
TiO2(H), hollandite-like form
[26,28,30]
Tetragonal, I4/ m
3.46 Oxidation of the related potassium titanate bronze, K0.25TiO2
– –
TiO2(R), ramsdellite-like form[28,31] Orthorhombic,
Pbnm
3.87 Oxidation of the related lithium titanate bronze Li0.5TiO2
– –
TiO2(II)-(α-PbO2-like form)
[26,28,32]
Orthorhombic, Pbcn
4.33 High pressure – –
TiO2(III) (baddeleyite-like form, 7
coordinated Ti)[28,33]
Monoclinic – High pressure – –
TiO2-OI[34] Orthorhombic – High pressure – –
Cubic Cubic – P440 GPa, T416001C – –
TiO2–OII (PbCl2-like, 9 coordinated
Ti)[35]
Orthorhombic – P440 GPa, T47001C – –
Fig. 2 SEM image of bulk TiO2(B) (a) [36], TEM image of TiO2(B) nanowires (b)[23], nanotubes (c) [24], and nanoparticles (d) [37].
[image:3.595.123.467.353.709.2]is shown in Fig. 2a. The crystal are needle like and elongated along the b axis. They are typically several microns long and 0.2–0.8μm wide.
2.2. Nanowire
Armstrong et al.first prepared TiO2(B) nanowires[23,38]. The
synthesis involvedfirst adding the anatase TiO2into a 15 mol/
L NaOH solution and hydrothermal treatment at 1701C for 72 h. Then the product was acid wash with 0.05 mol/L HCl solution and finally calcined at 4001C for 4 h in air. The nanowires are typically 20–40 nm in diameter and up to several microns long.
2.3. Nanotube[24,39]
The synthesis conditions for TiO2(B) nanotubes are similar to those
used for TiO2(B) nanowire. TiO2(B) nanotubes were synthesized by
adding anatase into a solution of 15 mol/L NaOH followed by hydrothermal treatment at 1501C for 72 h. Then the product of the hydrothermal reaction was washed with 0.05 mol/L of HCl, dried in air then heated to 4001C for 5 h. The synthesis difference between the nanowires and nanotubes are the hydrothermal temperature and NaOH/TiO2ratio. The nanotubes are composed of walls of 2.5 nm
thickness, with outer tube diameter 10 nm and up to several microns long.
Fig. 3 The first cycle load curves of nanoparticle and nanotube TiO2(B) at 10 mA/g.
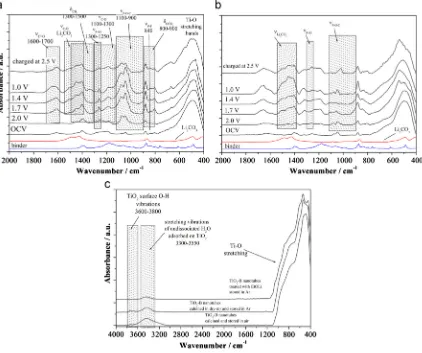
Fig. 4 (a) and (b) FTIR spectra collected on the TiO2(B) electrodes at various states of discharge then charge. (c) FTIR of the different TiO2(B)
[image:4.595.56.292.102.298.2] [image:4.595.92.514.349.702.2]2.4. Nanoparticles[37]
TiO2(B) nanoparticles were prepared using a hydrothermal method
modified from a previously reported procedure[40]. Metallic Ti was dissolved in a mixed solution of H2O2and NH3H2O solution under
ice/water bath; after addition of glycolate acid and adjustment of pH value by concentrated H2SO4, the solution was hydrothermally
treated at 1601C for 30 min. Finally, the solid was recovered at 601C over night and calcined at 3001C for 1 h in dry air with a ramping rate of 11C/min. The obtained nanoparticles are all agglomerates, with primary particle size of 2.54.3 nm (from HRTEM analysis on 100 particles), and secondary particle size of 0.3–3μm. Approximately half the primary particle surface area is in contact with other particles, based on BET surface area measurements
[37].
3. Origin and mitigation of irreversible capacity
Although nanomaterials are receiving more and more interest as electrode materials for lithium-ion batteries, they generally suffer from large irreversible capacity loss on thefirst cycle (Fig. 3). This is a major issue that also affects nanosized titanates anode materials[41,42]. Such loss of capacity for intercalation electrodes in general has been attributed to the non-reversible Li intercalation on thefirst cycle[8,43–46] or the reaction between the electrolyte and the titanate surface [47,48]. The latter is believed more important for the nanosized titanate.
Using X-ray photoelectron spectroscopy (XPS) to follow the bulk composition and Fourier transform infra-red spectroscopy (FTIR) to follow the surface, during thefirst cycle, it has been shown that the irreversible capacity of TiO2(B) nanotubes is indeed associated with
the formation of a surface layer (Solid Electrolyte Interface) due to reaction between the TiO2(B) surface and the electrolyte,Fig. 4.[49]
The FTIR data collected from nanotubes on the first discharge (intercalation) and charge (deintercalation) shows that peaks grow that could be associated with Li2CO3 and ROCO2Li originating from
solvent decomposition, (RO,F)3P¼O and LixPFyfrom LiPF6
hydro-lysis, similar to the SEI layer product of on carbon, Li metal, Li4Ti5O12, or an oxides anode via conversion reaction[48,50–52]. It
has also supplied strong evidence of the reduction of electrolyte on TiO2(B) nanotube above 1–1.5 V, even above 2 V. After charge to
3 V, the intensity of the peaks decreases but they do not totally disappear (Fig. 4b).
In order to mitigate the irreversible capacity loss in thefirst cycle various surface chemical treatments of the TiO2(B) nanotubes were
investigated: treatment with the butyllithium, the CH3CH2OLi
treatment, both before electrode preparation, and nano Li powder incorporation in the electrode formulation (nanoparticles of Li metal supplied by FMC corporation).
Using n-butyllithium or nanoparticle lithium powder, the high Coulombic efficiency of 97% and 94% can be obtained for TiO2(B)
nanotube onfirst cycle (Table 2). However, the reversible capacity is also decreased to 212 and 205 mAh/g, for n-butyllithium and nanoparticle lithium treated TiO2(B) nanotubes, respectively, because
of the chemical intercalation of Li reducing the remaining capacity for electrochemical lithium insertion on discharge. So there is a compromise between the low first cycle irreversible capacity and high reversible capacity for TiO2(B) nanotubes. Using the lithium
ethoxide treatment, thefirst discharge capacity is 237 mAh/g with an acceptable Coulombic efficiency of 93% (Table 2).
Since the surface of TiO2(B) is covered with adsorbed H2O and
[image:5.595.303.537.236.555.2]Ti–OH group (Fig. 4c), the reaction of hydroxyl with lithium ethoxide result in the reaction as follows: Ti–O–H+C2H5OLi¼Ti–O–Li
Table 2 Surface treatment effect on the electrochemistry of the TiO2(B) nanotubes (i¼C/20¼17 mA/g).[49]. [49]. Reproduced with
permission of Wiley from Ref.[49].
Structure First discharge/charge capacity First cycle coulombic efficiency (%) Capacity retention at cycle 20 (%)
Nanotube 330/246 74 71
Nanotube+10 mol% BuLi 212/206 97 90
Nanotube+100 mol% CH3CH2OLi 237/220 93 90
Nanotube+20 mol% nanoLi 205/193 94 86
Fig. 5 Variation of voltage with state-of-charge for discharge then charge of bulk TiO2(B), TiO2(B) nanowires, nanotubes, and
[image:5.595.51.540.671.735.2]+C2H5OH, as derived from the decreased concentration of O–H
group after surface treatment (Fig. 4c). This can help the mitigation of LiPF6hydrolysis, and the precipitation of LiF and organic phosphates.
In summary, the surface treatments can greatly mitigate one of the major issues of nanosized electrode materials (e.g. titanates)-largefirst cycle irreversible capacity.
4. The influence of size on intercalation capacity
Once the surface layer has formed, the subsequent load curves correspond almost exclusively to lithium intercalation. As a result the comparison of electrochemical performance comparison among different nanostructured TiO2(B) were carried on the
second cycle at 50 mA/g.
The load curves on the second cycle and the corresponding differential capacity plots (dQ/dV) for all the TiO2(B) materials are
presented inFig. 5. Some features of the electrochemistry for all four polymorphs are similar. All show a pair of plateaus in the load curves in the range 1.45–1.65 V. This is most clearly seen in the differential capacity plots (Fig. 5b), where peaks correspond to plateaus in the load curves. Such plateaus indicate to the presence of two 2-phase intercalation processes. In the cases of the bulk and nanowire TiO2(B)
materials, diffraction data of sufficient quality to apply established methods of structure elucidation (Rietveld refinement) can be obtained and have been used previously to assign the 2 phase processes to intercalation into the A1 and A2 sites of the TiO2(B) crystal structure [53,54]. Intercalation into the same sets of sites may be occurring in the
nanotubes and nanoparticles but here the diffraction peaks are too broad to be analyzed by Rietveld refinement, rendering it difficult to determine definitively the Li site occupancies by neutron diffraction. The peaks in the differential capacity plots broaden and lower in inten-sity as the dimensions of the TiO2(B) particles are reduced, indicative
of a transformation from 2-phase reactions, with constant chemical potential, towards a system that exhibits a Li chemical potential which varies with overall Li content. This is commensurate with previous observations of intercalation compounds that exhibit a two-phase intercalation process for large (bulk) particles but increasingly sloping load curves on reducing the particle dimensions[4,55–58].
Focusing on the effect of size on intercalation capacity, the dimensions of the nanoparticles (2.54.3 nm) and the wall thickness of the nanotubes (2.5 nm) are similar, whereas the nanowires (35 nm2μm) are much closer to the dimensions of the bulk parti-cles (200 nm2μm). The nanoparticles and nanotubes can acco-mmodate more Li and hence store more charge (∼20–30%) than the bulk or nanowire morphologies (Fig. 5a). The additional capacity appears mainly below 1.4 V and may be seen in the difference between the areas under the differential capacity plots in Fig. 5b. The increased Li storage in ultrafine TiO2(B) morphology
(nanopar-ticle and nanotubes) compared with TiO2(B) bulk and nanowires
appears to be a general phenomenon due to the reduced dimensions. It is present at low rates and is not a kinetic phenomenon, the capacity increases on reducing the dimensions of crystalline materials to the nanoscale. In doing so, a greater proportion of the material will be in the near surface region where it is subjected to different forces than in the bulk, resulting in structural distortions. Such distortions have been
Fig. 6 (a) X-ray diffraction patterns of TiO2(B) nanotubes: dots, observed pattern; black line, simulated pattern based on folding theabplane of
the ideal TiO2(B) structure alongainto a tube; red line, simulated pattern based on folding thebcplane of the ideal TiO2(B) structure alongcinto a
tube; (b) lines, simulated pattern based on folding theabplane of the ideal TiO2(B) structure alongainto segments of the tube of different length
around the circumference of the outer wall of the nanotube. Each segment consists of four layers in the radial direction.; (c) X-ray diffraction patterns of TiO2(B) nanotubes: dots, observed pattern; black line, simulated pattern of a 3.2 nm tube segment corrected for preferred orientation;
red line, simulated pattern of an ideal TiO2(B) crystal structure (i.e., not distorted to form the tube) with the same number of atoms as the segment
[image:6.595.131.477.389.653.2]related to increased Li storage in TiO2(B) nanotubes[25]. Establishing
the structure (atomic arrangement) of nanomaterials is challenging because as the dimensions approach 1–2 nm long range translational symmetry is lost so is the ability to use crystallographic methods such as Rietveld refinement. An approach which provided the crucial structural data for TiO2(B) nanotubes, without recourse the symmetry
is described in the next section. Similar structural distortions are anticipated in the nanoparticles. A very small peak is evident at around 1.20–1.35 V on oxidation in the case of the nanotubes and nanopar-ticles that does not appear in the TiO2(B) materials of larger
dimension, understanding its origin also requires a detailed knowledge of the structural distortions.
5. Structure simulation of the TiO2(B) nanotube[25]
The structures of nanosized TiO2(B) can differ significantly from
their bulk counterparts. However, determining the atomic struct-ure of nanosized TiO2(B) is difficult because the traditional
crystallographic techniques rely on long-range ordered symmetry. For materials with particle sizes of only a few nanometers, their powder diffraction peaks become severely, and sometimes aniso-tropically, broadened, rendering the application of established crystallographic methods difficult or impossible.
Problems of structure elucidation apply to all nanomaterials, but the situation is particularly difficult for nanotubes of TiO2(B). Not only their powder pattern is severely, and
anisotropically, broadened due to the shape of nanometer dimensions (see Fig. 6), but, in addition, the ideal crystal structure is expected to distort as it curves to form the nanotube, introducing further violation of translational sym-metry and, as a result, further peak broadening.
Use of the Debye equation, which requires no assumption of translational symmetry, permits not only to overcome the problems encountered by traditional powder diffraction techniques asso-ciated with anisotropic peak broadening but to use the latter in order to extract a more detailed structural information. Simply by applying this equation to a structural model of TiO2(B) nanotubes,
in the form of coordinates of all atoms within a tube, it is possible to simulate the complete powder diffraction profile and hence elucidate the deformed crystal structure.
A nanotube can be formed, for example, by folding the ab
planes of the ideal TiO2(B) structure along theaaxis, with theb
andcaxes placed along the axial and radial directions of the tube, respectively (Fig. 6a).
A nanotube can be formed, for example, by folding the ab
planes of the ideal TiO2(B) structure along theaaxis, with theb
andcaxes placed along the axial and radial directions of the tube, respectively (Fig. 6a).
Powders composed of particles with extreme aspect ratios often exhibit preferred orientation. Such an effect has been taken into account when calculating powder diffraction patterns from models of the TiO2(B) nanotubes to further improve thefit to the experimental
data. Various degrees of preferred orientation were examined, and the best description of the observed powder diffraction data was obtained for a preferred orientation parameter of 0.8 (seeFig. 6c). In excess of 90% of the TiO2(B) powder is composed of nanotubes; however
other morphologies may affect the diffraction profile, precluding refinement of the structure, hence, a precise representation of the observed powder pattern cannot be expected. Yet the simulation reproduces well the main features of the powder diffraction pattern, in particular the severe hkl-dependent broadening.
6. The rate capability of nanosized TiO2(B)
Due to the poor electronic conductivity of the pure TiO2(B)
materials, large amount of carbon is generally needed to obtain good rate capability [38,39,59,60], which will reduce the volumetric energy density of TiO2(B) materials. In the
litera-tures, different components, e.g. metallic Au and Ag[61], Sn
[62], carbon[63], graphene[64], CNT[65], even N etc., have been introduced into the TiO2 to improve their conductivity
Fig. 7 (a) Gravimetric (Cgra) and (b) relative volumetric capacity (RCvol)
retention of TiO2(B) nanoparticles compared with other titanate materials
as a function of rate. The volumetric capacities are expressed relative to the highest value for the anatase nanotubes (synthesized from H2Ti2O5H2O).
For each electrode, the ratio of active material:carbon:binder and composite electrode density is given in brackets. Mesoporous anatase (black, 70: 15:15)[43], 6 nm anatase nanoparticles (red, 50:45:5), nanocrystalline Li4Ti5O12(green, 85:15:5) [66], 94%anatase-6%C microspheres (cyan, 80:10:10) [67], 87%TiO2(B)-13%anatase microspheres (mangenta,
70:15:15)[68], TiO2(B) nanotubes (purple, 75:18:7)[39], TiO2nanotubes
(anatase, from H2Ti2O5H2O, dark yellow, 75:15:10, 1.3 g/cm3) [62],
porous brookite (navy, 80:10:10 1.05 g/cm3) [69], anatase nanowire
(olive, 90:10:10, 1.3 g/cm3)[70], and 3 nm TiO2(B) nanoparticle (blue,
[image:7.595.302.536.183.554.2]and the rate capability. Due to the low thermal stability, the TiO2(B) cannot be treated under temperature above 4001C to
obtain a highly conductive carbon coating as in the case of LiFePO4. Interestingly, during tests on the electrochemical
performance of nanoparticulate TiO2(B), it is found that after
mild thermal treatment of TiO2(B) nanoparticles under dry air
at 3001C for 1 h, the material demonstrates extremely high power (rate capability), which is the best for all the reported titanate at rate41000 mA/g[37].
The variation of gravimetric capacity with different charge/discharge rates is shown inFig. 7a, where the data of nanoparticulate TiO2(B) are
compared with several other titanate materials including nanoparticulate anatase (6 nm diameter), which corresponds to the best previously reported rate capability of any titanate[8,43]. The gravimetric capacity for the TiO2(B) nanoparticles at all rates up to 18,000 mA/g is almost
identical to the 6 nm anatase particles, which have a much higher proportion of carbon (45 wt%, significantly more than the TiO2(B)
nanoparticles and corresponding to a mass loading of only 1.5 mg/cm2) in their composite electrodes.
The effect of diluting the active material by a large amount of carbon (as in the case of the 6 nm anatase nanoparticles) is evident on examining the volumetric capacity (based on the total volume of the composite electrode) as a function of rate (Fig. 7b). Nanoparticulate TiO2(B) exhibits superior volumetric capacity at all rates compared
with the 6 nm anatase material and the previously reported best high rate (41000 mA/g) volumetric capacity, namely mesoporous anatase. The relatively high volumetric capacity of the TiO2(B) nanoparticles is
in part due to the agglomerates formed by the primary nanoparticles, which helps to ensure a higher density of particles. The understanding of the cause of the high rate capability of TiO2(B) nanoparticles will
help the realization of high power of other TiO2(B) anode materials in
Li-ion batteries.
7. The incorporation of TiO2(B) nanomaterials anodes into a full battery
Armstrong et al. incorporated the nanowire TiO2(B) anode into a gel
polymer electrolyte (GPE) based full battery [71]. Average cell potentials of approximately 2 and 3 V were obtained by using LiFePO4 or LiNi0.5Mn1.5O4 as the cathode, respectively. Cycling
stability is very good as is rate capability, with 80% of the low-rate capacity being retained at 5C (Fig. 8). Anode-limited cells serve to
demonstrate the superior capacity of these cells compared to similar batteries constructed using Li4Ti5O12instead of TiO2(B) (225 mAh g–
1
compared to 150 mAh g−1 at C/5). Combined with their superior safety and inherent overcharge protection compared to a graphite anode, and given the intense interest in developing lithium-ion cells with Li4Ti5O12anodes, the present results demonstrate the potential
of TiO2(B) as an anode in future lithium-ion batteries[71].
8. Conclusion
In this review, we have summarized the different synthesis methods for the nanostructured TiO2(B); then we introduced the origin and
mitigation of thefirst cycle irreversible capacity. The size effect on the electrochemistry properties, the nanostructure simulation and conduc-tivity issues have also been discussed. The utilization of nanosized TiO2(B) anode material in Li-ion batteries has to resolve the following
hurdles: the irreversible capacity, the rate capability, and the volu-metric energy density, which is of vital importance for the EV.
Acknowledgments
Y. Ren is indebted to Russell Trust for a travel grant. P.G. Bruce is grateful to the EPSRC including SUPERGEN and the program grant
“Nanoionics” forfinancial support. Y. Ren is grateful to Shenhua Group for the funding support.
References
[1] K.M. Colbow, J.R. Dahn, R.R. Haering, Journal of Power Sources 26 (1989) 397.
[2] E. Ferg, R.J. Gummow, A. Dekock, M.M. Thackeray, Journal of the Electrochemical Society 141 (1994) L147.
[3] T. Ohzuku, A. Ueda, N. Yamamoto, Journal of the Electrochemical Society 142 (1995) 1431.
[4] G. Sudant, E. Baudrin, D. Larcher, J.M. Tarascon, Journal of Materials Chemistry 15 (2005) 1263.
[5] I. Plitz, A. DuPasquier, F. Badway, J. Gural, N. Pereira, A. Gmitter, G.G. Amatucci, Applied Physics A: Materials Science and Processing 82 (2006) 615.
[6] Y.G. Guo, Y.S. Hu, W. Sigle, J. Maier, Advanced Materials 19 (2007) 2087.
Fig. 8 (a) Variation of charge and discharge capacities versus cycle number for the TiO2(B)–GPE–LiNi0.5Mn1.5O4battery cycled between 2 and
3.5 V at room temperature and at a rate of C/2; (b) Variation of discharge capacity as a function of rate, cycled between 2 and 3.5 V, expressed in terms of percentage of the maximum capacity obtained at low rate for the TiO2(B)–GPE–LiNi0.5Mn1.5O4battery at room temperature [71].
[image:8.595.132.477.61.198.2][7] M. Wagemaker, W.J.H. Borghols, F.M. Mulder, Journal of the American Chemical Society 129 (2007) 4323.
[8] C.H. Jiang, M.D. Wei, Z.M. Qi, T. Kudo, I. Honma, H.S. Zhou, Journal of Power Sources 166 (2007) 239.
[9] G.-N. Zhu, Y.-G. Wang, Y.-Y. Xia, Energy and Environmental Science 5 (2012) 6652.
[10] W.J.H. Borghols, M. Wagemaker, U. Lafont, E.M. Kelder, F.M. Mulder, Chemistry of Materials 20 (2008) 2949.
[11] M. Wagemaker, E.R.H. van Eck, A.P.M. Kentgens, F.M. Mulder, Journal of Physical Chemistry B 113 (2009) 224.
[12] D. Deng, M.G. Kim, J.Y. Lee, J. Cho, Energy and Environmental Science 2 (2009) 818.
[13] K. Amine, I. Belharouak, Z. Chen, T. Tran, H. Yumoto, N. Ota, S.-T. Myung, Y.-K. Sun, Advanced Materials 22 (2010) 3052. [14] A. Du Pasquier, C.C. Huang, T. Spitler, Journal of Power Sources
186 (2009) 508.
[15] T. Tan, H. Yumoto, D. Buck, B. Fattig, C. Hartzog, World Electric Vehicle Journal 2 (2007) 76.
[16] N. Takami, K. Hoshina, H. Inagaki, Journal of the Electrochemical Society 158 (2011) A725.
[17] N. Takami, H. Inagaki, T. Kishi, Y. Harada, Y. Fujita, K. Hoshina, Journal of The Electrochemical Society 156 (2009) A128.
[18] P. Reale, S. Panero, B. Scrosati, Journal of The Electrochemical Society 152 (2005) A1949.
[19] L. Kavan, J. Prochazka, T.M. Spitler, M. Kalbac, M.T. Zukalova, T. Drezen, M. Gratzel, Journal of The Electrochemical Society 150 (2003) A1000.
[20] Y.X. Zhang, G.H. Li, Y.X. Jin, Y. Zhang, J. Zhang, L.D. Zhang, Chemical Physics Letters 365 (2002) 300.
[21] B.D. Yao, Y.F. Chan, X.Y. Zhang, W.F. Zhang, Z.Y. Yang, N. Wang, Applied Physics Letters 82 (2003) 281.
[22] Q. Chen, W.Z. Zhou, G.H. Du, L.M. Peng, Advanced Materials 14 (2002) 1208.
[23] A.R. Armstrong, G. Armstrong, J. Canales, P.G. Bruce, Angewandte Chemie International Edition 43 (2004) 2286.
[24] G. Armstrong, A.R. Armstrong, J. Canales, P.G. Bruce, Chemical Communications (2005) 2454.
[25] Y.G. Andreev, P.G. Bruce, Journal of the American Chemical Society 130 (2008) 9931.
[26] J.F. Banfield, D.R. Veblen, American Mineralogist 77 (1992) 545. [27] D.T. Cromer, K. Herrington, Journal of the American Chemical
Society 77 (1955) 4708.
[28] L. Kavan, M. Grätzel, S.E. Gilbert, C. Klemenz, H.J. Scheel, Journal of the American Chemical Society 118 (1996) 6716.
[29] R. Marchand, L. Brohan, M. Tournoux, Materials Research Bulletin 15 (1980) 1129.
[30] M. Latroche, L. Brohan, R. Marchand, M. Tournoux, Journal of Solid State Chemistry 81 (1989) 78.
[31] J. Akimoto, Y. Gotoh, Y. Oosawa, N. Nonose, T. Kumagai, K. Aoki, H. Takei, Journal of Solid State Chemistry 113 (1994) 27. [32] P.Y. Simons, F. Dachille, Acta Crystallographica 23 (1967) 334. [33] H. Sato, S. Endo, M. Sugiyama, T. Kikegawa, O. Shimomura,
K. Kusaba, Science 251 (1991) 786.
[34] N.A. Dubrovinskaia, L.S. Dubrovinsky, R. Ahuja, V.B. Prokopenko, V. Dmitriev, H.P. Weber, J.M. Osorio-Guillen, B. Johansson, Physical Review Letters 87 (2001) 275501.
[35] L.S. Dubrovinsky, N.A. Dubrovinskaia, V. Swamy, J. Muscat, N.M. Harrison, R. Ahuja, B. Holm, B. Johansson, Nature 410 (2001) 653. [36] M. Inaba, Y. Oba, F. Niina, Y. Murota, Y. Ogino, A. Tasaka,
K. Hirota, Journal of Power Sources 189 (2009) 580.
[37] Y. Ren, Z. Liu, F. Pourpoint, A.R. Armstrong, C.P. Grey, P.G. Bruce, Angewandte Chemie International Edition 51 (2012) 2164. [38] A.R. Armstrong, G. Armstrong, J. Canales, R. Garcia, P.G. Bruce,
Advanced Materials 17 (2005) 862.
[39] G. Armstrong, A.R. Armstrong, J. Canales, P.G. Bruce, Electroche-mical and Solid-State Letters 9 (2006) A139.
[40]M. Kobayashi, V.V. Petrykin, M. Kakihana, Chemistry of Materials 19 (2007) 5373.
[41]P.G. Bruce, B. Scrosati, J.M. Tarascon, Angewandte Chemie Inter-national Edition 47 (2008) 2930.
[42]A.S. Arico, P. Bruce, B. Scrosati, J.M. Tarascon, W. Van Schalkwijk, Nature Materials 4 (2005) 366.
[43]Y. Ren, L.J. Hardwick, P.G. Bruce, Angewandte Chemie Interna-tional Edition 49 (2010) 2570.
[44] A.G. Dylla, G. Henkelman, K.J. Stevenson, Accounts of Chemical Research, Article ASAPhttp://dx.doi.org/10.1021/ar300176y. [45]C.H. Jiang, I. Honma, T. Kudo, H.S. Zhou, Electrochemical and
Solid-State Letters 10 (2007) A127.
[46]P. Poizot, S. Laruelle, S. Grugeon, L. Dupont, J.M. Tarascon, Nature 407 (2000) 496.
[47]D. Aurbach, B. Markovsky, I. Weissman, E. Levi, Y. Ein-Eli, Electrochimica Acta 45 (1999) 67.
[48]P. Verma, P. Maire, P. Novák, Electrochimica Acta 55 (2010) 6332. [49]S. Brutti, V. Gentili, H. Menard, B. Scrosati, P.G. Bruce, Advanced
Energy Materials 2 (2012) 322.
[50]G. Gachot, S. Grugeon, M. Armand, S. Pilard, P. Guenot, J.-M. Tarascon, S. Laruelle, Journal of Power Sources 178 (2008) 409.
[51]M.K. Rahman, Y. Saito, Journal of Power Sources 174 (2007) 889.
[52]H. Ota, A. Kominato, W.-J. Chun, E. Yasukawa, S. Kasuya, Journal of Power Sources 119–121 (2003) 393.
[53]A.R. Armstrong, C. Arrouvel, V. Gentili, S.C. Parker, M.S. Islam, P. G. Bruce, Chemistry of Materials 22 (2010) 6426.
[54]L. Brohan, R. Marchand, Solid State Ion 9–10 (1983) 419. [55]P. Gibot, M. Casas-Cabanas, L. Laffont, S. Levasseur, P. Carlach, S.
Hamelet, J.-M. Tarascon, C. Masquelier, Nature Materials 7 (2008) 741. [56]N. Meethong, H.Y.S. Huang, W.C. Carter, Y.M. Chiang,
Electro-chemical and Solid-State Letters 10 (2007) A134.
[57] G. Kobayashi, S.-i. Nishimura, M.-S. Park, R. Kanno, M. Yashima, T. Ida, A. Yamada, Advanced Functional Materials 19 (2009) 395.
[58]L.J. Hardwick, M. Holzapfel, P. Novak, L. Dupont, E. Baudrin, Electrochimica Acta 52 (2007) 5357.
[59]T. Beuvier, M. Richard-Plouet, M. Mancini-Le Granvalet, T. Brousse, O. Crosnier, L. Brohan, Inorganic Chemistry 49 (2010) 8457. [60]J. Li, W. Wan, H. Zhou, J. Li, D. Xu, Chemical Communications 47
(2011) 3439.
[61]S.H. Nam, H.-S. Shim, Y.-S. Kim, M.A. Dar, J.G. Kim, W.B. Kim, ACS Applied Materials and Interfaces 2 (2010) 2046.
[62]H. Kim, M.G. Kim, T.J. Shin, H.-J. Shin, J. Cho, Electrochemistry Communications 10 (2008) 1669.
[63] Z. Yang, G. Du, Z. Guo, X. Yu, Z. Chen, T. Guo, H. Liu, Journal of Materials Chemistry, 21, 8591.
[64] F. Wang, K. Zhang, Journal of Molecular Catalysis A: Chemical, 345, 101.
[65]Q. Wang, Z.H. Wen, J.H. Li, Advanced Functional Materials 16 (2006) 2141.
[66] A.S. Prakash, P. Manikandan, K. Ramesha, M. Sathiya, J.M. Tarascon, A.K. Shukla, Chemistry of Materials 22 (2010) 2857.
[67]F.-F. Cao, X.-L. Wu, S. Xin, Y.-G. Guo, L.-J. Wan, Journal of Physical Chemistry C 114 (2010) 10308.
[68]H. Liu, Z. Bi, X.-G. Sun, R.R. Unocic, M.P. Paranthaman, S. Dai, G.M. Brown, Advanced Materials 23 (2011) 3450.
[69]D. Dambournet, I. Belharouak, K. Amine, Chemistry of Materials 22 (2009) 1173.
[70]M.G. Kim, H. Kim, J. Cho, Journal of the Electrochemical Society 157 (2010) A802.
Peter Bruce(FRS, FRSE, FRSC), is Wardlaw Professor of Chemistry at the University of St Andrews. His research interests embrace materi-als chemistry and electrochemistry, and include the synthesis and characterisation of new materi-als with new properties or combinations of properties for new generations of energy con-version and storage devices, especially lithium batteries. Recent work has focussed on nano-intercalation materials, new methods of structure determination and the potentially transforma-tional Li-air battery. His research has been recognised by a number of awards and fellowships, including from the Royal Society, the Royal Society of Chemistry, The Electrochemical Society and the German Chemical Society.
![Fig. 1The structure of (a) anatase, (b) brookite, (c) rutile, and (d) TiO2(B); (e) the images of the TiO2(B) structure before and afterLi-intercalation, showing the preferred Li+ diffusion path [12]](https://thumb-us.123doks.com/thumbv2/123dok_us/8725264.385336/2.595.63.540.59.399/structure-anatase-brookite-structure-intercalation-showing-preferred-diffusion.webp)

![Table 2Surface treatment effect on the electrochemistry of the TiO2(B) nanotubes (i¼C/20¼17 mA/g).[49]](https://thumb-us.123doks.com/thumbv2/123dok_us/8725264.385336/5.595.303.537.236.555/table-surface-treatment-effect-electrochemistry-tio-b-nanotubes.webp)


