doi:10.4236/jbise.2009.26058
ECG arrhythmia classification based on logistic model
tree
V. Mahesh1, A. Kandaswamy2, C. Vimal2, B. Sathish2
1
Department of Information Technology, PSG College of Technology, Coimbatore, India; 2Department of Bio-Medical Engineering, PSG College of Technology, Coimbatore, India.
Email: [email protected]; [email protected]; [email protected]; [email protected]
Received 6 May 2008; revised 25 May 2009; accepted 9 June 2009.
ABSTRACT
This paper presents a diagnostic system for classification of cardiac arrhythmia from ECG data, using Logistic Model Tree (LMT) classifier. Clinically useful information in the ECG is found in the intervals and amplitudes of the charac-teristic waves. Any abnormality in the wave shape and duration of the wave features of the ECG is considered as arrhythmia. The ampli-tude and duration of the characteristic waves of the ECG can be more accurately obtained using Discrete Wavelet Transform (DWT) analysis. Further, the non-linear behavior of the cardiac system is well characterized by Heart Rate Variability (HRV). Hence, DWT and HRV tech-niques have been employed to extract a set of linear (time and frequency domain) and non- linear characteristic features from the ECG signals. These features are used as input to the LMT classifier to classify 11 different arrhyth-mias. The results obtained indicate an impres-sive prediction accuracy of 98%, validating the choice and combined use of the current popular techniques (DWT and HRV) for cardiac ar-rhythmia classification. The system can be de-ployed for practical use after validation by ex-perts.
Keywords: ECG; Arrhythmia; Wavelet Transform; HRV Analysis; Feature Extraction
1. INTRODUCTION
Electrocardiography is a commonly used, non-invasive procedure for recording electrical changes in the heart. The record, which is called an electrocardiogram (ECG or EKG), shows the series of waves that relate to the electrical impulses which occur during each beat of the heart. The information present in the ECG characteristic wave peaks and time intervals between them are
impor-tant. The waves in a normal record are named P, Q, R, S, and T and follow in alphabetical order. Any abnormal change in the shape and variation of time intervals is considered as arrhythmia.
Detection of abnormal ECG signals is a critical step in administering aid to patients. Arrhythmias can occur in a healthy heart and be of minimal consequence. They may also indicate a serious problem and lead to heart disease, stroke or sudden cardiac death. Cardiac arrhythmia is one of the major causes of sudden death. To detect the presence of arrhythmia, patients are hooked to cardiac monitors in hospitals. This requires continuous monitor-ing by the physicians. Visual inspection is tedious and physician dependent. Computer programs have been developed to help in this visual analysis by providing condensed printouts. This again requires meticulous study by the physician to identify arrhythmia. To cater to large number of patients, to eliminate subjective inaccu-racies and to aid the physician in the diagnosis several methods for automated arrhythmia detection have been developed in the past few decades to attempt simplify the monitoring task and improve diagnostic efficiencies.
SciRes Copyright © 2009 Openly accessible at http://www.scirp.org/journal/JBISE/ modeling and Generalized Linear Model (GLM) [5].
Linh et al. selected the Hermite Function Expansion as the feature extraction method to represent the QRS com-plex. They proposed a fuzzy neural network where Her-mite coefficients served as the features to classify only seven different types of arrhythmias [6]. Kannathal et al. used three non-linear parameters as inputs to the pro-posed ANF classifier for classification of only ten dif-ferent types of arrhythmias [7]. Kadbi et al. used wavelet parameters along with RR interval and Form Factor as inputs to an ANN classifier to discriminate only ten dif-ferent arrhythmias [8].
In clinical domains, one has to face the problem of developing classifiers that are able to deal with nonlinear discrimination between classes, incomplete or ambigu-ous input patterns, and suppression of false alarms. It is necessary to develop new detection schemes with a high level of accuracy, or equivalently, low false-positive and false-negative statistics, for them to be useful in practical applications. In this direction a new approach based on Logistic Model Tree classifier is presented in this paper. LMT is a recent addition to decision trees that replace the terminal nodes of a decision tree with logistic regres-sion functions. This has the advantage of producing de-cision trees that are more comprehensible, have higher accuracy, and have higher fidelity than previous decision tree extraction algorithms [9].
2. DATA SOURCE AND CONTENT
ECG data for use in this classification work has been collected from the MIT-BIH arrhythmia database as published in Physionet, a site dedicated to data for vari-ous diseases and their study [10]. The database contains 48 recordings, each containing two 30-min ECG lead signals (denoted A and B). In 45 recordings, lead A is modified-lead II and for the other three is lead V5. Lead B is lead V1 for 40 recordings and is either lead II, V2, V4 or V5 for the other recordings. Twenty-three records, numbered from 100 to 124 with some numbers missing, serve as a representative sample of routine clinical re-cordings and the remaining twenty-five records, num-bered from 200 to 234 again with some numbers missing, contain complex ventricular and supraventricular ar-rhythmias. In this work, ECG signals from Modified Lead II (MLII) leads are chosen. Prior to recording, the ECG signals in these records have been sampled at a frequency of 360Hz and preprocessed to remove noise due to power-line interference, muscle tremors, spikes etc. This database was selected because it contains a variety of beat types. Another reason for considering this database was its use in other studies and thus compari-son of results can be performed. One minute segments of each beat type were extracted from the records for fur-ther processing. This work focused on several important arrhythmia types such as Paced beat (P), Atrial
prema-ture beat (A), Right bundle branch block beat (R), Left bundle branch block beat (L), Ventricular escape beat (E), Ventricular flutter wave (!), premature ventricular con-traction (V), Fusion of ventricular and normal beat (F), Fusion of paced (f), Blocked Atrial Premature Beat (x) and the Normal beat segment (Normal). The number of segments extracted for each type from the database re-cords is given in Table 1.
3.
FEATURE EXTRACTION
The main objective of the feature extraction process is to derive a set of parameters that best characterize the sig-nal. These parameters, in other words, should contain maximum information about the signal. Hence the selec-tion of these parameters is an important criterion to be considered for proper classification. Arrhythmia classi-fication, therefore, involves determination of several characteristic features of the ECG signal. This work ex-plores a combination of linear (time and frequency do-main) and non-linear characteristic features of the ECG signal. The Discrete Wavelet Transform has been used to obtain the amplitude and duration of the characteristic waves of the ECG from which a set of time-domain pa-rameters are derived. The DWT is also used to obtain the RR interval time series. Heart Rate Variability (HRV) helps in understanding the non linear behavior of the cardiac system. Using the RR series a set of non linear parameters are also derived.
3.1. Time-Domain Analysis
For each of the segments extracted from the records, the characteristic points P, Q, R, S and T are obtained using Discrete Wavelet Transform.
3.1.1. Discrete Wavelet Transform (DWT)
[image:2.595.318.529.551.719.2]The wavelet transform is a convolution of the wavelet function (t) with the signal x(t). Orthonormal dyadic discrete wavelets are associated with scaling functions
Table 1. Arrhythmia types classified in proposed method.
Type of Arrhythmia No of Segments Ex-tracted
Normal 459
P 105
A 123
R 99
L 108
E 18
! 24
V 290
F 16
f 27
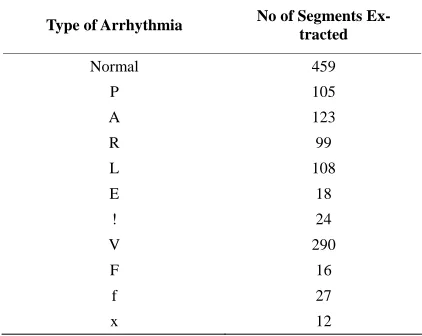
tion A1 respectively. The first approximation A1 is composed again and this process is continued. The de-composition of the signal into different frequency bands is simply obtained by successive highpass and lowpass filtering of the time domain signal. The signal decompo-sition can be mathematically expressed as follows: (t). The scaling function can be convolved with the
signal to produce approximation coefficients A. The wavelet transform of the signal x(t) can be written as:
, ( ) , ( ) .
m n m n t d t
T x t
(1)By choosing an orthonormal wavelet basis, m, n (t), one can reconstruct the original signal [11]. The ap-proximation coefficients of the signal at scale m and location n can be represented by:
hi
y [k] =
x[n].g[2k - n] (3)lo
y [k] =
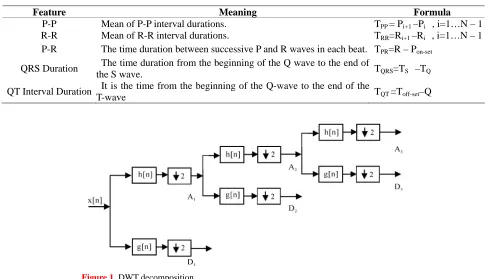
x[n].h[2k - n] (4)The characteristic points P, Q, R, S and T are obtained at different decomposition levels as shown in Figure 2.
, ( ) , ( ) .
m n m n t d t
A x t
(2) Segment selection
8-level wavelet decomposition using Daube-chies 6 wavelet functions
3.1.2. DWT Decomposition
Discrete Wavelet Transform involves decomposition of a signal by wavelet filter banks. DWT uses two filters, a low pass filter (LPF) and a high pass filter (HPF) to de-compose the signal into different scales. The output co-efficients of the LPF are called approximations while the output coefficients of the HPF are called details. The approximations of the signal are what define its identity while the details only imparts nuance [12].
Detection of R peak at level 4 using adaptive threshold value (related to the maximum and mean values of the signal)
Determination of R-R interval using R-R dis-tance
Detection of Q, S points as local minimum points at level 0, before and after R wave
Elimination of the QRS complex from the signal to obtain other parameters
The DWT decomposition of an input signal x[n] is schematically shown in the Figure 1 below. Each stage consists of two digital filters and two downsamplers to produce the digitized signal. The first filter, g[n] is a high-pass filter, and the second, h[n] is a low-pass filter. The downsampled outputs of the first high pass filter and low-pass filter provide the detail D1 and the approxima-
Detection of T wave at level 6 and 7 for finding QT distance
Detection of P wave at level 6 and 7 for finding P-R and P-P distance
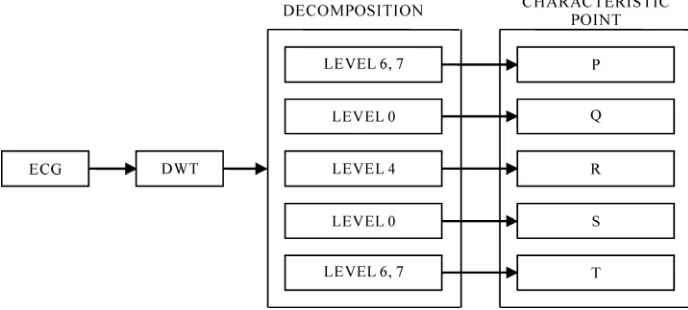
From the values obtained the following five time- domain parameters have been calculated:
Feature Meaning Formula P-P Mean of P-P interval durations. TPP = Pi+1 –Pi , i=1…N – 1
R-R Mean of R-R interval durations. TRR=Ri+1 –Ri , i=1…N – 1
P-R The time duration between successive P and R waves in each beat. TPR=R – Pon-set
QRS Duration The time duration from the beginning of the Q wave to the end of
the S wave. TQRS=TS –TQ
QT Interval Duration It is the time from the beginning of the Q-wave to the end of the
[image:3.595.54.553.437.716.2]T-wave TQT =Toff-set–Q
SciRes Copyright © 2009 Openly accessible at http://www.scirp.org/journal/JBISE/ n
3.2. Frequency Domain Analysis
Time-domain methods are computationally simple but lack the ability to discriminate between sympathetic and parasympathetic contributions of HRV. Spectral analysis is the most popular linear technique used in the analysis of HRV signals [13]. Spectral power in the high fre-quency (HF) (0.15–0.4 Hz) band reflects respiratory sinus arrhythmia (RSA) and thus cardiac vagal activity. Low frequency (LF) (0.04–0.15Hz) power is related to baroreceptor control and is mediated by both vagal and sympathetic systems [14]. Hence, the frequency domain parameter LF/HF, which is the ratio between LF and HF band powers, is obtained for each segment.
3.3. Non-Linear Analysis
The cardiovascular system is a complex non-linear sys-tem and is characterized by many complex estimators. In this classification work the following parameters have been derived from the RR-interval time series obtained using DWT.
3.3.1. Spectral Entropy
The power spectral density (PSD) of a signal is the dis-tribution of power as a function of frequency. This PSD can be obtained using Fourier transform. The normaliza-tion of this PSD yields the probability density funcnormaliza-tion (PDF) [15]. This PDF has a value in the range
0 p f 1 f 1 , 2 , . . . , (5)
1
1
n f f
p
(6) The spectral entropy H which describes the complex-ity of the heart rate variabilcomplex-ity (HRV) signal is obtained using Eq.(7).1
f
f f
H p
p
(7)Here pf is the probability density function at f. The spec
tral entropy H calculated for each segment is used as one of the classifying parameters [16].
3.3.2. Detrended Fluctuation Analysis (DFA) The Detrended Fluctuation Analysis (DFA) is used to quantify the fractal scaling properties of short time R-R interval signals. This technique is a modification of the root-mean square analysis of random walks applied to nonstationary signals [17]. The root-mean-square fluc-tuation of an integrated and detrended time series is measured at different observation windows and plotted against the size of the observation window on a log-log scale. First, the R-R time series (of total length N) is integrated using the equation:
1
( ) ( ( ) ))
k
avg i
y k RR i RR
(8)where y(k) is the kth value of the integrated series, RR(i) is the ith inter beat interval and RRavg is the average inter beat interval over the entire series [18]. Then, the integrated time series is divided into windows of equal length, n. In each window of length n, a least squares line is fitted to the R-R interval data (representing the trend in that window). The ‘y’ coordinate of the straight line segments are denoted by yn(k) . Next, we detrend the integrated time series, yn(k) in each window. The root mean-square fluctuation of this integrated and de-trended series is calculated using Eq.(9) for each seg-ment.
2 1
1
( ) [ ( ) ( )]
N
n k
F n y k y
N
k (9)4. LOGISTIC MODEL TREES CLASSIFIER
[image:4.595.124.468.550.705.2]Logistic Model Trees are a combination of a tree struc-ture and logistic regression functions to produce a single decision tree [19,20,21,22]. The decision tree structure has the logistic regression functions at the leaves. The leaf node has two child nodes which is branched right
k
and left depending on the threshold. If the value of the attribute is smaller than the threshold it is sorted to left branch and value of attribute greater than the threshold it is sorted to right branch as shown in Figure 3.
The threshold is usually fixed by Logit Boost method [19]. Logit Boost uses a ensemble of functions FK to predict classes 1, . . . , K using M “weak learners”.
1
( ) ( )
K
k m
m
F x f
x (10)Steps followed for developing the LMT classifier: The linear regression function is fitted using the
Logitboost method to build a logistic model. The Logitboost method uses 5 examples for the cross validation to determine the best number of iterations to run, when fitting the logistic regres-sion function at a node of the deciregres-sion tree The logistic model is built using all data.
The split of the data at the root is constructed using the threshold.
This splitting is continued till some stopping
criterion is met. Here the stopping criterion is 5 examples, since it helps in cross validation for logitboost method.
Once the tree has been build it is pruned using CART-based pruning [19].
Reasons for choosing the Logistic Model Tree classifier: Logistic Regression is very good at detecting
linear relationships and then combining those relationships into an equation that provides the odds of the dependent variable reaching a par-ticular outcome, when the various independent variables are fed into the resulting equation. Logistic Regression models are widely used and
they are considered robust and not prone to over fitting the data.
These models can be built with high level of accuracy using little data preparation.
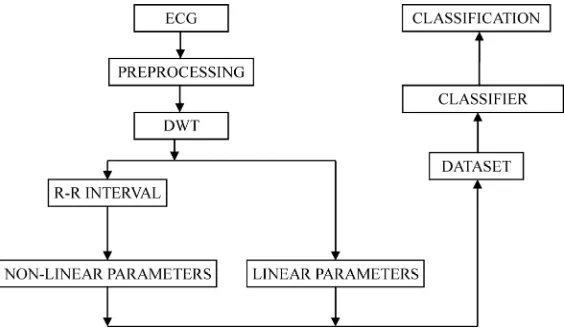
[image:5.595.178.416.333.507.2] Logistic Model Trees give explicit class prob-ability estimates rather than just a classification. The classification task, depicted in Figure 4, involves the following steps:
Figure 3.Tree structure of logistic model tree (LMT).
[image:5.595.157.439.542.706.2]SciRes Copyright © 2009 Openly accessible at http://www.scirp.org/journal/JBISE/
One minute segments of each beat type are ex-tracted from ECG records in the database. Each segment is then decomposed using DWT
into various levels for extracting linear time- domain parameters.
The different nonlinear parameters are calcu-lated using their respective formula.
Both linear and non-linear parameters for all the segments are combined and a dataset is formed. 75% of the dataset, called training set, is used
for training the classifier.
The remaining 25% of the dataset, called test set, is used for testing the classifier.
5. RESULTS AND DISCUSSIONS
The objective of any clinical research is to find the rela-tionship between results and presence of any disease.
For the evaluation of the proposed classifier, a total of 1281 segments, extracted from the MIT BIH arrhythmia database records were used. Five time-domain, one fre-quency domain and two non-linear parameters were de-rived from these segments. These eight parameters along with the corresponding output class (type of arrhythmia) forms a feature vector. Thus 1281 feature vectors com-prise the dataset. 75% of each type from this dataset was used as the train dataset and the remaining 25% as the test dataset. The output obtained from the Logistic Model Tree was used to calculate the accuracy of each type of beat using Eq.(11)).
Number of beats correctly classified Accuracy
Total number of beats
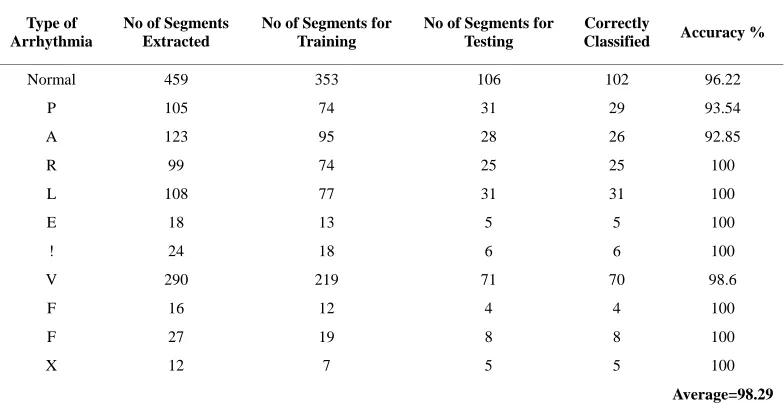
[image:6.595.102.494.313.517.2](11) The experimental results are presented in Table 2.
Table 2. Performance of the proposed method.
Type of Arrhythmia
No of Segments Extracted
No of Segments for Training
No of Segments for Testing
Correctly
Classified Accuracy %
Normal 459 353 106 102 96.22
P 105 74 31 29 93.54
A 123 95 28 26 92.85
R 99 74 25 25 100
L 108 77 31 31 100
E 18 13 5 5 100
! 24 18 6 6 100
V 290 219 71 70 98.6
F 16 12 4 4 100
F 27 19 8 8 100
X 12 7 5 5 100
Average=98.29
Table 3. Performance comparison of different ECG arrhythmia classifiers.
Work Reference Types Accuracy (%) Feature Extraction Method Classifier
Palreddy [1] 2 98.58% LVQ SOM
Babak [2] 5 99.38% HRV NN
Lee [3] 5 99.48% WT LDA/MLP
Chazal[4] 5 96.87% ECG Morphology/ Interval LDA
Dingfie [5] 6 93.2% AR Modeling GLM
Linh [6] 7 96% HER FNN
Kannathal [7] 10 94.64% HRV ANN
Kadbi [8] 10 90% WT Cascade ANN
[image:6.595.99.506.550.723.2]Table 3 shows the performance comparison of the different ECG arrhythmia classifiers
.
The proposed me- thod shows comparable performance even when 11 dif-ferent types of arrhythmias have been considered.6. CONCLUSIONS
In this paper, the effectiveness of the Logistic Model Tree classifier for arrhythmia classification has been demonstrated. The Logistic Model Tree classifier was fed by the combination of linear and non-linear parame-ters derived from ECG data using DWT and HRV. The results indicate that the proposed method employing the LMT classifier with linear and nonlinear parameters is effective for classification of cardiac arrhythmias with an acceptably high accuracy. Compared to other approaches in the literature cited, the proposed method exploits the power of HRV and DWT techniques in discriminating 11 different arrhythmia types. Parameters derived from ECG features and HRV analysis can therefore be used as a reliable indicator of different types of arrhythmias. The proposed system, after validation by experts, can serve as a diagnostic tool and aid the physician in the detection and classification of cardiac arrhythmias.
REFERENCES
[1] S. Palreddy, Y. H. Hu, V. Mani, and W. J. T ompkins (1997) A multipleclassifier architecture for ECG beat classification, IEEE Workshop on Neural Network for Signal Processing, 172–181.
[2] B. Mohammadzadeh-Asl and S. K. Setarehdan, (2006) Neural network based arrhythmia classification using heart rate variability signal, Proceedings of the EUSI- PCO.
[3] J. Lee, K. L. Park, M. H. Song, and K. J. Lee, (2005) Arrhythmia classification with reduced features by linear discriminant analysis,IEEE EMBS 2005, 27th Annual International Conference, Engineering in Medicine and Biology Society, 1142–1144.
[4] P. Chazal, M. O’Dwyer, and R. B. Reilly, (2004) Auto-matic classification of heartbeats using ECG morphology and heartbeat interval features, IEEE Trans. Biomedical Engineering, 51(7), 1196–1206.
[5] G. Dingfei, N. Srinivasan, and S. Krishnan, (2002) Car-diac arrhythmia classification using autoregressive mod-eling,BioMedical Engineering OnLine, 1–5.
[6] T. H. Linh, S. Osowki, and M. Stodolski, (2003) On-line heart beat recognition using hermite polynomials and neuro-fuzzy network, IEEE Trans. Instrumentation and Measurement, 52(4), 1224–1231.
[7] N. Kannathal, S. K. Puthusserypady, C. M. Lim, U. R. Acharya, and S. Laxminarayan, (2005) Cardiac state di-agnosis using adaptive neuro-fuzzy technique,
Proceed-ings of the IEEE Engineering in Medicine and Biology 27th Annual Conference Shanghai, China.
[8] M. H. Kadbi, J. Hashemi, H. R. Mohseni and A. Magh-soudi, (2006) Classification of ECG arrhythmias based on statistical and time-frequency features, 3rd Interna-tional Conference on Advances in Medical, Signal and Information Processing, MEDSIP.
[9] D. Dancey, Z. A. Bandar, and D. McLean, (2007) Logis-tic model tree extraction from artificial neural networks, IEEE Trans on Systems, Man and Cybernetics, 37(4), 794–802.
[10] http://www.physionet.org/physiobank/database/mitdb/. [11] S. Z. Mahmoodabadi, A. Ahmadian, M. D. Abolhasani,
M. Eslami, and J. H. Bidgoli, (2005) ECG feature extrac-tion based on multiresoluextrac-tion wavelet transform, in Proc. IEEE Engineering in Medicine and Biology, 3902–3905. [12] E. M. Tamil, N. H. Kamarudin, R. Salleh, M. Yamani
Idna Idris, M. N. Noorzaily, and A. M. Tamil, (2008) Heartbeat electrocardiogram (ECG) signal feature extrac-tion using discrete wavelet transforms (DWT), in Pro-ceedings of CSPA, 1112–1117.
[13] D. N. Dutt and S. M. Krishnan, (2000) Computer proc-essing of heart rate variability signals for detection of pa-tient status in cardiac care units, Current Science, 78(7), 864–868.
[14] Task force of the European society of cardiology and the North American society of pacing and electrophysiology (1996), Heart rate variability–standards of measurements, physiological interpretation, and clinical use, European Heart Journal, 17, 354–381.
[15] S. I. Niwas, R. S. S. Kumari, and V. Sadasivam, (2005) Artificial neural network based automatic cardiac ab-normalities classification, Proceeding of the Sixth Inter-national Conference on Computational Intelligence and Multimedia Application.
[16] U. R. Acharya, A. Kumar, P. S. Bhat, C. M. Lim, S. S. Iyengar, N. Kannathal, and S. Krishnan, (2004) Classifi-cation of cardiac abnormalities using heart rate signals, medical, Biological Engineering and Computing, 42, 288–293.
[17] H. Kun, C. I. Plamen, C. Zhi, C. Pedro, and H. E. Stanley, (2001) Effect of trends on detrended fluctuation analysis, Physical Review E, 64, 011114.
[18] R. U. Acharya, C. M. Lim, and P. Joseph, (2002) Heart rate variability analysis using correlation dimension and detrended fluctuation analysis, ITBM–RBM, 23(6), 333– 339.
[19] N. Landwehr, M. Hall, and E. Frank, (2005) Logistic model trees, Machine Learning, 59(1/2), 161–205. [20] D. W. Hosmer and S. Lemeshow, (2000) Applied logistic
regression, 2nd Edition, Wiley-Interscience, New York. [21] J. Friedman, T. Hastie, and R. Tibshirani, (2000) Additive
logistic regression: A statistical view of boosting, Annals of Staistics, 32(2), 337–374.