DOI:10.1051/0004-6361/201322455 c
ESO 2014
Astrophysics
&
[O
I
] disk emission in the Taurus star-forming region
G. Aresu
1,2, I. Kamp
1, R. Meijerink
1,3, M. Spaans
1, S. Vicente
1, L. Podio
5,6, P. Woitke
4, F. Menard
5,7, W.-F. Thi
5,
M. Güdel
8, and A. Liebhart
81 Kapteyn Astronomical Institute, Postbus 800, 9700 AV Groningen, The Netherlands e-mail:giambattista.aresu@gmail.com
2 INAF, Osservatorio Astronomico di Cagliari, via della Scienza 5, 09047 Selargius, Italy 3 Leiden Observatory, Leiden University, PO Box, 2300 RA Leiden, The Netherlands
4 SUPA, School of Physics and Astronomy, University of St. Andrews, St. Andrews KY16 9SS, UK 5 UJF-Grenoble, CNRS-INSU, Institute de Planétologie et d’Astrophysique (IPAG) UMR 5274, France 6 INAF – Osservatorio Astrofisico di Arcetri, Largo E. Fermi 5, 50125 Florence, Italy
7 UMI-FCA (UMI 3386), CNRS/INSU France and Universidad de Chile, 1058 Santiago, Chile 8 University of Vienna, Department of Astronomy, Türkenschanzstrasse 17, 1180 Vienna, Austria
Received 6 August 2013/Accepted 11 February 2014
ABSTRACT
Context.The structure of protoplanetary disks is thought to be linked to the temperature and chemistry of their dust and gas. Whether the disk is flat or flaring depends on the amount of radiation that it absorbs at a given radius and on the efficiency with which this is converted into thermal energy. The understanding of these heating and cooling processes is crucial for providing a reliable disk structure for interpreting dust continuum emission and gas line fluxes. Especially in the upper layers of the disk, where gas and dust are thermally decoupled, the infrared line emission is strictly related to the gas heating/cooling processes.
Aims.We aim to study the thermal properties of the disk in the oxygen line emission region and to investigate the relative importance of X-ray (1–120 Å) and far-UV radiation (FUV, 912–2070 Å) for the heating balance there.
Methods.We use [O
] 63µm line fluxes observed in a sample of protoplanetary disks of the Taurus/Auriga star-forming region and compare it to the model predictions presented in our previous work. The data were obtained with the PACS instrument on board the HerschelSpace Observatory as part of theHerschelopen time key program GAS in Protoplanetary diskS (GASPS).Results.Our theoretical grid of disk models can reproduce the [O
] absolute fluxes and predict a correlation between [O
] and the sumLX+LFUV. The data show no correlation between the [O
] line flux and the X-ray luminosity, the FUV luminosity or their sum. Conclusions.The data show that the FUV or X-ray radiation has no notable impact on the region where the [O
] line is formed. This contrasts with what is predicted from our models. Possible explanations are that the disks in Taurus are less flaring than the hydrostatic models predict and/or that other disk structure aspects that were left unchanged in our models are important. Disk models should include flat geometries, varying parameters such as outer radius, dust settling, and the dust-to-gas mass ratio, which might play an equally important role for the [O
] emission. To improve statistics and draw more robust conclusions on the thermal processes that dominate the atmosphere of protoplanetary disks surrounding T Tauri stars, moreLFUVandLXmeasurements are needed. High spatial and spectra resolution data is required to disentangle the fraction of [O
] flux emitted by the disk in outflow sources.Key words.protoplanetary disks
1. Introduction
Planet formation is strongly linked to the physical properties of the parent disk. Important constraints on the timescale for the gas accretion of giant planets are posed by photoevapora-tion models. The results of such models are essential in order to estimate the mass loss rates, hence the survival time of gas in disks (Alexander et al. 2006;Ercolano et al. 2008;Gorti et al. 2009). The stellar radiation, especially in the high energy regime (E>6 eV), is responsible for the thermo-chemical conditions in the disk atmosphere, since it provides most of the energy that causes the gas temperature to exceed the dust temperature there (Kamp & Dullemond 2004;Jonkheid et al. 2004;Glassgold et al. 2004). However, the thermal processes that heat and shape pro-toplanetary disks are poorly constrained and can only be in-directly measured through cooling lines. One of the dominant cooling lines that can be used to understand these processes is the 63 micron line of neutral oxygen (Gorti & Hollenbach 2008; Meijerink et al. 2008;Woitke et al. 2009;Aresu et al. 2012).
T Tauri stars emit radiation at high energies, owing both to chromospheric activity and accretion of disk material onto the stellar surface. The far-ultraviolet (FUV) luminosity between 7 and 10 eV (∆λ = 1240−1770 Å), has been measured byYang et al.(2012) for a sample of accreting sources in Taurus: they find values between 1030 and few times 1032 erg/s. The
emis-sion is in excess when compared to the stellar emisemis-sion in the same energy band for non-accreting young stars of the same spectral type. This suggests that accretion is responsible for this emission, in which case it is caused by shocks created by the magnetic field that channels disk material toward the stellar surface (Calvet & Gullbring 1998;Valenti et al. 2000). EUV (∆λ = 120−912 Å, ∆E = 13.6−100 eV) radiation is believed to mainly affect the upper disk surface at small radii, since the high cross section for absorption only allows pene-tration of small columns of NH ∼ 1019 cm−2. The XEST
sur-vey (Güdel et al. 2007) has shown that young stars are also active X-ray emitters, mainly thanks to chromospheric activ-ity, and can reach luminosities between 1029 and 1031 erg/s.
The high energy depositions (>0.01L∗) and heating efficiencies
(∼30%) of X-rays cause the tenuous disk atmosphere to heat up to temperatures of a few thousand Kelvin (Glassgold et al. 2007; Nomura et al. 2007;Gorti & Hollenbach 2008;Ercolano et al. 2008;Aresu et al. 2011).
Recent observations, carried out with the Herschel Space Observatory toward the Taurus star-forming region, offer the chance to test model predictions on the thermal structure of the region where the [O
] 63.2µm line is emitted. This line is pre-dicted to arise in the disk atmosphere in the radial region be-tween a few 10 AU and 200 AU (Woitke et al. 2009; Aresu et al. 2012). The emission region is directly exposed to the stel-lar radiation and models suggest that FUV and X-ray radiation are the main heating agents there. Polycyclic aromatic hydrocar-bon (PAH) and dust photoelectric heating, as well as Coulomb heating, cause the gas temperature to be∼200–300 K (Gorti & Hollenbach 2008;Meijerink et al. 2008,2012).In this work, we explore possible correlations of the [O
] emission with X-ray luminosity and FUV luminosity, and compare the Aresu et al. (2012) model predictions for the [O
] 63 µm emission with data collected within the GAS in Protoplanetary DiskS (GASPS, P.I. Dent) open time key pro-gram, taken with the PACS instrument on board the Herschel Space Observatory (Dent et al. 2013).In the following, we make the hypothesis that most of the [O
] emission is produced in the disk. Outflow sources, which have higher accretion rates on average, will then produce more FUV radiation and thus stronger FUV illumination of the disk surface and stronger line emission.In Sect.2we present the collected observational data set, and in Sect.3we explain the main findings of the models studied in Aresu et al. (2012). In Sect.4we show the results of the com-parison between model predictions and observations, which are discussed in Sect.5. Conclusions and remarks about future work are summarized in Sect.6.
2. Observations
In Table 1 we list the sources studied in this paper, together with the observed [O
] fluxes, and the collected X-ray and FUV luminosities with references. The Taurus star-forming region contains a rich population of pre-main sequence stars, with an age between 1–3 Myr. The sources in this sample have spectral types G, K, or M, and the majority of these are Class II objects. Below we describe the origin of each observed quantity listed in Table2.2.1. Oxygen line fluxes
The data reduction is described in Howard et al. (2013). The [O
] 63 µm line was detected in 39 out of 48 class II objects observed in Taurus, and upper limits could be measured for nine more sources. Following Howard et al. (2013) we define jet/outflow sources as those objects that have a jet imaged in Hα, [O
]λ6300 Å, and [S
]λ6371 Å or are associated with Herbig-Haro objects, and which show a high velocity molecular out-flow or a broad (>50 km s−1), typically blue-shifted, emissionline profile in [O
]λ6300 Å (see, e.g., Hartigan et al. 1995). These objects are labelled with a Y in Table 1. Podio et al. (2012) showed that for four of these sources (T Tau, DG Tau A, FS Tau and RW Aur) the oxygen emission at 63µm is spatially extended. They compared shock and disk model predictions for the fluxes of the [O
] 63µm line, and found that these are likelydominated by jet/outflow emission. Following these arguments, in order to compare the data to our disk models, we only ana-lyze [O
] fluxes from those sources in which no outflow emis-sion has been detected (29 sources). From this sample we could retrieve the X-ray luminosity for 22 sources and the FUV lu-minosity for 17 sources. BothLXandLFUVwere retrieved for9 sources (Table2).
2.2. X-ray luminosities
We collected the X-ray luminosity for 22 sources from the ob-servations carried out with theXMM-Newtonspacecraft toward the Taurus star-forming region, performed in the context of the XEST survey (P.I. Güdel). The X-ray luminosities range be-tween 1029 and 1031 erg/s, which are values and associated
er-rors taken fromGüdel et al. (2007) for all the sources, except DM Tau, GM Aur, and HN Tau. For these objects,LXwas taken
fromGüdel et al.(2010). In the last case, as suggested by the au-thors, an error of±√2LXis associated with the X-ray luminosity
value to account for intrinsic variability, which is the dominant source of error.
2.3. FUV luminosities
We could retrieve FUV luminosities for 13 sources fromYang et al.(2012) (Table 1), the associated errors for these values are∼30%. The observations were performed with the ACS cam-era and STIS spectrograph on board theHubbleSpace Telescope (HST). The FUV luminosity is obtained by integrating in the 1240–1770 Å range (7–10 eV) over the dominant line emission of C
1459 Å and Si
1394 Å, after continuum subtraction and correction for interstellar extinction using the law by Cardelli et al.(1989) (RV =3.1). The uncertainty in the AVand extinctionlaw can contribute significantly to the error in the observed line fluxes. The authors assume an error in AVof∼0.5 mag when no
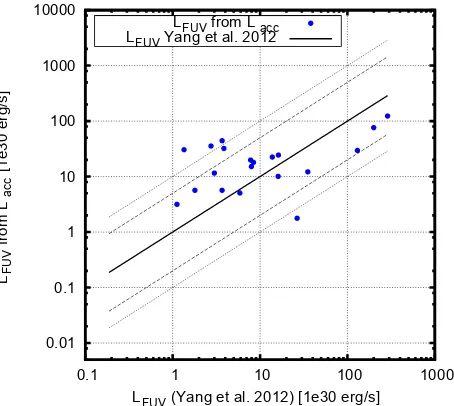
errors are available. The FUV luminosity is correlated with the accretion luminosityLacc. To extend the number ofLFUV
mea-surements, we attempted to derive FUV luminosities for those objects in our sample that are not listed inYang et al.(2012), using the correlations they provide forLaccandLFUV(in units of
solar luminosity):
log (LFUV)=−1.67+0.84 log (Lacc). (1)
The FUV luminosity obtained with this prescription accounts for chromospheric and accretion-related emission. To test this method, we used Lacc taken from Gullbring et al. (1998) and
Ingleby et al.(2009) and compared the FUV luminosity found using Eq. (1), to the one provided byYang et al.(2012) for the sources in common.
Table 1.Sources analyzed in this work and their properties: class, [O
] flux,LXandLFUV, and presence of an optical jet/outflow.Name Class [O
] 63µm [O
] 63µm LFUV LX Outflow [1e–17 W/m2] disk only [1e30 erg/s] [1e30 erg/s] [YES/NO] AATau II 2.2±0.2 0.60 28.821 1.241.361.11 Y
BPTau II 0.10±0.03 58.641 1.361.40
1.35 N
CITau II 3.3±0.5 13.321 0.190.89
0.16 N CWTau II 7.2±0.4 0.82 111.132 2.844.00
0.28 Y
CXTau T 0.7±0.3 0.681 – N
CYTau II 1.2±0.4 13.321 0.130.29
0.13 N
DETau II 0.7±0.6 30.411 – N
DFTau II 6.1±0.6 9.951 – Y
DGTau II 134.00±17.0 4.70 318.042 0.550.78
0.39 Y
DHTau II <1.35 – 8.468.64
8.23 N
DKTau II 1.6±0.3 18.582 0.920.96
0.87 N
DLTau II 2.2±0.2 13.971 – Y
DMTau T 0.7±0.2 58.281 2.002.83
1.41 N
DNTau T 0.6±0.2 6.521 1.151.17
1.14 N DOTau II 7.1±1.0 1.45 470.601 0.240.34
0.17 Y DPTau II 14.8±1.3 0.57 96.291 0.100.18
0.04 Y
DQTau II 2.1±0.4 0.822 – N
DSTau II 0.9±0.2 49.961 – N
FFTau III <1.01 – 0.801.12
0.69 N
FMTau II 1.0±0.2 4.891 0.530.56
0.51 N
FOTau T 1.20±0.5 – 0.060.52
0.05 N
FQTau II <0.92 – 0.120.83
0.05 N
FSTau-A II-FS 35.8±0.5 – 3.223.36
3.09 Y
FXTau II <1.38 – 0.502.36
0.39 N
GGTau II 5.1±0.4 10.512 – N
GHTau II <0.85 – 0.110.12
0.10 N
GI-KTau II 3.1±1.4 10.861 0.831.06
0.73 N
GMAur T 2.4±0.5 28.241 1.602.26
1.13 N
GOTau II <5.38 – 0.250.36
0.22 N
HBC358 III <1.4 – 0.380.44
0.37 N
HKTau II 3.4±0.2 – 0.080.12
0.06 N
HLTau I 51.3±0.5 – 3.844.73
3.22 Y HNTau II 4.1±0.2 0.56 21.291 0.320.45
0.23 Y
HOTau II <1.03 – 0.050.05
0.04 N
Haro6-13 II 7.0±0.5 – 0.800.91
0.14 Y
IPTau T 0.6±0.2 4.051 – N
IQTau II 1.5±0.3 – 0.421.17
0.33 N
IRAS043 II 4.9±0.2 – 0.400.50
0.37 Y
LkCa15 T 1.0±0.2 4.453 – N
RWAur II 15.4±0.5 – 1.602.26
1.13 Y RYTau T? 10.5±0.5 3.80 1042.561 5.526.38
4.82 Y SUAur II 8.6±0.3 2.51 127.421 9.469.70
8.42 Y UYAur II 31.4±0.4 2.16 27.732 0.400.57
0.28 Y
UZTau II 4.5±1.4 – 0.891.35
0.51 Y
V710Tau II 1.0±0.6 – 1.381.49
1.32 N
V773Tau II 6.5±0.3 – 9.499.54
9.39 Y
V819Tau II <0.898 – 2.442.61
2.33 N
XZTau II 36.1±0.09 – 0.961.12
0.86 Y
Table 2.Taurus sources from GASPS.LXis measured between 0.3 and 10 keV,LFUVis measured between 7 and 10 eV.
Sample [O
] detections Upper limits No outflow LX LFUV LXandLFUV48 39 9 29 22 17 9
Notes.The last three columns only refer to sources where no outflow emission was detected.
0.01 0.1 1 10 100 1000 10000
0.1 1 10 100 1000
LFUV
from L
acc
[1e30 erg/s]
LFUV (Yang et al. 2012) [1e30 erg/s]
[image:4.595.53.280.161.364.2]LFUV from Lacc LFUV Yang et al. 2012
Fig. 1.Comparison of theLFUVluminosities obtained fromLaccwith the
FUV luminosity listed inYang et al.(2012). The solid line indicates a one-to-one ratio; dashed and dotted lines enclose the region where the newLFUVare a factor 5 and 10 higher/lower thanLFUVobtained byYang
et al.(2012) with HST, respectively.
the 2.4–3.9 eV band. They also note that the accretion luminos-ity is proportional to the luminosluminos-ity in the dereddenedU-band, and provide fit parameters for this relation. This is used by Ingleby et al.(2009) to compute accretion luminosities for sev-eral other sources. The FUV emission in young stars is related to accretion, which is expected to be variable in time (∼0.5 dex in days/months,Nguyen et al. 2009). Calculating the accretion luminosity by considering a collection of photometry and spec-tral points or from the correlation with the U broad band emis-sion, very likely guarantees a good estimate of the overall flux in the FUV band, causing variability to average out.
We were able to obtainLFUVfor four sources for which [O
]has been detected, extending the sample from 13 to 17. The er-ror associated to the derived LFUV is dominated by the mean
scatter in the correlation withLacc(0.38 dex). It is important to
note that our models define the FUV luminosity in the range between 6 and 13.6 eV (92–250 nm), whileYang et al.(2012) provides integrated fluxes from 7 to∼10 eV (125–170 nm). We used a TW Hya spectrum composed of a collection of FUSE1 (900–1190 Å) and IUE2(1150–1980 Å) data to calculate the
lu-minosity ratio between the 6–13.6 eV and the 7–10 eV bands. The spectrum, shown in Fig. 2, was obtained by first defining resolution-dependent wavelength bins and then co-adding each dataset using the inverse square of the bin uncertainty as the summation weight. We found a conversion factor of 4.25 for TW Hya:
L(6FUV−13.6 eV)=4.25L(7FUV−10 eV). (2)
1 http://archive.stsci.edu/fuse/(6 data files)
2 http://sdc.cab.inta-csic.es/cgi-ines/(16 data files)
1e−16 1e−15 1e−14 1e−13 1e−12 1e−11
1000 1200 1400 1600 1800 2000
Flux (erg/cm
2/s/Å)
λ (Å) Ly α
TW Hya FUSE+IUE spectrum
Fig. 2.TW Hya spectrum obtained co-adding IUE and FUSE data. This
spectra is used to estimate the conversion factor between the flux in the 7–10 eV band and 6–13.6 eV band.
We applied this conversion factor to all the other objects, and from now on we refer toLFUVas the FUV luminosity between 6
and 13.6 eV. A very important contribution in the FUV band is given by the Lyαline emission, which can carry up to 70–90% of the total FUV flux (Schindhelm et al. 2012). However, due to res-onant scattering of neutral hydrogen and deuterium in the inter-stellar medium (ISM), the calculation of the Lyαfluxes must rely on line profile reconstruction (France et al. 2013), which is be-yond the scope of this work. Moreover,Bethell & Bergin(2011) show that Lyαis efficiently scattered through the atomic layers of protoplanetary disks by neutral hydrogen and dominates the energy budget over FUV continuum deeper in the disk, where the chemical environment is rich in molecules. In our models we find that the [O
] line is produced slightly above the H/H2tran-sition but also that the emission is insensitive to the chemical conditions. It is only sensitive to the temperature there, which is set by the interaction of the FUV continuum with PAHs and neutral carbon.
3. Models
In this work we use the results obtained inAresu et al.(2012), where we used the thermo-chemical code ProDiMo (Woitke et al. 2009;Aresu et al. 2011) to calculate the [O
] 63µm line fluxes for a grid of 240 models. The varying parameters in the grid areLX(0, 1029, 1030, 1031, and 1032erg/s),LFUV(1029, 1030,1031, and 1032erg/s), minimum dust grain sizea
min(0.1, 0.3, and
1 µm), dust size distribution power law index apow(2.5, 3.5),
and surface density distribution power law index (1.0, 1.5). The PAH abundance is 1% with respect to the ISM abundance (ISM =3×10⁻⁷) and the dust-to-gas ratio is kept fixed at 0.01
[image:4.595.320.542.162.359.2]-18 -17.5 -17 -16.5 -16 -15.5
28 29 30 31 32
OI 63
µ
m [W/m
2]
LX [erg/s]
Gasps Data Upper limits
-18 -17.5 -17 -16.5 -16 -15.5
29 30 31 32 33
OI 63
µ
m [W/m
2 ]
[image:5.595.93.503.74.266.2]LFUV [erg/s] Gasps Data
Fig. 3. Left-hand panel: flux of the [O
] 63µm emission versus the X-ray luminosity.Right-hand panel: flux of the [O
] 63µm emission versusthe FUV luminosity. Red dots identify [O
] fluxes emitted from non-outflow sources, green diamonds are upper limits.considered a turbulent Doppler value of 0.15 km s−1(Guilloteau
& Dutrey 1998;Simon et al. 2000).
As described in Aresu et al. (2012), among the parame-ters described above, the main effect on [O
] is caused by LXandLFUV. We then calculate the mean [O
] flux over each seriesof models with a given value ofLXandLFUV. One series is
com-posed of 12 models, which differ for values ofamin,apowand.
The error bars accompanying the mean flux take into account a deviation of 2σin that sub-series of 12 models. We find that the behavior of the line flux predicted from the models (also shown in Fig. 4) is not affected by the disk inclination.
We found that the [O
] line is optically thick (τline >104),hence sensitive to the gas temperature in the disk regions be-tween r ∼ 10 and 100 AU with relative heightz/rincreasing from 0.2 to 0.6 (see Fig. 2 in Aresu et al.2012). The main FUV related heating processes are photoelectric heating on PAHs, dust grains and carbon ionization heating. In all cases, these processes release a few eV into the gas phase which are con-verted into kinetic energy of the gas. X-ray heating proceeds via Coulomb heating, which releases larger amounts of energy due to the fast electrons released in the X-ray ionization process. We found that depending onLFUVandLXluminosities the
tempera-ture in the [O
] heating region, and consequently the line flux, is controlled by FUV or X-ray radiation or both.In our grid of models we consider a single star, of spectral type G (seeMeijerink et al. 2012, Table 1). The spread in spec-tral types in Taurus is restricted to objects of specspec-tral type G, K, and M, for which the effective temperatures and bolometric lu-minosities agree reasonably well with our Sun-like model. This might influence the SED properties of such systems, but it does not play a role in the gas physics and chemistry in the upper layers, since this is regulated by high energy radiation.
4. Results
We describe the results of the observations of oxygen emission in Taurus, and investigate the correlation between the oxygen fine-structure line at 63 µm and LX,LFUV, and their sum. We then
compare the data results to the model predictions described in Aresu et al.(2012), to study the thermal properties of the region where [O
] is emitted.Table 3.Probability that a correlation is not present, estimated using Spearman and Kendall coefficients for the correlation between [O
] and LX, LFUV, and LSUM (in brackets, the probabilities for a random population in the samexandyrange).Observable Kendall Spearman LX 0.77 (0.60) 0.80 (0.51) LFUV 0.84 (0.41) 0.81 (0.40)
LSUM 0.83 0.83
4.1. Observed data
In the left-hand panel of Fig. 3, we plot the [O
] fluxes ver-sus the X-ray luminosity. The X-ray luminosity range spans ∼1.5 dex, as well as the range in [O
] fluxes. Due to the pres-ence of upper limits, we performed survival analysis using the ASURV package (Feigelson & Nelson 1985;Isobe et al. 1986) to quantitatively investigate the presence of a correlation. In Table3, we summarize the results obtained showing the prob-ability that the correlation is not present using a Spearman and Kendall statistical test. This has been done for the data sample and for a random population of values in the same ranges (in brackets).In the right-hand panel of Fig. 3, we plot the [O
] fluxes versusLFUV. Also in this case there is no clear correlationbe-tween [O
] and the FUV luminosity. We found similar results concerning the correlation between [O
] and LSUM = LX +LFUV(Table3).
4.2. Modeling
In the left-hand panel of Fig.4we show the results taken from the grid of models described inMeijerink et al.(2012) andAresu et al.(2012), each colored stripe is a series of [O
] fluxes for models with a given FUV luminosity. The thickness of the stripe accounts for all the models with different dust parameters and disk surface density distributions (seeAresu et al. 2012for the details). The models agree quantitatively with the data, repro-ducing the same [O
] flux range from low to high FUV lumi-nosity along the 2 dex interval in LX. The models do not-19 -18 -17 -16 -15 -14
UV 29 30 31 32
Log Flux [OI] 63
µ
m [erg/s]
Log LX [erg/s]
[OI] 63 mic
LFUV = 1e29 erg/s LFUV = 1e30 erg/s LFUV = 1e31 erg/s LFUV = 1e32 erg/s No Outflow
Upper Limits -19
-18 -17 -16 -15 -14
UV 29 30 31 32
Log Flux [OI] 63
µ
m [erg/s]
Log LX [erg/s]
Log L
FUV
[erg/s]
LFUV = 1e29 erg/s LFUV = 1e30 erg/s LFUV = 1e31 erg/s LFUV = 1e32 erg/s Gasps Data
[image:6.595.94.504.76.250.2]29 29.5 30 30.5 31 31.5 32
Fig. 4.Models and observations. FUV luminosity ranges from 1029(red stripe) to 1032erg/s (blue stripe). When stripes overlap, the stripe
repre-senting a higher luminosity is shown. In theright-hand panelthe data points are color-coded for the FUV luminosity of a given object, following the color scale presented in the side bar.
-19 -18 -17 -16 -15 -14
29 30 31 32 33
Log Flux [OI] 63
µ
m [erg/s]
Log LFUV [erg/s] No X-rays LX = 1e29 erg/s LX = 1e30 erg/s LX = 1e31 erg/s LX = 1e32 erg/s
No Outflow -19
-18 -17 -16 -15 -14
29 30 31 32 33
Log Flux [OI] 63
µ
m [erg/s]
Log LFUV [erg/s]
LX
No X-rays
LX = 1e29 erg/s
LX = 1e30 erg/s
LX = 1e31 erg/s
LX = 1e32 erg/s
Gasps Data
[image:6.595.99.499.302.477.2]29 29.2 29.4 29.6 29.8 30 30.2 30.4
Fig. 5.Flux of the [O
] 63µm line versusLFUV. The colored stripes represent predicted values for differentLX.behavior: for LX>1030 erg/s and LX > LFUV, [O
] emissionshould be dominated by X-rays.
The models also suggest that at a given X-ray luminosity, the [O
] line flux scales withLFUV. To test this on a qualitativebasis, in the right-hand panel of Fig. 4, we plot the [O
] ob-served line fluxes versus the X-ray luminosity, color-coding for the observed FUV luminosity. The predicted [O
] fluxes from the models seem to overestimate (factor∼5) the observations at a givenLFUV. This can be also seen in Fig.5, where the predicted[O
] is on average higher than the data. In this plot the stripes are color-coded for differentLX. These findings depend strongly onhow the FUV luminosity is scaled from the 7–10 eV band to the 6–13.6 band. We use the same stellar template (TW Hya) to esti-mate the variation in the flux in the full FUV range. However this might not be applicable to each object. Moreover, we do not con-sider the Lyαflux in our models, which might cause an overesti-mate of the continuum flux in the FUV band, which could cause extra FUV heating in the [O
] emission region, hence overesti-mating its line flux.Figure 2 in Aresu et al. (2012, right-hand panel) shows that the energy deposition rates associated with LX and LFUV are
comparable. We therefore explored a correlation between [O
] and the simple sum of these luminosities. We fit the data using a linear function. Figure6shows the data and the fit to the model-20 -19 -18 -17 -16 -15 -14
29 30 31 32 33
Log Flux [OI] 63
µ
m [erg/s]
Log (LX + LFUV) [erg/s]
Models Gasps Data Models slope: 0.62 +/- 0.05
Fig. 6.[O
] flux versusLX+LFUV. Model points are black, while datapoints are red. In our models we considered a sun-like star surrounded by a disk of 0.02Mwhich extends from 0.5 to 500 AU.
points. Given that all the sources in the observed sample haveLX
between 1029and 1031erg/s, we did not include the [O
] flux for those models that haveLX =0 or 1032 erg/s, obtaining a slope [image:6.595.340.523.509.687.2]5. Discussion
We discuss here the results presented in the previous section, analyzing the capability of the models in interpreting the data and suggest improvements to be made.
5.1. FUV luminosity
Our LFUVestimates rely on calculating the scale factor that we
adopted to get the luminosity in the 6–13.6 band (needed to compare the data to our models) out of the 7–10 eV band used byYang et al.(2012). These values can be further improved for two reasons: (1) we calculated the conversion factor for TW Hya alone, and used it for the whole sample; (2) the Ly-αprofile in the TW Hya spectrum should be reconstructed to account for neutral hydrogen absorption in the ISM. Nevertheless, the slope in Fig.6weakly depends on this reconstruction. A change of a factor 2 in the conversion factor would cause a∼20% change in the slope.
5.2. Possible correlations
Assuming that the measured [O
] fluxes are mainly emitted from the disk, we find that both the models and the data suggest that there is no correlation between [O
] 63µm andLXorLFUVinthe range of luminosities spanned by our sample. According to our models this is caused by the FUV-related heating processes affecting the line at a given X-ray luminosity, causing a vertical scatter (∼2 dex) comparable to the range of X-ray luminosities observed in T Tauri stars. The same conclusions can be drawn when [O
] is plotted againstLFUV, where the vertical scatter isnow to ascribe to Coulomb heating.
This amount of scatter is partially seen in the data (∼1 dex), and no correlation between [O
] and LFUV emerges. All thesources investigated here haveLFUV>LX, and 90% of them have
LFUV>10×LX. Disk models would predict higher [O
]emis-sion (factor∼10) forLFUV>1031 erg/s, but the data shows that
higher [O
] fluxes are achieved only when outflows are present. With the aim of extending our data sample, we also in-cluded outflow sources and proceeded to estimate the [O
] disk emission as follows.Howard et al.(2013) find a correlation be-tween [O
] and the continuum at 63µm for non-outflow sources. Outflow sources stand clearly above this correlation (see their Fig. 6). Using the fit formula that they provided, we estimated the disk emission for outflow sources by subtracting the amount of excess flux with respect to the fit from the total [O
] emis-sion (Table1, fourth column). In this way we enlarge our sam-ple (though only through estimated disk emission) and attempt to check for the absence of a clear correlation with LFUV andLX. In fact, even for the enhanced sample, we find no correlation
with either one of these quantities or with their sum.
5.3. Heating mechanism
Since the PACS data is spatially and spectrally unresolved, the location of the [O
] 63 µm emission is unclear. If most of the emission for non-outflow sources originates in the disk, bothLXandLFUVare important heating agents in the [O
] emittingre-gion, but their direct influence on the [O
] emission remains elu-sive. InAresu et al.(2012), we suggested a threshold mechanism for [O
] with respect toLX. This cannot be tested with ourcur-rent data set, as there are no sources that haveLXhigher than a
few times 1030erg/s.
5.4. Impact of other parameters
Spitzerobservations toward 38 T Tauri stars performed byGeers et al.(2006), detected PAH features in only 8% of the objects. Models of PAH chemistry in disks surrounding T Tauri stars sug-gest that these species do exist, but the UV luminosity of the cen-tral star is just too weak to reveal their presence. PAH emission is indeed believed to be a factor 10 weaker in T Tauri stars than in Herbig Ae/Be stars, where the UV luminosity is orders of mag-nitude higher. The authors also suggest that the PAH abundance in T Tauri stars is a factor 10 or 100 lower than the one inferred for the ISM.
In our grid we used a PAH abundance 0.012 times lower than the PAH abundance in the ISM. Nevertheless, we found PAH heating to be the main FUV-driven heating process in the [O
] emission region. The second most efficient heating pro-cesses are C+heating and photoelectric heating on dust grains. The sum of these heating processes is less than a factor two lower than PAH heating, and it follows the same behavior with respect toLFUV. An even lower PAH abundance would just causea lower temperature in the [O
] emission region, thus weakening the line emission, but not affecting the nature of the correlation we predict.On the other hand, we considered in our models only a lim-ited set of free parameters (LX,LFUV, minimum dust size, dust
size distribution power law, and the surface-density distribution power law). However, the [O
] flux can be affected by other quantities, such as the flaring indexβ, dust settling, gas-to-dust mass ratio, and outer radius (Woitke et al. 2010;Kamp et al. 2011). In the disk models used in this work, the flaring angle is a result of the hydrostatic equilibrium (Meijerink et al. 2012), and the solutions we find for the scale height generally point toward maximum flared disks (β∼1.25). This may not be representa-tive of the disks in our sample especially when dust settling takes place, leading to flatter geometries, for whichβ≤1 (Dullemond & Dominik 2005). Flat disks absorb less radiation, thereby di-minishing the importance its importance, hence its impact on the gas emission.Dust settling should also affect the dust-to-gas mass ratio, which is usually kept fixed to the ISM value (δ=0.01) at each point in the disk. Variations in the latter would change the opac-ity throughout the disk causing different properties in the energy deposition distribution of the FUV radiation.
In our models we keep the disk’s outer radius fixed at 500 AU to allow proper comparison with previous works. However disks surrounding T Tauri stars do range in size from 50 AU to hun-dreds of AU (Williams & Cieza 2011); for example because of the reduced emitting area, smaller disks illuminated by high FUV luminosities do not necessarily yield higher [O
] fluxes when compared to bigger disks illuminated by lowerLFUV.The disk mass also affects the [O
] emission. In Taurus the spread in disk masses is estimated to be∼2 dex: MD/M ∼10−1.5−10−3.5 (Andrews et al. 2013). This spread could cause
∼1 dex scatter in the [O
] emission (Woitke et al. 2011), hence affecting the correlations studied in this work.6. Conclusions and outlook
Herschel. The observations show no correlation between the [O
] 63µm line emission and the X-ray luminosity, the FUV lu-minosity, or their sum.Our thermo-chemical disk models calculated with ProDiMo show that our predictions on the [O
] fluxes qualitatively agree with the observations. There is no correlation between [O
] and LXorLFUV, as the data suggest. Nevertheless, the models predicta correlation between [O
] and the sumLX+LFUV, but it is notseen in the data. The reason can be the limited set of parame-ters varied in our model (LX,LFUV, grain minimum size, power
law of the grain size distribution, and power law of the surface density distribution) grid to understand the relative importance ofLXandLFUV.
However, other parameters can affect the [O
] line, causing the correlation we predict to vanish when a more complete grid is used.To include all the disk parameters that influence the [O
] line, a different set of models should be used. Flatter disk geometries should be included, as well as a proper treatment of X-ray and FUV physics and dust settling (local variations in the gas-to-dust mass ratio).Moreover, these models should be compared to a higher number of observations: high spatial and spectral resolution data is required to disentangle the location of the emission region of the line. In many sources that drive outflows, the contribution of the disk to the total flux of the line remains unclear.
More measurements ofLFUVwould also be necessary. To test
the threshold mechanisms proposed in our previous work, obser-vations of [O
] of sources withLX>LFUV, if any, are essential.The understanding of the [OI] dependence on the FUV and X-ray radiation makes it possible to investigate the gas surface layers above the H/H2 transition. Such studies are very interest-ing for understandinterest-ing the photoevaporation mechanism and how it may drive disk evolution across the transition from one opti-cally thick to a debris disk.
Acknowledgements. We thank Aki Roberge for her comments on the FUV
anal-ysis, which helped to improve the paper, and Glenn White for thoroughly read-ing the paper. W.F.T., P.W., F.M., M.G., and I.K. acknowledge fundread-ing from the EU FP7-2011 under Grant Agreement Nr. 284405. L.P. acknowledges funding from the FP7 Intra-European Marie Curie Fellowship (PIEF-GA-2009-253896).
References
Alexander, R. D., Clarke, C. J., & Pringle, J. E. 2006, MNRAS, 369, 216 Andrews, S. M., & Williams, J. P. 2005, ApJ, 631, 1134
Andrews, S. M., Rosenfeld, K. A., Kraus, A. L., & Wilner, D. J. 2013, ApJ, 771, 129
Aresu, G., Kamp, I., Meijerink, R., et al. 2011, A&A, 526, A163 Aresu, G., Meijerink, R., Kamp, I., et al. 2012, A&A, 547, A69 Bethell, T. J., & Bergin, E. A. 2011, ApJ, 739, 78
Calvet, N., & Gullbring, E. 1998, ApJ, 509, 802
Cardelli, J. A., Clayton, G. C., & Mathis, J. S. 1989, ApJ, 345, 245 Dent, W. R. F., Thi, W. F., Kamp, I., et al. 2013, PASP, 125, 477 Dullemond, C. P., & Dominik, C. 2005, A&A, 434, 971
Ercolano, B., Drake, J. J., Raymond, J. C., & Clarke, C. C. 2008, ApJ, 688, 398
Feigelson, E. D., & Nelson, P. I. 1985, ApJ, 293, 192
France, K., Froning, C. S., Linsky, J. L., et al. 2013, ApJ, 763, 149
Geers, V. C., Augereau, J.-C., Pontoppidan, K. M., et al. 2006, A&A, 459, 545
Glassgold, A. E., Najita, J., & Igea, J. 2004, ApJ, 615, 972 Glassgold, A. E., Najita, J. R., & Igea, J. 2007, ApJ, 656, 515 Gorti, U., & Hollenbach, D. 2008, ApJ, 683, 287
Gorti, U., Dullemond, C. P., & Hollenbach, D. 2009, ApJ, 705, 1237 Güdel, M., Briggs, K. R., Arzner, K., et al. 2007, A&A, 468, 353 Güdel, M., Lahuis, F., Briggs, K. R., et al. 2010, A&A, 519, A113 Guilloteau, S., & Dutrey, A. 1998, A&A, 339, 467
Gullbring, E., Hartmann, L., Briceno, C., & Calvet, N. 1998, ApJ, 492, 323 Hartigan, P., Edwards, S., & Ghandour, L. 1995, ApJ, 452, 736
Howard, C. D., Sandell, G., Vacca, W. D., et al. 2013, ApJ, 776, 21 Ingleby, L., Calvet, N., Bergin, E., et al. 2009, ApJ, 703, L137 Isobe, T., Feigelson, E. D., & Nelson, P. I. 1986, ApJ, 306, 490
Jonkheid, B., Faas, F. G. A., van Zadelhoff, G.-J., & van Dishoeck, E. F. 2004, A&A, 428, 511
Kamp, I., & Dullemond, C. P. 2004, ApJ, 615, 991 Kamp, I., Woitke, P., Pinte, C., et al. 2011, A&A, 532, A85 Meijerink, R., Glassgold, A. E., & Najita, J. R. 2008, ApJ, 676, 518 Meijerink, R., Aresu, G., Kamp, I., et al. 2012, A&A, 547, A68
Nguyen, D. C., Scholz, A., van Kerkwijk, M. H., Jayawardhana, R., & Brandeker, A. 2009, ApJ, 694, L153
Nomura, H., Aikawa, Y., Tsujimoto, M., Nakagawa, Y., & Millar, T. J. 2007, ApJ, 661, 334
Podio, L., Kamp, I., Flower, D., et al. 2012, A&A, 545, A44 Schindhelm, E., France, K., Herczeg, G. J., et al. 2012, ApJ, 756, L23 Simon, M., Dutrey, A., & Guilloteau, S. 2000, ApJ, 545, 1034 Valenti, J. A., Johns-Krull, C. M., & Linsky, J. L. 2000, ApJs, 129, 399 Williams, J. P., & Cieza, L. A. 2011, ARA&A, 49, 67
![Table 1. Sources analyzed in this work and their properties: class, [O�] flux, LX and LFUV, and presence of an optical jet/outflow.](https://thumb-us.123doks.com/thumbv2/123dok_us/8740616.388142/3.595.118.472.100.693/table-sources-analyzed-properties-class-presence-optical-outow.webp)
![Fig. 3. Left-hand panelthe FUV luminosity. Red dots identify [O: flux of the [O�] 63 µm emission versus the X-ray luminosity](https://thumb-us.123doks.com/thumbv2/123dok_us/8740616.388142/5.595.93.503.74.266/left-panelthe-luminosity-identify-ux-emission-versus-luminosity.webp)
![Fig. 5. Flux of the [O�] 63 µm line versus LFUV. The colored stripes represent predicted values for different LX.](https://thumb-us.123doks.com/thumbv2/123dok_us/8740616.388142/6.595.340.523.509.687/flux-versus-colored-stripes-represent-predicted-values-dierent.webp)
