Handheld probe for quantitative
micro-elastography
Q
IF
ANG,
1,2,*B
ROOKEK
RAJANCICH,
1,2,3L
IXINC
HIN,
1,2R
ENATEZ
ILKENS,
1,4A
NDREAC
URATOLO,
1,2,5L
UKEF
REWER,
1,2J
AMESD. A
NSTIE,
1,2P
HILIPW
IJESINGHE,
1,2,6C
OLINH
ALL,
7B
ENJAMINF. D
ESSAUVAGIE,
8,9B
RUCEL
ATHAM,
8C
HRISTOBELM. S
AUNDERS,
4,10,11 ANDB
RENDANF. K
ENNEDY1,21BRITElab, Harry Perkins Institute of Medical Research, QEII Medical Centre, Nedlands and Centre for Medical Research, The University of Western Australia, Perth, Western Australia, 6009, Australia 2Department of Electrical, Electronic & Computer Engineering, School of Engineering, The University of Western Australia, 35 Stirling Highway, Perth, Western Australia, 6009, Australia
3Currently with Department of Electrical Engineering, Stanford University, Stanford 94305, USA 4Division of Surgery, Medical School, The University of Western Australia, 35 Stirling Highway, Perth, Western Australia, 6009, Australia
5Currently with Visual Optics and Biophotonics Group, Instituto de Óptica “Daza de Valdés”, Consejo Superior de Investigaciones Cientificas (IO, CSIC), C/Serrano, 121, Madrid 28006, Spain
6Currently with SUPA, School of Physics and Astronomy, University of St Andrews, North Haugh, St Andrews, KY16 9SS, UK
7Future Industries Institute, University of South Australia, Mawson Lakes, South Australia, 5095, Australia
8PathWest, Fiona Stanley Hospital, 11 Robin Warren Drive, Murdoch, Western Australia, 6150, Australia
9Division of Pathology and Laboratory Medicine, Medical School, The University of Western Australia, 35 Stirling Highway, Perth, Western Australia, 6009, Australia
10Breast Centre, Fiona Stanley Hospital, 11 Robin Warren Drive, Murdoch, Western Australia, 6150, Australia
11Breast Clinic, Royal Perth Hospital, 197 Wellington Street, Perth, Western Australia, 6000, Australia
Abstract: Optical coherence elastography (OCE) has been proposed for a range of clinical applications. However, the majority of these studies have been performed using bulky, lab-based imaging systems. A compact, handheld imaging probe would accelerate clinical translation, however, to date, this had been inhibited by the slow scan rates of compact devices and the motion artifact induced by the user’s hand. In this paper, we present a proof-of-concept, handheld quantitative micro-elastography (QME) probe capable of scanning a 6 × 6 × 1 mm volume of tissue in 3.4 seconds. This handheld probe is enabled by a novel QME acquisition protocol that incorporates a custom bidirectional scan pattern driving a microelectromechanical system (MEMS) scanner, synchronized with the sample deformation induced by an annular PZT actuator. The custom scan pattern reduces the total acquisition time and the time difference between B-scans used to generate displacement maps, minimizing the impact of motion artifact. We test the feasibility of the handheld QME probe on a tissue-mimicking silicone phantom, demonstrating comparable image quality to a bench-mounted setup. In addition, we present the first handheld QME scans performed on human breast tissue specimens. For each specimen, quantitative micro-elastograms are co-registered with, and validated by, histology, demonstrating the ability to distinguish stiff cancerous tissue from surrounding soft benign tissue.
© 2019 Optical Society of America under the terms of the OSA Open Access Publishing Agreement
1. Introduction
Using elastography to image the mechanical properties of tissue has the potential to aid in disease diagnosis and tissue characterization in a number of clinical applications [1–3]. Optical coherence elastography (OCE) [4,5] is an emerging high-resolution variant of elastography that utilizes optical coherence tomography (OCT) [6] to measure the deformation of biological tissue in response to a mechanical load. As such, OCE is capable of generating a two-dimensional (2-D) or three-dimensional (3-D) map of the mechanical properties of tissue on the micro-scale. A range of OCE techniques have been developed, often classified based on the loading mechanism, e.g., compression and shear wave [3,4,7]. Owing largely to the benefit of high resolution, rapid acquisition and the ability to generate 3-D elastograms, the potential of OCE has been examined for a range of applications, e.g., in ophthalmology [8,9] and oncology [10,11].
To date, clinical feasibility studies in OCE have largely been performed using bulky, lab-based, bench-top setups [11,12], unsuitable for use in many clinical settings. In one preliminary study, OCE on skin was demonstrated in a quasi-handheld format where supporting apparatus was required to stabilize the probe [13]. However, a fully handheld probe would greatly facilitate the continued clinical development of OCE. More specifically, it would be of great benefit to intraoperative imaging in breast-conserving surgery, which has the potential to reduce the rate of involved margins found postoperatively [14–16] and, therefore, to reduce the number of patients requiring re-excision surgery (~20-30%) [17,18]. Currently, there is no effective method to accurately and rapidly assess tumor on the micro-scale where it is often missed [19–22].
In previous work, our group has demonstrated that quantitative micro-elastography (QME), a compression-based, phase-sensitive OCE technique, has the potential to identify tumor based on its elasticity [12,23]. This work has shown that a bench-mounted QME system is capable of delineating involved margins by investigating freshly excised breast tissues [12]. A handheld probe would potentially enable a direct and rapid assessment of surgical margins in vivo, and to scan the surgical cavity for residual tumor.
In this paper, we present the first demonstration of a compact, support-free, handheld QME probe on human breast tissue specimens. The probe utilizes a microelectromechanical system (MEMS) mirror to scan the beam across the sample surface. The small footprint of the MEMS module (8 × 8 × 3 mm), incorporated with a small scanning mirror (3 mm in diameter), facilitates a far more compact handheld probe than is achievable using the galvanometer-based scanners used previously in QME [12,13,23]. In addition, our QME probe incorporates a custom annular lead zirconate titanate (PZT) actuator, providing uniform, periodic mechanical loading to the tissue, combined with a two-section compliant silicone layer, to estimate the stress at the tissue surface.
time difference between B-scans, the more likely it is that the relative motion between the probe and tissue will cause the phase difference between consecutive B-scans to become either decorrelated (too much displacement between two consecutive B-scans) or to fall below the noise floor of the system (the relative motion is in the opposite direction to the PZT actuation, with similar amplitude).
In this paper, to minimize the impact of motion artifact in handheld QME, we demonstrate a custom bidirectional scan pattern, capable of scanning a 6 × 6 × 1 mm volume of tissue in 3.4 seconds. Recently, a bidirectional triangular scan pattern using galvanometer-based scanners has been developed in OCT angiography [27]. In our method, we use the MEMS mirror with a similar bidirectional scan pattern which comprises two regions: a linear scan region where B-scans are acquired, and a sinusoidal turn-around region where the scanning direction of the beam is reversed whilst avoiding the resonant behavior of the MEMS mirror. A B-scan rate of 215 Hz can be achieved with this custom scan pattern, 9 times faster than a standard scan pattern similar to that provided by the probe manufacturer. The feasibility of the handheld QME probe is tested on a tissue-mimicking silicone phantom, demonstrating comparable imaging performance to bench-mounted QME. The utility of the handheld probe is further demonstrated on human breast tissue freshly dissected from three mastectomy specimens. Micro-elastograms acquired with the handheld QME probe demonstrate high mechanical contrast between cancerous tissue and surrounding benign tissue, additional to the optical contrast provided by OCT images. In each case, micro-elastograms and OCT images are co-registered with and validated by corresponding gold-standard histology. Our results demonstrate the potential of handheld QME to eventually provide intraoperative discrimination between cancerous and benign tissue during breast-conserving surgery.
2. Method
2.1 Quantitative micro-elastography
2.2 Experimental setup
The handheld QME probe comprises two main parts: the OCT probe and the mechanical loading apparatus. The OCT probe (Thorlabs, OCTH-1300) uses a commercially available OCT system (Thorlabs, Telesto III) with a central wavelength of 1300 nm and a bandwidth of ~200 nm, corresponding to a measured axial resolution of 5.5 µm in air, and an objective lens (Thorlabs, OCTH LK-30) that provides a measured lateral resolution of 14.4 μm, corresponding to the full-width-at-half-maximum (FWHM) of the beam intensity at focus. The maximum A-scan rate is 146 kHz, corresponding to a minimum A-line period of 6.8 µs. In this paper, the A-line period for all the OCT data acquired was 7 µs. A MEMS scanning mirror is incorporated in the handheld probe to scan the beam across the surface of the sample. The MEMS mirror has a first harmonic at 625 Hz, with an electronic low-pass-filter (cut-off frequency 385 Hz), installed by the probe manufacturer to avoid resonant excitation of mechanical modes, which could damage the mirror. In addition, the probe incorporates a polychromatic CMOS camera capable of acquiring photographs of the tissue surface during the scan.
The mechanical loading apparatus comprises the annular PZT actuator (Piezomechanik, inner/outer diameters 14 mm/20 mm, length 14 mm) and the attached imaging window, enabling compression and imaging from the same side of the sample. The PZT actuator was fixed in a stainless steel case, which in turn was threaded onto the OCT probe, to provide a maximum stroke of 9.5 μm. The imaging window (Edmund Optics, Fused Silica Window #45-464) was customized with a multi-layer Ti2O3/SiO2 coating deposited on the distal
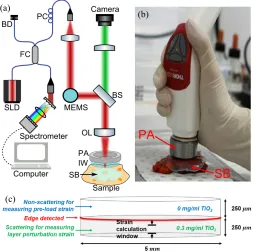
surface from the actuator, using a Satis 725 electron beam evaporation system with ion gun assistance, providing ~30% intensity reflection at 1300 nm wavelength. The interferometer is implemented in a common-path configuration, where the light reflected directly from the coated surface of the imaging window acts as the reference reflection. The coating was selected to ensure an optimal reference power to maximize OCT sensitivity, which was measured to be 95 dB for this common-path configuration. In the handheld QME scans, the probe was held freely by the user, with the elbow resting on the bench. A schematic of the experimental setup is shown in Fig. 1(a) and a photograph of the handheld QME probe in Fig. 1(b).
In our previous demonstrations of QME, e.g. in [12,23], a homogeneous transparent silicone layer was used as the stress sensor. Due to the unevenness of the tissue surface, this homogeneous layer can suffer from poor contact to the tissue, which degrades the accuracy of the edge detection used to estimate layer thickness. In addition, large perturbation strain in the layer can induce phase wrapping at the layer surface, which is not detectable using the transparent layer. As such, we developed a compliant silicone bi-layer, which comprises two sub-layers fused together, each manufactured using a compound silicone material (Wacker P7676 A and B at 1:1 mixing ratio) with a thickness of ~250 µm, as illustrated in the schematic in Fig. 1(c). TiO2 scattering particles (Sigma Aldrich, product 232033, average
Fig. 1. Handheld QME probe. (a) Schematic of the experimental setup. SLD, superluminescent diode. FC, fiber coupler. PC, polarization coupler. BD, beam damper. MEMS, microelectromechanical system. BS, beam splitter. OL, objective lens. PA, PZT actuator. IW, imaging window. SB, silicone bi-layer. (b) Photograph of a handheld scan on excised breast tissue. (c) Schematic of the bi-layer used to map the surface stress on the sample.
2.3 Scan patterns
In this section, we describe and compare the two scan patterns used to drive the MEMS mirror in the handheld probe: the standard unidirectional scan pattern and the custom bidirectional scan pattern.
2.3.1 Standard scan pattern
2.3.2 Custom scan pattern
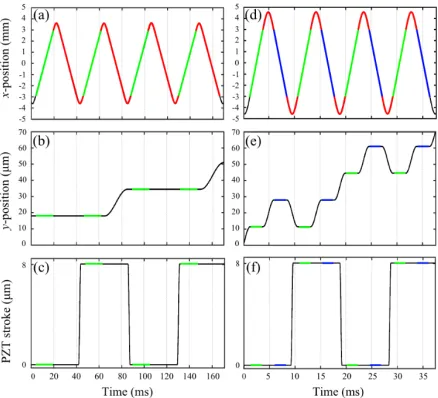
To reduce imaging artifacts caused by hand motion, we developed a custom scan pattern that allows us to reach a B-scan rate of 215 Hz. We achieved this by implementing bidirectional scanning, as illustrated in Fig. 2(d), acquiring B-scans in both the positive (shown in green) and negative (shown in blue) x-directions. To avoid exciting complex frequency components of the MEMS mirror, between B-scans the scanning direction is reversed using a sinusoidal component at 238 Hz, taking ~2.1 ms, indicated in red in Fig. 2(d). In total, there are 364 A-scans in a B-scan, taking ~2.5 ms, with a scan range of 6 mm, resulting in a spatial sampling of 16.5 µm in the x-direction. In postprocessing, B-scans acquired from the negative
x-direction are flipped in the x-axis to match with the orientation of the B-scans acquired from the positive x-direction. Due to the slightly non-uniform gain of the low-pass-filter in the MEMS module at 238 Hz and the fact that the mirror moves in opposite direction when the line camera in the spectrometer triggers, small asymmetry causes each A-scan location to be slightly shifted between positive and negative B-scans, resulting in phase decorrelation at almost every pixel location. Thus, the phase difference between positive and negative B-scans is not usable for measuring elasticity. Instead, two consecutive B-scans, i.e., in opposite
[image:6.612.196.415.394.593.2]x-directions, are acquired at neighboring y-locations and alternating B-scans, i.e., in the same x -direction, are used to calculate the phase difference for each y-location, as marked by the green and blue lines in Fig. 2(e). Data is acquired at 364 locations in the y-direction, for a spatial sampling of 16.5 µm. The time difference between two B-scans used for phase difference calculation is 9.3 ms, more than a 4-fold improvement compared to the standard scan pattern. The PZT actuation is synchronized with B-scans such that two 2-D phase difference maps are generated within one cycle of the PZT, as indicated by the green and blue lines in Fig. 2(f). The total acquisition time in this scan pattern is 3.4 seconds to scan a sample volume of 6 × 6 × 1 mm, 9 times faster than that in the standard scan pattern.
Fig. 2. Standard unidirectional and custom bidirectional scan patterns. (a), (b) and (c) represent the x-position, y-position and PZT stroke in the standard scan pattern. The green lines and red curves indicate the B-scans and the fly-back regions, respectively. (d), (e) and (f) represent the
2.4 Elasticity sensitivity
To quantify the performance of the two QME scan patterns, in this section, we introduce a method to measure elasticity sensitivity, which is defined as the smallest variation that can be measured in quantitative micro-elastograms. We use this to compare results acquired in three imaging configurations:
1. When the probe is mounted in a bench-top setup and scans are acquired with the custom scan pattern;
2. When the probe is used free-hand and scans are acquired with the standard scan pattern;
3. When the probe is used free-hand and scans are acquired with the custom scan pattern.
To measure elasticity sensitivity, we fabricated a 10-mm thick homogeneous silicone phantom (Wacker P7676 A and B at 1:1 mixing ratio) mixed with the TiO2 scattering
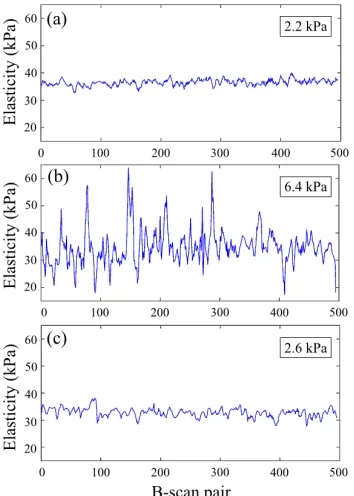
particles in a concentration of 1 mg/ml. A silicone bi-layer, described in Section 2.2, was placed on top of the phantom. The layer and sample were pre-loaded by ~20-30% prior to the scan. For each of the three configurations, 500 B-scan pairs were acquired at the same
Fig. 3. Elasticity measurements performed on a homogeneous silicone phantom, using (a) the mounted setup with the custom scan pattern, (b) the handheld setup with the standard scan pattern and (c) the handheld setup with the custom scan pattern. The measured elasticity sensitivities are displayed in the insets of (a), (b) and (c).
2.5 Tissue-mimicking phantoms and breast tissue specimens
We demonstrated the handheld QME probe on a tissue-mimicking silicone phantom and freshly dissected breast tissue from mastectomy specimens. The silicone phantom comprises two parts: a soft bulk material (Wacker P7676 A and B at 1:1 mixing ratio) and a stiff inclusion (Wacker RT601 A and B and silicone oil AK 50 at 10:1:10 mixing ratio). The tangent moduli of the bulk material and the inclusion were measured to be 30.7 ± 1.9 kPa and 225.6 ± 11.2 kPa, respectively, at 20% absolute strain, using a custom uniaxial compression device. To increase the OCT intensity achieved using the phantom, TiO2 scattering particles
were added to both the bulk material (1 mg/ml) and the inclusion (3 mg/ml). In addition, three breast mastectomy specimens were scanned using this probe. A tissue sample with a size of ~24 × 36 × 5 mm was dissected from each mastectomy specimen and was scanned within one hour of excision. Four locations were scanned with the handheld QME probe on each tissue sample. The silicone bi-layer was disposed of after imaging each sample. Following the scans, each tissue sample was cut in half and placed in two cassettes to enable preparation for histology. The histology was acquired ~1 week after the scan. Specimens were obtained from patients undergoing surgery at Fiona Stanley Hospital, Western Australia (Project No: FSH-2015-032). Informed consent was obtained from patients, and the ethics for this research project was approved by the Sir Charles Gairdner and Osborne Park Health Care Group Human Research Ethics Committee, Western Australia (HREC No: 2007-152).
2.6 Signal processing
in Matlab R2016a. The total processing time from raw OCT data to 3-D micro-elastograms for a sample volume of 6 × 6 × 1 mm is ~20 minutes, using a system with two Intel Xeon E5-2690 8-core CPUs, 192 GB of RAM, and a 1 TB solid-state drive.
3. Results
3.1 Handheld QME on the inclusion phantom
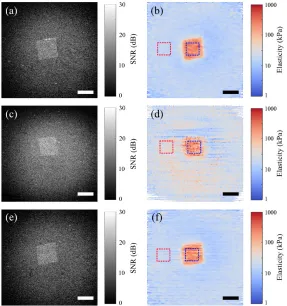
Fig. 4. En face OCT images and micro-elastograms acquired using, (a), (b) the mounted setup with the custom scan pattern, (c), (d) the handheld setup with the standard scan pattern, and (e), (f) the handheld setup with the custom scan pattern. The areas in red and blue dashed frames in (b), (d) and (f) are the selected to calculate the mean elasticity values and the standard deviations for the bulk material and the inclusion, respectively. Scale bars = 1 mm.
Table 1. Measurement of the mean elasticity values and standard deviations
Mounted setup
(kPa)
Standard scan pattern (kPa)
Custom scan pattern (kPa)
Compression test (kPa)
Bulk material 17.8 ± 2.4 40.5 ± 20.5 18.7 ± 3.6 30.7 ± 1.9 Inclusion 233.9 ± 71.9 180.4 ± 119.6 223.3 ± 89.0 225.6 ± 11.2
3.2 Handheld QME on breast tissue specimens
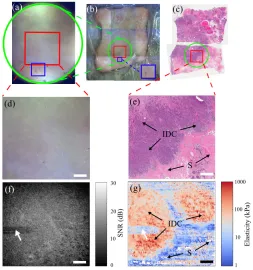
[image:10.612.113.498.476.516.2]the features between Figs. 5(a) and 5(b), the QME scan location can be identified on the large-scale photograph of the tissue sample, as highlighted by the red square frame in Fig. 5(b). The green circle in Fig. 5(b) corresponds to the FOV of the handheld photograph. Following QME acquisition, histology slides of the sample were prepared in the same plane as the en face OCT and QME images. Figure 5(c) displays the histology image at a depth of ~100 µm from the tissue surface. The wide-field photograph was compared with the histology image to co-register the QME scan area, as indicated by the red square frame in Fig. 5(c). The green circle in Fig. 5(c) corresponds to the camera FOV of the handheld probe. Figures 5(d) and 5(e) are the zoomed-in image of the area framed by the red square in Figs. 5(a) and 5(c), respectively. Invasive ductal carcinoma (IDC) and clear boundaries between tumor and benign tissue can be observed in Fig. 5(e), whilst the photograph (Fig. 5(d)) displays neither clear features of tumor nor the tumor-stroma boundaries. Figures 5(f) and 5(g) present the en face OCT image and micro-elastogram, respectively, of the scanned area, at a depth of 120 µm from the tissue surface. Figure 5(f) displays low contrast between tumor and stroma. On the contrary, the micro-elastogram, Fig. 5(g), displays high mechanical contrast between the stiff and soft area, corresponding to the tumor and stroma, respectively. The horizontal stripes at the left side of Figs. 5(f) and 5(g), as indicated by a white arrow in each figure, were caused by poor surface contact between the tissue sample and the silicone bi-layer. This artifact can be reduced by increasing the pre-load to allow the tissue to fully contact with the silicone bi-layer.
We utilized the handheld probe to scan the other two mastectomy specimens and applied the same co-registration method to match the en face OCT images and micro-elastograms with the histology images. Figure 6 presents results acquired from a specimen containing both invasive mucinous carcinoma (IMC), a relatively rare breast cancer type, accounting for 1-7% of all invasive breast carcinomas [32], and also, ductal carcinoma in situ (DCIS). Figures 6(a) and 6(b) are, respectively, photographs of the tissue surface acquired with the probe and the corresponding histology image of the scanned area, ~100 µm from the tissue surface. Figures 6(c) and 6(d) present the corresponding en face OCT image and micro-elastogram, at a depth of 120 µm from the tissue surface. The histology image (Fig. 6(b)) reveals that the top right corner corresponds to a region of IMC. Adjacent to this, in the top left corner, there is a region of DCIS. Surrounding these regions, there are areas of non-cancerous stroma. In the micro-elastogram (Fig. 6(d)), the region of IMC corresponds to a region of elevated elasticity. By comparison, although there is contrast in the OCT image (Fig. 6(c)), it is difficult to identify this region. Conversely, the region of DCIS is not easily distinguished in the micro-elastogram and is more readily identified in the OCT image, demonstrating the complementarity of OCT and QME.
Fig. 6. Handheld breast tissue results of a specimen containing IMC. (a) Photograph of the scanned area. (b) Co-registered histology. En face (c) OCT image and (d) micro-elastogram at a depth of 120 µm. IMC, invasive mucinous carcinoma. DCIS, ductal carcinoma in situ. Scale bars = 1 mm.
Fig. 7. Handheld breast tissue results of a specimen containing IMSCC. (a) Photograph of the scanned area. (b) Co-registered histology. En face (c) OCT and (d) micro-elastogram at a depth of 120 µm from the tissue surface. IMSCC, invasive metaplastic spindle cell carcinoma. A, adipose. Scale bars = 1 mm.
4. Discussion
In QME, we typically acquire a 3-D scan during each acquisition [12,23]. This approach enables micro-elastograms to be presented in the en face plane, as has been demonstrated in this paper. Two key benefits are that micro-elastograms are displayed in the plane with the highest spatial resolution, and a larger tissue area can be presented than in the cross-sectional plane, an advantage for applications where rapid analysis of large regions of tissue is required. A main challenge to this approach, with regards to handheld scanning, is that motion artifact can corrupt both the OCT image and the micro-elastogram, as has been described in detail in this paper. This challenge is further exacerbated by the use of MEMS scanners to achieve compact handheld imaging probes. A main contribution of this paper is to overcome these challenges to enable the first handheld demonstration of QME without the requirement of supporting apparatus. Furthermore, we demonstrated that the handheld OCT and QME image quality was comparable to that obtained when the probe was mounted in a bench-top setup. To achieve this, we developed a custom bidirectional scan pattern, synchronized with deformation imparted to the tissue via a custom PZT actuator, to acquire B-scans in both positive and negative x-directions. This custom scan pattern allowed us to acquire a 6 × 6 × 1 mm volume of tissue in 3.4 seconds.
In Sections 2.4 and 3.1, the performance of the two different scan patterns were compared. We verified that the elasticity sensitivity was much better using the custom scan pattern than using the standard scan pattern. This can be attributed to the longer time difference between the acquisition of the two B-scans used to generate the phase difference map, since phase decorrelation is more likely, due to larger hand motion in either the lateral or axial plane. When decorrelated, the measured phase difference is random thus the average gradient of the displacement along z-axis is close to 0 which is much smaller than it should be, resulting in a very small strain value in the strain estimation which in turn generates a very large elasticity value, e.g., the spikes in Fig. 3(b). Although the custom scan pattern reduced the time difference between B-scans significantly, it is still possible for motion artifact to cause phase decorrelation, particularly in in vivo handheld scans, where the relative motion between the tissue and the probe may be increased by involuntary patient movement. As we move towards
To achieve such higher scanning speed, a Fourier domain mode-locked laser could be used to reach higher A-scan rates, e.g. 1.5 MHz has been demonstrated in shear-wave OCE [35]. In addition, the time difference between consecutive B-scans could be reduced by selecting a smaller MEMS mirror in the scanner, e.g., a 2-mm diameter mirror could be used, which may have a first harmonic at >1 kHz. However, a disadvantage with a smaller mirror is a smaller collimated beam size which degrades the lateral resolution. The low-pass-filter incorporated in our probe to protect the MEMS mirror from resonant excitation of the mechanical modes could also be removed. This would allow us to drive the MEMS mirror at its resonant frequency, with a custom scan pattern only containing frequency components equal or below the resonant frequency. Using this approach, extra care is required to ensure the MEMS device is not damaged.
The measured elasticity values in QME are dependent on the pre-load strain. For example, in Figs. 3(a) and 3(c), the mean elasticity measured with each configuration is slightly different due to different pre-load strain applied during the scans. In future work, the amount of pre-load can be normalized by monitoring the layer thickness in OCT B-scans and manually adjusting the pre-load accordingly to a certain level, to enable constant and repeatable elasticity measurements. In addition, there is ~10% error in the pre-load strain estimation, due to unevenness of the layer thickness, and only a single value is used as the initial layer thickness, resulting in variations of the elasticity measurement. To improve the accuracy of QME, in future work, a 2-D layer thickness map can be generated by acquiring a 3-D OCT scan of the layer prior to the QME scan. This 2-D thickness map can be used to calculate the pre-load strain for each A-scan location, to avoid error in pre-load strain estimation. In in vivo scenarios, large periodic movement from the patient, e.g. respiration, will likely cause a fluctuation in the pre-load strain, resulting in degraded sensitivity and accuracy of the elasticity measurement. However, if the patient motion occurs in a relatively linear region of the stress-strain curve, typically 0-5% strain for human tissue, the impact on measured elasticity value is small. Ultimately, this issue can be mitigated by increasing the acquisition speed to allow scanning the tissue volume within a fraction of the periodic movement, where the patient can be considered in a quasi-static state.
In this paper, we have demonstrated for the first time the use of handheld QME on mastectomy specimens containing both invasive and in situ regions of tumor. Of these, one contained the more common invasive ductal carcinoma and another contained regions of ductal carcinoma in situ, while the others contained rarer tumor types including invasive mucinous carcinoma and invasive metaplastic spindle cell carcinoma. The quality of the specimen images derived from the handheld scans allowed us to correlate micro-architecture of high elastic tissue with histology. We used mastectomy specimens in this study, as opposed to lumpectomy specimens derived from breast conserving surgery, because en face images from mastectomy specimens are easier to co-register with histology. However, as the ultimate goal of our handheld QME work is to provide surgeons with an imaging tool to use during breast conserving surgery, our future work will aim to demonstrate that the probe can identify tumor on the margins of excised specimens and in the breast cavity during surgery.
5. Conclusion
This paper introduced a proof-of-concept handheld QME probe incorporating a custom bidirectional scan pattern that can scan a 6 × 6 × 1 mm volume of tissue in 3.4 seconds, with a B-scan rate of 215 Hz. It has been demonstrated that this probe is capable of producing comparable image quality in a handheld format, to that when the probe is fixed to the benchtop. Freshly dissected human breast tissue from three mastectomy specimens were scanned using this probe, verifying that the probe can provide high mechanical contrast between stiff cancerous tissue and soft benign tissue, complementary to that provided by OCT. By further increasing the scanning speed and modifying the probe form factor, handheld QME holds promise for use in a wide range of clinical scenarios.
Funding
Australian Research Council (ARC); Department of Health, Western Australia; Cancer Council, Western Australia; OncoRes Medical.
Acknowledgments
We would like to thank Michael Leitner, Christian Lührs and Sebastian Schaefer from Thorlabs for their advice and guidance on using the handheld probe.
Disclosures
BFK: OncoRes Medical (F, I), LC, AC, BL and CMS: OncoRes Medical (I). The other authors declare that there are no conflicts of interest related to this article.
References
1. R. M. S. Sigrist, J. Liau, A. E. Kaffas, M. C. Chammas, and J. K. Willmann, “Ultrasound elastography: review of techniques and clinical applications,” Theranostics 7(5), 1303–1329 (2017).
2. Y. K. Mariappan, K. J. Glaser, and R. L. Ehman, “Magnetic resonance elastography: a review,” Clin. Anat. 23(5), 497–511 (2010).
3. B. F. Kennedy, P. Wijesinghe, and D. D. Sampson, “The emergence of optical elastography in biomedicine,” Nat. Photonics 11(4), 215–221 (2017).
4. B. F. Kennedy, K. M. Kennedy, and D. D. Sampson, “A review of optical coherence elastography: fundamentals, techniques and prospects,” IEEE J. Sel. Top. Quantum Electron. 20(2), 7101217 (2014). 5. K. V. Larin and D. D. Sampson, “Optical coherence elastography - OCT at work in tissue biomechanics
[Invited],” Biomed. Opt. Express 8(2), 1172–1202 (2017).
6. D. Huang, E. A. Swanson, C. P. Lin, J. S. Schuman, W. G. Stinson, W. Chang, M. R. Hee, T. Flotte, K. Gregory, C. A. Puliafito, and J. G. Fujimoto, “Optical coherence tomography,” Science 254(5035), 1178–1181 (1991). 7. J. A. Mulligan, G. R. Untracht, S. N. Chandrasekaran, C. N. Brown, and S. G. Adie, “Emerging approaches for
high-resolution imaging of tissue biomechanics with optical coherence elastography,” IEEE J. Sel. Top. Quantum Electron. 22(3), 246–265 (2016).
8. B. I. Akca, E. W. Chang, S. Kling, A. Ramier, G. Scarcelli, S. Marcos, and S. H. Yun, “Observation of sound-induced corneal vibrational modes by optical coherence tomography,” Biomed. Opt. Express 6(9), 3313–3319 (2015).
9. S. Wang and K. V. Larin, “Noncontact depth-resolved micro-scale optical coherence elastography of the cornea,” Biomed. Opt. Express 5(11), 3807–3821 (2014).
10. B. F. Kennedy, R. A. McLaughlin, K. M. Kennedy, L. Chin, P. Wijesinghe, A. Curatolo, A. Tien, M. Ronald, B. Latham, C. M. Saunders, and D. D. Sampson, “Investigation of optical coherence microelastography as a method to visualize cancers in human breast tissue,” Cancer Res. 75(16), 3236–3245 (2015).
11. W. M. Allen, L. Chin, P. Wijesinghe, R. W. Kirk, B. Latham, D. D. Sampson, C. M. Saunders, and B. F. Kennedy, “Wide-field optical coherence micro-elastography for intraoperative assessment of human breast cancer margins,” Biomed. Opt. Express 7(10), 4139–4153 (2016).
12. W. M. Allen, K. M. Kennedy, Q. Fang, L. Chin, A. Curatolo, L. Watts, R. Zilkens, S. L. Chin, B. F. Dessauvagie, B. Latham, C. M. Saunders, and B. F. Kennedy, “Wide-field quantitative micro-elastography of human breast tissue,” Biomed. Opt. Express 9(3), 1082–1096 (2018).
14. T. Ihrai, D. Quaranta, Y. Fouche, J. C. Machiavello, I. Raoust, C. Chapellier, C. Maestro, M. Marcy, J. M. Ferrero, and B. Flipo, “Intraoperative radiological margin assessment in breast-conserving surgery,” Eur. J. Surg. Oncol. 40(4), 449–453 (2014).
15. N. M. A. Krekel, M. H. Haloua, A. M. F. Lopes Cardozo, R. H. de Wit, A. M. Bosch, L. M. de Widt-Levert, S. Muller, H. van der Veen, E. Bergers, E. S. M. de Lange de Klerk, S. Meijer, and M. P. van den Tol,
“Intraoperative ultrasound guidance for palpable breast cancer excision (COBALT trial): a multicentre, randomised controlled trial,” Lancet Oncol. 14(1), 48–54 (2013).
16. F. T. Nguyen, A. M. Zysk, E. J. Chaney, J. G. Kotynek, U. J. Oliphant, F. J. Bellafiore, K. M. Rowland, P. A. Johnson, and S. A. Boppart, “Intraoperative evaluation of breast tumor margins with optical coherence tomography,” Cancer Res. 69(22), 8790–8796 (2009).
17. H. Ballal, D. B. Taylor, A. G. Bourke, B. Latham, and C. M. Saunders, “Predictors of re-excision in wire-guided wide local excision for early breast cancer: a Western Australian multi-centre experience,” ANZ J. Surg. 85(7-8), 540–545 (2015).
18. R. Jeevan, D. A. Cromwell, M. Trivella, G. Lawrence, O. Kearins, J. Pereira, C. Sheppard, C. M. Caddy, and J. H. P. van der Meulen, “Reoperation rates after breast conserving surgery for breast cancer among women in England: retrospective study of hospital episode statistics,” BMJ 345(jul12 2), e4505 (2012).
19. A. S. Majid, E. S. de Paredes, R. D. Doherty, N. R. Sharma, and X. Salvador, “Missed breast carcinoma: pitfalls and pearls,” Radiographics 23(4), 881–895 (2003).
20. R. M. Kamal, N. M. Abdel Razek, M. A. G. Hassan, and M. A. Shaalan, “Missed breast carcinoma; why and how to avoid?” J. Egypt. Natl. Canc. Inst. 19(3), 178–194 (2007).
21. J. M. Park, L. Yang, A. Laroia, E. A. Franken, Jr., and L. L. Fajardo, “Missed and/or misinterpreted lesions in breast ultrasound: reasons and solutions,” Can. Assoc. Radiol. J. 62(1), 41–49 (2011).
22. J. Wang, X. Yang, H. Cai, W. Tan, C. Jin, and L. Li, “Discrimination of breast cancer with microcalcifications on mammography by deep learning,” Sci. Rep. 6(1), 27327 (2016).
23. K. M. Kennedy, L. Chin, R. A. McLaughlin, B. Latham, C. M. Saunders, D. D. Sampson, and B. F. Kennedy, “Quantitative micro-elastography: imaging of tissue elasticity using compression optical coherence
elastography,” Sci. Rep. 5(1), 15538 (2015).
24. K. M. Kennedy, S. Es’haghian, L. Chin, R. A. McLaughlin, D. D. Sampson, and B. F. Kennedy, “Optical palpation: optical coherence tomography-based tactile imaging using a compliant sensor,” Opt. Lett. 39(10), 3014–3017 (2014).
25. B. Krajancich, A. Curatolo, Q. Fang, R. Zilkens, B. F. Dessauvagie, C. M. Saunders, and B. F. Kennedy, “Handheld optical palpation of turbid tissue with motion-artifact correction,” Biomed. Opt. Express 10(1), 226– 241 (2019).
26. B. F. Kennedy, S. H. Koh, R. A. McLaughlin, K. M. Kennedy, P. R. T. Munro, and D. D. Sampson, “Strain estimation in phase-sensitive optical coherence elastography,” Biomed. Opt. Express 3(8), 1865–1879 (2012). 27. M. J. Ju, M. Heisler, A. Athwal, M. V. Sarunic, and Y. Jian, “Effective bidirectional scanning pattern for optical
coherence tomography angiography,” Biomed. Opt. Express 9(5), 2336–2350 (2018).
28. B. F. Kennedy, R. A. McLaughlin, K. M. Kennedy, L. Chin, A. Curatolo, A. Tien, B. Latham, C. M. Saunders, and D. D. Sampson, “Optical coherence micro-elastography: mechanical-contrast imaging of tissue
microstructure,” Biomed. Opt. Express 5(7), 2113–2124 (2014).
29. M. S. Hepburn, P. Wijesinghe, L. Chin, and B. F. Kennedy, “Analysis of spatial resolution in phase-sensitive compression optical coherence elastography,” Biomed. Opt. Express 10(3), 1496–1513 (2019).
30. G. Lamouche, B. F. Kennedy, K. M. Kennedy, C.-E. Bisaillon, A. Curatolo, G. Campbell, V. Pazos, and D. D. Sampson, “Review of tissue simulating phantoms with controllable optical, mechanical and structural properties for use in optical coherence tomography,” Biomed. Opt. Express 3(6), 1381–1398 (2012).
31. P. Wijesinghe, D. D. Sampson, and B. F. Kennedy, “Computational optical palpation: a finite-element approach to micro-scale tactile imaging using a compliant sensor,” J. R. Soc. Interface 14(128), 20160878 (2017). 32. K. Y. Ha, P. Deleon, and W. Deleon, “Invasive mucinous carcinoma of the breast,” Proc. Bayl. Univ. Med. Cent.
26(3), 295–297 (2013).
33. J. W. Mituś, B. Sas-Korczyńska, A. Kruczak, M. Jasiówka, and J. Ryś, “Metaplastic breast cancer with rapidly progressive recurrence in a young woman: case report and review of the literature,” Arch. Med. Sci. 12(6), 1384–1388 (2016).
34. H. Alaoui M’hamdi, F. Abbad, H. Rais, H. Asmouki, A. Soumani, M. Khouchani, and R. Belbaraka, “Rare variant of metaplastic carcinoma of the breast: a case report and review of the literature,” J. Med. Case Reports 12(1), 43 (2018).