University of Warwick institutional repository: http://go.warwick.ac.uk/wrap
A Thesis Submitted for the Degree of PhD at the University of Warwick
http://go.warwick.ac.uk/wrap/62024
This thesis is made available online and is protected by original copyright. Please scroll down to view the document itself.
I
structures for use in chiral resolution, catalysis and
fluorescence studies
Submitted for the degree of Doctor of Philosophy
February 2014
Beth Moore
II Acknowledgements ... XXIII
List of Publications ... XXIV
Abbreviations ... XXV
Thesis Summary ... XXIX
Polymerization Techniques ... 2
1.1.1 Reversible-Deactivation Radical Polymerization ... 2
1.1.2 Heterogeneous and emulsion polymerization ... 10
1.2 Amino Acids in Polymers and Structures ... 13
1.1.2 Amino acid monomers... 13
1.2.2 Polymeric structures incorporating amino acids ... 15
1.3 Enantiomer Resolution ... 19
1.4 Catalysis ... 23
1.4.1 Immobilized Catalysts ... 23
1.4.2 MacMillan Catalysis ... 32
1.5 Fluorescence ... 39
1.5.1 Forster resonance energy transfer ... 41
1.6 Summary ... 44
1.7 References ... 45
III
2.3.1 Synthesis of Monomers ... 66
2.3.2 Polymerization Investigation ... 68
2.3.3 Synthesis of poly(M 2.1) via a pentafluorophenylacrylate scaffold ... 76
2.3.4 Interaction between chiral monomers and BINOL ... 84
2.3.5 Interactions between chiral polymers and BINOL ... 95
2.3.6 Physical Separation ... 99
2.4 Conclusions ... 106
2.5 Experimental ... 107
2.5.1 Instrumentation ... 107
2.5.2 Methods and Techniques ... 108
2.6 References ... 116
3. 1 Abstract ... 121
3.2 Introduction ... 123
3.3 Results and discussion ... 129
3.3.1 Monomer Synthesis ... 129
3.3.2 Polymer Synthesis ... 133
3.3.3 Polymer properties ... 140
3.3.4 Diels-Alder Catalysis ... 147
IV
3.5.1 Instrumentation ... 164
3.5.2 Methods and Techniques ... 165
3.6 References ... 172
4.1 Abstract ... 176
4.2 Introduction ... 177
4.2 Introduction ... 177
4.3 Results and Discussion ... 182
4.3.1 Nanogel Synthesis ... 182
4.3.2 Diels-Alder catalysis ... 192
4.3.3 Selectivity ... 203
4.3.4 Hydrophobic effect/concentrator effect ... 209
4.4 Conclusions ... 222
4.5 Experimental ... 223
4.5.1 Instrumentation ... 223
4.5.2 Methods and Techniques ... 224
4.6 References ... 226
5.2 Introduction ... 232
5.3 Results and Discussion ... 241
V
5.5.1 Instrumentation ... 279
5.5.2 Methods and Techniques ... 280
Conclusions ... 290
VI Figure 1.2. The structures of the different common types of CTA. ... 5
Figure 1.3. The structures of MAMs and LAMs. ... 6
Figure 1.4. The resonance structures that can be formed by xanthates and
dithiocarbamates which help to stabilize the radical... 7
Figure 1.5. The generally accepted mechanism for RAFT polymerization. ... 8
Figure 1.6. A representation of the synthetic process for emulsion polymerization. . 11
Figure 1.7. A reproduction of a the different synthetic routes available for the
synthesis of poly(amino acids). ... 14
Figure 1.8. A representation of two enantiomers based on a tetrahedral carbon atom.
... 15
Figure 1.9. A reproduction of an overview of the differing stabilities afforded from
mixtures of chiral leucine polymers. ... 17
Figure 1.10. The structure of the pH-responsive tryptophan polymer. ... 17
Figure 1.11. A reproduction of the fluorescence microscopy images that were used in
alongside other data to demonstrate the negligible cytotoxicity effect of
poly(tryptophan). ... 18
Figure 1.12. A reproduction of a representation of the chemical and 3D structure of
cyclodextrins. ... 20
Figure 1.13. A reproduction of a representation of how templating is used to form
MIPs. ... 21
Figure 1.14. A reproduction of an overview of the work carried out by Kristensen et
VII temperature. ... 26
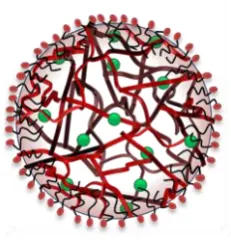
Figure 1.16. A representation of how a catalyst (green circles) could be immobilized
into a cross-linked surfactant stabilized nanogel. ... 28
Figure 1.17. A reproduction of the conversion of the reaction between vinyl epoxide
and phenyl boronic acid catalyzed by either palladium supported within a micelle or
in a small molecule... 29
Figure 1.18. A reproduction of an overview of the compartmentalized catalysts used
in a cascade reaction... 30
Figure 1.19. A reproduction of an overview of how the proline moieties (depicted in
red) are in different environments dependent on the structure of the polymer.136 ... 31
Figure 1.20. The structure of the MacMillan catalyst. ... 32
Figure 1.21. A schematic representation of the reactions that the MacMillan catalyst
has successfully catalyzed. ... 33
Figure 1.22. A 3D representation of the transition state reproduced from
MacMillan’s paper. In this depiction the benzyl group is shielding the top side of the
dieneophile from attack. ... 34
Figure 1.23. A schematic illustrating the advantages of the 2nd generation MacMillan
catalyst reproduced from MacMillan’s paper. Here the catalyst is being used for
indole alkylations which uses the same catalytic control as the DA reaction. The
nitrogen lone pair is more exposed, the top face (si-face) is more covered and the re
-face is more accessible. Models 1 and 2 show the differing lone pair accessibility of
both catalysts: model 1 shows the interaction between the CH3 group and the lone
VIII not the case for the 2nd generation catalyst in model 4. ... 36
Figure 1.24. A reproduction of an overview of the immobilized MacMillan catalyst
being used in a flow set-up for the catalysis of the DA reaction. ... 37
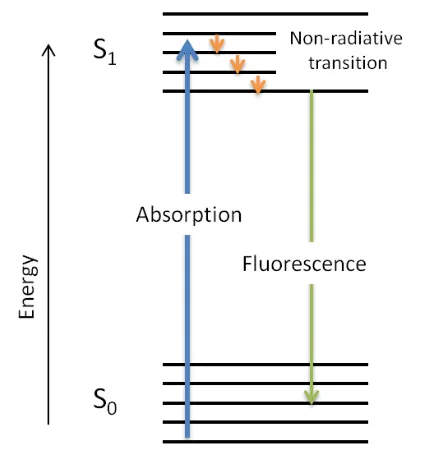
Figure 1.25. Jablonski diagram illustrating the process of fluorescence. ... 39
Figure 1.26. Jablonski diagram illustrating the process of fluorescence. ... 41
Figure 1.27. A reproduction of the fluorescence emission spectrum of tryptophan and
the ribonucleoside FRET pair. The left hand sepectra shows the emission (solid line)
and absorption spectra (dashed line) of the tryptophan (blue) and the ribonucleoside
FRET pair (red). The right hand spectra show that the tryptophan emission is
decreasing and ribonucleoside emission increasing with increased concentrations of
the ribonucleoside. The inset shows the emission spectrum at saturation. ... 43
Figure 2.1. A reproduction of the table of contents figure for the work published by
De et al. ... 58
Figure 2.2. A reproduction of the table of contents figure for the work published by
Mori et al. ... 59
Figure 2.3. The structures of (S)- and (R)- BINOL with the phenolic protons
highlighted which give rise to the trackable signal. ... 61
Figure 2.4. A reproduction of an image of the separation of (rac)-BINOL
enantiomers in 1H NMR spectroscopy caused by a leucine monomer. ... 62
Figure 2.5. A reproduction of the 1H NMR spectrum from the work conducted by
Redando et al. The bottom spectrum shows a 1H NMR spectrum of omeprazole on
IX Figure 2.6.1H NMR (300 MHz) spectrum for L-M 2.1 in CDCl3. ... 65
Figure 2.7.13C NMR (75 MHz) spectrum for L-M 2.1 in CDCl3. ... 65
Figure 2.8. The CTAs used and a selection of SEC traces for entries 1, 3, 14, 15, 23
and 25 from Table 2.1. ... 68
Figure 2.9. The structure of M 2.1and an acrylamide based monomer of tryptophan
(L-A-Trp-OH) with a free carboxylic acid which is easily polymerized via RAFT
synthesized by Kumar15 and Mori14 and a tryptophan monomer functionalized
through the carboxylic acid synthesized by De (Boc-L-Trp-HEMA). ... 69
Figure 2.10. 1H NMR (300 MHz) of M 2.2 in CDCl3. ... 72
Figure 2.11. 1H NMR (300 MHz) spectrum in CDCl3 of the original M 2.2 and the
end product of the four reactions outlined in Table 2.2 focussing on the proton signal
for the proton adjacent to the bromine. ... 73
Figure 2.12. 1H NMR (300 MHz) spectrum (top) and 19F NMR (282 MHz) spectrum
(bottom) of M 2.3 in CDCl3. ... 76
Figure 2.13. 19F NMR (375 MHz) spectrum of M 2.3 (top) and poly(M 2.3)
(bottom) in CDCl3. ... 77
Figure 2.14. 19F NMR (375 MHz) spectra of poly(M 2.3) before (top) and after
substitution (bottom) in CDCl3. ... 78
Figure 2.15. 1H NMR (300 MHz) spectrum of poly(M 2.1) in CDCl3 ... 78
Figure 2.16. SEC traces of a) poly(M 2.3) in CHCl3 and b) poly(M 2.1) in DMF. . 79
Figure 2.17. MALDI-TOF spectra of poly(M 2.1). MALDI-ToF was collected on
poly(M 2.1) of DP 18 calculated from the 1H NMR spectrum, using dithranol as a
X Figure 2.20. The monomers, polymers and their combinations with (rac)-BINOL. . 84
Figure 2.21. The chemical structure of the two enantiomers of (rac)-BINOL. The
protons highlighted in the box are those used to examine the interactions. ... 84
Figure 2.22. 1H NMR (300 MHz) spectrum showing the interaction of the four
monomers with (rac)-BINOL. a) (rac)-BINOL with no monomers; b) (rac)-BINOL
+ L-M 2.4; c) (rac)-BINOL + D M 2.4; d) (rac)-BINOL + L-M 2.1 and e) (rac
)-BINOL + D-M 2.1. At 1.0:1.0 molar ratio of (rac)-BINOL:monomer.in CDCl3. .... 86
Figure 2.23. 1H NMR (300 MHz) spectrum showing the effect of altering the molar
ratios of (rac)-BINOL and L-M 2.4. a) (rac)-BINOL with no added monomer; b)
(rac)-BINOL: L-M 2.4 1.0:0.6; c) 1.0:1.0; d) 1.0:1.2; e) 1.0:1.5; f) 1.0:1.9 and g)
1.0:2.4 in CDCl3. ... 87
Figure 2.24. 1H NMR (300 MHz) spectrum of (R)-BINOL before and post exposure
to D2O in CDCl3. The phenolic peaks have been highlighted with the relative
integration falling from 0.97 in the (R)-BINOL 1H NMR spectrum to 0.79 in the
deuterated (R)-BINOL 1H NMR spectrum. ... 88
Figure 2.25. 1H NMR (300 MHz) spectrum showing the interaction of (rac)-BINOL
with part deuterated (R)-BINOL with (A) L-M 2.4; (B) D- M 2.4; (C) L-M 2.1 and
(D) D- M 2.4 in CDCl3. The furthest shifted enantiomer has been labelled as either
(R)- of (S)- BINOL and the spectra have been labelled to indicate if the monomer is
either L- or D-. ... 89
Figure 2.26. 1H NMR (300 MHz) spectrum of a racemic mixture of M 2.4 with a) no
added BINOL b) (R)-BINOL added and c) (S)-BINOL added at a molar ratio of 2:1
XI a) racemic M 2.4 as a standard in CDCl3. ... 91
Figure 2.28. 1H NMR (300 MHz) spectra of a) (rac)-BINOL at a 1.0:1.0 ratio of
(rac)-BINOL to residues with polymers with b) poly(L-M 2.4)(DP 38) and c)
poly(L-M 2.1) (DP 150) and d) poly(L-M 2.1) (DP 66) in CDCl3. ... 93
Figure 2.29. 1H NMR (300 MHz) spectra of a) (rac)-BINOL and poly(L-(M 2.1)
(DP 150) polymer at varying ratios of residue: (rac)-BINOL of b) 1.0:0.8, c) 1.0:0.9
d) 1.0:1.0 and e) 1.0:1.1 in CDCl3. ... 94
Figure 2.30. 1H NMR (300 MHz) spectum of a) (rac)-BINOL and the spectra
showing the interactions of (rac)-BINOL with poly(L-M 2.4) varies with
temperature b) 198 K c) 303 K d) 308 K e) 313 K f) 318 K in CDCl3. ... 95
Figure 2.31. CD spectrum of poly(M 2.1) at 1 mg mL-1 in dioxane measured in an
0.1 mm cell. ... 96
Figure 2.32. CD spectra of 1 mg mL-1 M 2.1 in 0.1 mm cell in dioxane (blue line)
and the same sample with 0.01 mL of 1 mg mL-1 (rac)-BINOL in dioxane (red line).
... 96
Figure 2.33. A reproduction of the TOC of Deng et al. work along with the release
data for the proline enantiomers from their chiral-APCN and the structure of the
L-alanine monomer used in this work. ... 97
Figure 2.34. 1H NMR spectrum (300 MHz) of M 2.4-OH in DMSO. ... 99
Figure 2.35 1H NMR (300 MHz) spectrum for the synthesized monomer M-PDMS
in CDCl3. ... 100
Figure 2.36. IR of the chiral-APCN with peaks from the two monomers highlighted.
XII Figure 3.2. A representative of the energy overlap of the p orbital of the DA reaction
highlighting the symmetry and energy overlap of the HOMO of the diene and
LUMO of the dienophile. ... 125
Figure 3.3. A 3D representation of the transition state reproduced from MacMillans
paper.1 In this depiction the benzyl group is shielding the top side of the dienophile
from attack. ... 126
Figure 3.4. The structure of the methacrylic MacMillan monomer used by Kristensen
et al. and the resulting cross-linked polymer beads. ... 127
Figure 3.5. 1H NMR (300 MHz) spectrum of M 3.1 in CD3OD. ... 131
Figure 3.6. 13C NMR (75 MHz) spectrum of M 3.1 in CD3OD. ... 131
Figure 3.7. IR spectrum of M 3.1 indicating the presence of a secondary amine,
carbonyl groups and carbon-carbon double bond. Other significant absorbencies
around 1130 cm-1 are attributed to C-O bonds and 1030 cm-1 to C-N bonds. ... 132
Figure 3.8. A representative 1H NMR spectrum (300 MHz) in CD3OD of the
synthesized functional copolymers; polymer presented is P 3.2. The relative
incorporation of the two monomers was determined from the signals of g and l, here
integrated to 1.00 and 2.86. (1.00/3.86*100% = 26%) ... 134
Figure 3.9. HPLC chromatogram of a sample containing both (S)- and (R
)-MacMillan catalyst black line) and recovered S-MacMillan catalyst after exposure to
polymerization conditions (red line). Only the (S)-catalyst is detected after exposure
to the polymerization conditions. ... 136
Figure 3.10. A schematic illustration of the different reactions that can take place
XIII Figure 3.12. Plot of monomer fraction in the initial feed and in resulting co-polymer
of M 3.1 and DEGMA, used to determine reactivity ratios. ... 139
Figure 3.13. A photo of the polymer P 3.1 – P 3.7, as the catalyst incorporation
increases the polymers’ physical appearance changes form a yellow sticky solid to a
white fluffy solid. ... 141
Figure 3.14. A reproduction of graphs highlighting the dependence of temperature on
composition for both LCST and UCST systems. ... 143
Figure 3.15. Cloud point data for poly(DEGMA), P 3.1 and P 3.2 across a range of
concentrations in water. The data was recorded at 500 nm with a heating/cooling rate
of 1 ˚C min-1
. The cloud point was taken at the temperature when the absorbance
equalled 0.5 after the data had been normalized between 0 and 1 absorbance units.
... 144
Figure 3.16. LCST cloud point measurements traces taken at 0.5 mg mL-1 and
measured at 500 nm with the temperature taken at 0.5 absorbance units after the data
had been normalized between 0 and 1 for a) poly(DEGMA) (blue line) b) P 3.1 (red
line) and c) P 3.2 (green line)... 146
Figure 3.17. A representative 1H NMR (300 MHz) spectrum in CDCl3 of the DA
products. ... 148
Figure 3.18. A representative GC chromatogram of the DA products. ... 148
Figure 3.19 The structures of M 3.1 and the MacMillan catalyst. ... 149
Figure 3.20. The conversions and selectivities of the data highlighting the similarity
XIV Figure 3.22. The conversions and selectivities for the DA reaction between
cyclopentadiene and trans-hexen-1-al after 4 h for M 3.1, P 3.2 and P 3.7 at different
temperatures (4, 20, 40 and 60 ˚C) at 5 mol%. ... 156
Figure 3.23. THF SEC UV 309 nm trace of P 3.6 before (black line) and after end
group removal (red line), along with the structures of the two polymers. ... 157
Figure 4.1. The structures of the dendrimers used in the experiments which
demonstrated the concentrator effect by Fréchet and co-workers9 (left) and the
structure of the catalyst DMAP (right) that was investigated. ... 178
Figure 4.2. Conversions of the monomers in the nanogel with EMA (blue line)
(relative conversion) and M 3.1 (red line). The integration of monomer: polymer for
M 3.1 was used to determine conversion. As EMA monomer will have been
removed on removal of THF, the final 1H NMR spectrum was taken to be 100%
conversion for EMA and the relative integration of EMA polymer to M 3.1 polymer
was used to determine the conversion of EMA. ... 184
Figure 4.3. Number (blue line), Volume (red line) and Intensity (green line) DLS
traces for the nanogels N 4.1 – N 4.9. ... 187
Figure 4.4. The correlation coefficient for the DLS measurement of N 4.4. ... 188
Figure 4.5. TEM image and frequency count of the nanogels incorporating the
MacMillan catalyst. TEM samples were prepared by drop deposition of a 0.1 mg
mL-1 polymer solution in water onto copper/carbon grids that had been pre-treated
with oxygen plasma and analyzed by using a JEOL TEM-2100 microscope operating
XV ... 191
Figure 4.7. A schematic representation of reactions carried out varying the nanogel
concentration and catalyst concentration (as affected by the difference in catalyst
DoF), represented with arbitrary DoF of 2, 3 and 4. ... 195
Figure 4.8. A graph demonstrating the clear effect of mol% (blue) on the conversions
(red) of the DA reaction between cinnamaldehyde and cyclopentadiene catalyzed by
nanogels N 4.1 – N 4.6 at various mol%, in water (maintaining a volume of 2 mL).
... 197
Figure 4.9. Conversion against time for the DA reaction between cyclopenatdiene
and cinnamaldehyde catalyzed by N 4.5 in 2 mL giving 9.8 mol% loading. ... 198
Figure 4.10. The conversion against time of M 3.1 (blue line) in 100 uL H2O and N
4.5 (red line) in 1.02 mL H2O. ... 211
Figure 4.11. Number (blue line), Volume (red line) and Intensity (green line) DLS
traces for the nanogels synthesized in this work. ... 215
Figure 4.12. TEM image and frequency count of the SN 4.1 – SN 4.3 incorporating
the MacMillan catalyst. TEM samples were prepared by drop deposition of a 0.1 mg
mL-1 polymer solution in water onto copper/carbon grids that had been pre-treated
with oxygen plasma and analyzed by using a JEOL TEM-2100 microscope operating
at 200 kV. ... 216
Figure 4.13. A schematic representation of the changeable nature of the shell
characteristic at low temperatures (a hydrophilic fully extended polymer) or high
XVI Figure 5.1. A reproduction of the 3D representation of Snase, the L-tryptophan
moiety highlighted in purple is the last residue to exhibit order. ... 232
Figure 5.2. A reproduction of the excitation (red line) and emission (purple line)
spectra of phenylalanine, tyrosine and tryptophan in an aqueous pH 7 solution. .... 233
Figure 5.3. A reproduction of a figure which demonstrates how the influence of
packing parameters can affect the self-assembled structure. ... 235
Figure 5.5. 1H NMR (300 MHz) spectrum of M 5.1 in CDCl3. ... 242
Figure 5.6. 13C NMR (75 MHz) spectrum of M 5.1 in CDCl3, expanded parts of the
spectrum are inserted where two peaks have very similar shifts. ... 242
Figure 5.7. Structures of the CTA 5.1 and 5.2 used in the polymerization of M 5.1,
detailed in Table 5.1. ... 244
Figure 5.8. 1H NMR (300 MHz) spectrum of the conversion of M 5.1 in CDCl3 with
polymeric peaks highlighted and observed monomeric peaks labelled. The
conversion was calculated by subtracting the monomer peaks and CDCl3 peak from
the integral and comparing the value to the quantity of monomer still left. e.g.
((15.28-0.79-5)/5) × (1/(1.898+1))*100% = 65%. ... 245
Figure 5.9. A plot of ln(M)0/(M)t against time for the polymerization of P 5.1, entry
1 in Table 5.1... 246
Figure 5.10. SEC trace of P 5.1 (red line) and the chain extension (blue line) (DMF,
PMMA calibration). ... 247
Figure 5.11. Conversions of the monomers in the nanogel with EMA (blue) (relative
conversion) and M 5.1 (red). The integration of monomer: polymer for M 5.1 was
XVII determine the conversion of EMA. ... 250
Figure 5.13. SEC trace showing the RI (blue line) and UV 309 nm trace (red line)
(DMAC, PMMA calibration). ... 251
Figure 5.14. PDA analysis from THF SEC showing monomer (top) and nanogel
co-polymer (bottom). Left hand axis shows elution time (min), right hand axis shows
wavelength (nm) and the vertical axis shows intensity. ... 252
Figure 5.15. A plot of decay time against scattering vector squared for N 5.3c. The
resulting gradient is the diffusion coefficient of the particles. ... 254
Figure 5.16. Representative TEM images of the synthesized nanogels, which
demonstrates the spherical nature of the synthesized particles - scale bar is 100 nm.
TEM samples were prepared by drop deposition of a 0.1 mg mL-1 polymer solution
in water onto copper/carbon grids that had been pre-treated with oxygen plasma and
analyzed by using a JEOL TEM-2100 microscope operating at 200 kV. ... 256
Figure 5.17. The fluorescence spectra (λex = 380 nm, slit width = 10 nm) of M 5.1
(blue line) and P 5.1 (red line) in THF at 1 mg mL-1, Rayleigh scattering λ = 380 nm.
... 258
Figure 5.18. Fluorescence spectrum of N 5.1 (λex = 280 nm, slit width = 2.5 nm),
which equates to 0.0006 mg mL-1 M 5.1 in H2O, Rayleigh scattering λ = 280 nm,
Raman Scattering λ = 560 nm in H2O. ... 259
Figure 5.19. Possible photoproducts of L-tryptophan. ... 260
Figure 5.20. The increase of intensity at λem = 500 nm of N 5.3 exciting at either λex
XVIII Figure 5.21. The excitation and emission fluorescence spectra of DNSA
encapsulated into an unfunctionalized EMA nanogel. The excitation spectrum (red
line) is based on emission at λem = 470 nm (Rayleigh scattering λ = 470 nm, Raman
scattering λ = 235 nm) and the emission spectrum (purple line) was excited at λex =
350 nm (Rayleigh scattering λ = 470 nm), slit width = 5 nm. ... 263
Figure 5.22. Fluorescence spectrum showing N 5.3 after purging with N2 with λex =
225 nm recorded every 5 min after addition of DNSA. ... 265
Figure 5.23. A graph showing the decrease in fluorescence intensity of L-tryptophan
with time, on addition of DNSA exciting at λex = 225 nm every 5 min, and the
trendlines that have been used to calculate specific times within the graph. ... 266
Figure 5.24. The fluorescence intensity of DNSA excited at λex = 350 nm for 1 mg
mL-1 (red line), 5 mg mL-1 (green line), 10 mg mL-1 (purple line), 20 mg mL-1 (blue
line), in THF (Rayleigh scattering λ = 350 nm). ... 267
Figure 5.25. The fluorescence intensity of DNSA excited at λex = 380 nm for 1 mg
mL-1 (red line), 5 mg mL-1 (green line), 10 mg mL-1 (purple line), 20 mg mL-1 (blue
line), in THF (Rayleigh scattering λ = 380 nm). ... 267
Figure 5.26. A typical DNSA fluorescence emission intensity against time plot.
Addition of 5 µL of 2 mg mL-1 THF solution to 200 µL of N 5.1 irradiated at λex =
225 nm every 5 min... 268
Figure 5.27. Representative TEM images of SN 5.1 – SN 5.5 which demonstrates the
spherical nature of the synthesized particles - scale bar is 100 nm. TEM samples
XIX Scheme 1.1. A schematic representation of the steps of initiation, propagation and
termination. I2 is the initiator and M the monomer. ... 3
Scheme 1.2. A representation of the ATRP process using a transition metal complex
(Mt) with a halide (X). ... 4
Scheme 1.3. A schematic representation of the generic synthesis of monomeric
versions of amino acids. ... 13
Scheme 1.4. A modified table of contents graphic demonstrating how the phenolic
protons of (rac)-BINOL are influenced by the presence of poly(L-tryptophan). ... 22
Scheme 1.5. A schematic representation of how a thermally responsive polymer can
be reclaimed and used for catalysis depending on the temperature of the system.105 27
Scheme 1.6. A schematic representation of iminium catalysis and the electrophilic
sites that are formed. ... 34
Scheme 2.1. Generic route for the synthesis of amino acid monomers with
(meth)acryloyl chloride. ... 57
Scheme 2.2. A schematic representation of how chiral structures are potentially able
to deliver enriched solutions. ... 60
Scheme 2.3. Synthetic route to L-M 2.1. ... 64
Scheme 2.4. The potential mechanism of cyclization for M 2.1 when exposed to a
radical flux and the suggested structures from either forming a) 7 member or b) 6
member ring. ... 70
Scheme 2.5. The synthetic route to M 2.2. ... 71
XX
2.4). ... 82
Scheme 2.9. The synthetic route to M 2.4-OH. ... 98
Scheme 2.10. The synthetic route to a chiral APCN including the synthesis of the
cross-linker. ... 100
Scheme 3.1. The mechanism of the MacMillan catalyst for the DA reaction. The
formation of the imine transition state (1) from the reaction of the α,β-unsaturated
aldehydes and the amine is crucial to lower the LUMO of the dienophile. ... 124
Scheme 3.2. The synthesis of (S)-MacMillan functionalized monomer (M 3.1) from
the amino acid (S) – tyrosine methyl ester. ... 130
Scheme 3.3. Polymerization scheme of M 3.1 and DEGMA via RAFT
polymerization and the structure of the resulting polymer. ... 133
Scheme 3.4. Model DA reaction, where R = C3H7 and where there are four possible
products: the endo and exo products of both enantiomers. ... 147
Scheme 3.5. A schematic of the DA reaction between cyclopentadiene and trans
-hexen-1-al giving the conditions of the reaction. ... 149
Scheme 3.6. A schematic representation of the loss of the TFA salt. ... 151
Scheme 3.7 A schematic to demonstrate the pseudo-continuous process. ... 160
Scheme 4.1. A schematic from Cotanada et al.’s paper which demonstrates how their
DMAP loaded micelle has molecular recognition properties. ... 179
Scheme 4.2. A schematic representation of the synthesis of a cross-linked nanogel
form the monomers EMA and M 3.1 with a cross-linker EGDMA stabilized by SDS.
XXI laid out by MacMillan is the (R)-enantiomer. The reaction between cyclopentadiene
and cinnamaldehyde produces almost equal amounts of exo and endo products. ... 193
Scheme 4.4. A schematic representation of the addition of a shell to a nanogel seed
molecule, the synthesis requires addition of a thermo-responsive monomer and a
small amount of additional SDS along with initiator. ... 213
Scheme 5.1. A schematic representation of the measurement of CMC with an
amphiphilic polymer and a fluorescent marker, in this case pyrene. Below the CMC
pyrene is located in the continuous phase whereas above the CMC it is located in the
hydrophobic cavity of the assembled structure. ... 234
Scheme 5.2. A representative scheme of the FRET process. The donor absorbs
radiation and fluoresces at a wavelength which excites the acceptor that in turn emits
at a different wavelength. ... 237
Scheme 5.3. The synthetic route to the L-tryptophan-containing monomer M 5.1. 241
Scheme 5.4. A schematic representation of the emulsion polymerization process used
in the synthesis of M 5.1 decorated cross-linked polymeric nanogels stabilized by
SDS and cross-linked with EGDMA. ... 248
Scheme 5.5. A Schematic to represent the FRET interaction between the
L-tryptophan-containing nanogel, A, and a FRET pair that is loaded into the nanogel.
... 262
Scheme 5.6. A schematic representation of the FRET experimental procedure. At t =
0 the DNSA is added to the fluorometer cell that already contains the nanogel
solution which is immediately irradiated with light and the spectrum recorded. The
XXII Scheme 5.7. A schematic representation of the structures synthesized through the
addition of polymeric shells to a L-tryptophan containing core. ... 272
Table 2.1. Conditions used for the attempted polymerization of M 2.1, varying the
CTA, solvent, temperature, time, concentration and equivalents of monomer, the
initiator and its equivalents. ... 67
Table 2.2. The conditions for the cyclization experiments conducted for M 2.2. ... 72
Table 2.3. The results of the ratio of (S)-BINOL to (R)-BINOL in various samples
before exposure to the chiral APCN and at extractions afterwards. ... 102
Table 3.1. The initial feed ratio, final catalyst incorporation, molecular weights and
molecular weight distribution for P 3.1 – P 3.7. ... 135
Table 3.2. The measured Tg values for the series of co-polymers P 3.1 – P 3.7 ... 141
Table 3.3. The DA reaction at rt for 4 h catalyzed by M 3.1 and MacMillan catalyst,
compared with reported literature values at 5 mol%. ... 150
Table 3.4. Kinetic data for the DA reaction of trans-hexen-1-al and cyclopentadiene
catalyzed by P 3.2 and P 3.6 The reactions were carried out in H2O, conversions
measured by 1H NMR spectroscopy and enantioselectivity by GC analysis. ... 154
Table 3.5. DA reaction of trans-hexen-1-al and cyclopentadiene catalyzed by P 3.6
with and without RAFT end group. The data for the reaction without end group is
the average of 2 repeats. ... 157
Table 3.6 Recycling data for the DA reaction catalyzed by P 3.6 where the polymer
XXIII
3.6 where additional TFA is added along with the solvents for each cycle. ... 160
Table 3.8. The DA reaction cyclopentadiene and trans-hexen-1-al with 1 eq. of TFA
for 4 h in H2O. ... 161
Table 3.9. The conversions and selectivities of the DA reaction between
cyclopentadiene and trans-hexen-1-al with P 3.2 at 5 mol% used in a pseudo-
continuous process with no further addition of TFA in each cycle. ... 162
Table 4.1. The synthesized nanogels N 4.1 – N 4.9 detailing the DoF (wt%) and
co-monomer. The hydrodynamic size (nm) and dispersity (measured by DLS) and
average diameter (nm) obtained from TEM... 185
Table 4.2. The conversions of DA reaction between cinnamaldehyde and
cyclopentadiene catalyzed by nanogels N 4.1 – N 4.6 at various mol%, in water
(maintaining a volume of 2 mL). ... 196
Table 4.3. The conversions and selectivities for the DA reaction between
cyclopenatdiene and cinnamaldehyde catalyzed by N 4.5 in 2 mL giving 9.8 mol%
loading. ... 198
Table 4.4. Conversion of the DA reaction between cinnamaldehyde and
cyclopentadiene catalyzed by N 4.3 – N 4.6 at 5 mol%, determined after 24 h. ... 199
Table 4.5. The conversions of the DA reaction after 24 h between cinnamaldehyde
and cyclopentadiene conducted with the nanogels N 4.4 – N 4.6 at 5 mol% in the
same volume of 1.365 mL. The volume was kept the same by the addition of water
to N 4.5 and N 4.6. ... 200
Table 4.6. Conversion of DA reaction between cinnamaldehyde and cyclopentadiene
XXIV
and N 4.6 at various mol%. The changing mol% has been achieved using two
different methods either varying the amount of substrate added to a fixed volume of
nanogel or by varying the amount of nanogel added to a fixed amount of substrate.
... 202
Table 4.8. The selectivities of the DA reaction after 24 h between cinnamaldehyde
and cyclopentadiene. Catalysed by N 4.4 to which the sets of catalysis are compared.
Entries 1 and 2 are the small molecule reaction, entries 3,4 and 5 different
co-monomer nanogel, entries 3 , 6 and 7 different mol % reaction, entries 3 and 8
different DoF nanogel and entries 3, 9 and 10 different DoF nanogel with the same
volume resulting in different mol%. ... 204
Table 4.9. The reported Tg values for the homopolymers of poly(MMA), poly(EMA)
and poly(nBuMA). ... 206
Table 4.10. Conversions of DA reaction between cinnamaldehyde and
cyclopentadiene catalyzed by M 3.1, N 4.4 and N 4.9 under different conditions,
determined after 24 h. ... 210
Table 4.11. The synthesized nanogels SN 4.1 – SN 4.3 detailing the shell monomer,
hydrodynamic size (nm) and dispersity (measured by DLS) and average diameter
(nm) obtained from TEM. ... 214
Table 4.12. Conversion of DA reaction between cinnamaldehyde and
cyclopentadiene catalyzed by SN 4.1, SN 4.2 and the more concentrated SN 4.1a and
SN 4.2a at various mol% at rt. ... 219
Table 4.13. The selectivities of SN 4.1 and SN 4.2 for the DA reaction after 24 h
XXV ... 221
Table 5.1. The range of conditions tested for the polymerization of M 5.1, altering
temperature, radical flux, CTA and monomer concentration, along with the
conversion and Đ of the resulting polymers. The structures of CTA 1 and 2 can be
seen in Figure 5.6. ... 243
Table 5.2. The details of the synthesized nanogels N 5.1 – N 5.8 including CLD,
co-monomer and size. ... 253
Table 5.3. The 1st and 2nd IP and gradient of decrease of L-tryptophan emission for
the addition of DNSA to the nanogels N 5.1 – N 5.8... 270
Table 5.4. Details of synthesized nanogels SN 5.1 – SN 5.5 including parent core,
shell monomer and shell CLD... 273
Table 5.5. The 1st IP results of SN 5.1-SN 5.3 with addition of DNSA. These
nanogels have the same shell, EMA, but have increasing levels of CLD. ... 275
Table 5.6. The 1st IP results of SN 5.4, SN 5.2 and SN 5.5 with addition of DNSA.
These nanogels have the same CLD of 0.5% but have a different shell monomer of
XXII for the degree of Doctor of Philosophy. It has been composed by myself and has not
been submitted in any previous application for any degree. The work presented has
been carried out by the author. The nanogel synthesis in Chapters 4 and 5 was
developed in collaboration with Miss Dafni Moatsou and Dr. Annhelen Lu; the
corresponding TEM images were obtained by Miss Dafni Moatsou and the multi
XXIII throughout my PhD. It goes without saying that her help and advice have been
invaluable. I am also grateful to the EPSRC for funding and the Department of
Chemistry for their facilities.
This PhD journey would have been so much more treacherous and difficult if not for
the company I’ve had in the lab, office and at the tea point. Being surrounded by
friendly and helpful people, both current and former members of the group, has
helped immensely and I feel confident that the friendships forged through polymer
chemistry will last. Not least my car share and training buddies. I shall miss our
commute, our shared exercise goals and our (treacherous) bicycle rides. In particular
I have to specifically thank Dafni and Annie for their ideas and help in the work
carried out in this thesis, two immensely clever, kind and helpful individuals.
The encouragement I have had off my family and friends not only for my PhD but
the route to get to this point has been so important. Knowing that my parents would
support me in my decisions and were so proud at every point during this chemistry
journey has allowed me to get this far. Having a group of friends spanning the
country and world that have put up with my visits has had a large impact on my
enjoyment of the past few years and needs to be mentioned – thank you. I have
massively enjoyed my PhD and would not change a single day of it and that is
XXIV the study of their interactions with 1'1-bi-2-naphthol, J. Polym. Sci. Part A,
2012, 50, 3567-3574. DOI: 10.1002/pola.26141 (Chapter 2)
2) B. L. Moore, A. Lu, D. A. Longbottom and R. K. O’Reilly, Immobilization of
MacMillan catalyst via Controlled Radical Polymerization: Catalytic Activity
and Reuse, Polym. Chem. 2013, 4, 2304-2312, DOI: 10.1039/C3PY21125H
(Chapter 3)
3) B. L. Moore, D. Moatsou, A. Lu, and R. K. O’Reilly, Studying the activity of
the MacMillan catalyst embedded within hydrophobic crosslinked polymeric
nanostructures, Polym. Chem. 2014, DOI:10.1039/C3PY01734F. (Chapter 4)
4) B. L. Moore, A. Lu, D. Moatsou and R. K. O’Reilly, The effect of polymer
nanostructure on diffusion of small molecules using tryptophan as a FRET
XXV
λ Wavelength
1-EPHP 1-ethylpiperdine hypophosphite
AIBN Azo-(bis)-isobutrylnitrile
Ar Aromatic
ATRP atom transfer radical polymerization
CLD crosslinking density
CMC critical micelle concentration
COSY correlation spectroscopy
CRP controlled radical polymerization
CTA chain transfer agent
d Doublet
Da daltons (g mol-1)
DA Diels-Alder
Dav average diameter
DCM Dichloromethane
DEGMA diethylene glycol methylether methacrylate
Dh hydrodynamic radius
DLS dynamic light scattering
DMAC N,N-dimethylacetamide
DMAP Dimethylaminopyridine
DMF dimethyl formamide
XXVI
DOX Doxorubicin
DP degree of polymerization
DSC differential scanning calorimetry
ee enatioselectivity
EGDMA ethylene glycol dimethacrylalte
EMA ethyl methacrylate
eq Equivalents
FRET forster resonance energy transfer
GC gas chromatography
h Hour
HOMO highest occupied molecular orbital
HPLC high performance liquid chromatoraphy
HR ESI-MS
high resolution electron spray ionization mass
spectrometry
Hz Hertz
IP inflection point
IR Infrared
J coupling constant
KPS potassium persulfate
LCST lower critical solution temperature
LUMO lowest occupied molecular orbital
XXVII
min Minute
MMA methyl methacrylate
Mn number average molecular weight
Đ dispersity
mol% mole percent
Mw weight average molecular weight
MW molecular weight
MWCO molecular weight cut off
NaHCO3 sodium hydrogencarbonate
nBuMA nbutyl methacrylate
NFK N-formyl-kynurenine
NiPAM N-isopropylacrylamide
nm nanometer
NMP nitoxide mediated polymerization
NMR nuclear magnetic resonance
PAA poly(acrylic acid)
PDA photodiode array
PEG poly(ethylene glycol)
PMMA poly(methyl methacrylate)
PS poly(styrene)
q Quartet
XXVIII
rt room temperature
s Singlet
SDS sodium dodecyl sulfate
SEC size exclusion chromatography
Snase Staphylococcal
t
Bu tert-butyl
TEA Triethylamine
TEGMA triethylene glycol methylether methacrylate
TEM transmission electron microscopy
Temp Temperature
TFA trifluoroacetic acid
Tg glass transition temperature
THF Tetrahydrofuran
TON turnover number
TTR Transthyretin
UCST upper critical solution temperature
XXIX the polymerization techniques that have been utilized and a background to each of the applications that have been targeted.
In Chapter 2 the synthesis of poly(tryptophan) though a polymeric scaffold synthesized via RAFT polymerization is investigated. Once synthesized, the monomer and polymer, along with previously synthesized poly(phenylalanine), are used for in the chiral resolution experiments of 1,1’-bi-2-napthol.
Chapter 3 focuses on the synthesis of a novel monomer that contains the catalytically active MacMillan catalyst synthesized from L-tyrosine. This enabled immobilization of the MacMillan catalyst into polymers prepared via RAFT polymerization. The monomeric catalyst could then be incorporated into co-polymers at pre-determined specific loadings. These polymers were then used to catalyze the Diels-Alder reaction with great effect and had the ability to be used in a pseudo-continuous process.
Chapter 4 places the monomeric MacMillan catalyst into nanogels synthesized through emulsion polymerization. The effect of having the catalyst within this unique environment was studied both through conversion and selectivity. The relatively simple synthesis allowed for the bespoke environment to be readily changed altering the amount of catalyst and co-monomer of the nanogel.
2
Polymerization Techniques
1.1.1
Reversible-Deactivation Radical Polymerization
A significant development in the synthesis of polymers was the introduction of
reversible-deactivation radical polymerization (RDRP) techniques.1, 2 These
methodologies have allowed for the control of polymer properties whilst using
convenient procedures. Prior to the advent of these routes polymers were synthesized
either by conventional free radical polymerization (CFRP) or living polymerization
(LP).3, 4 CFRP can be used to polymerize most monomers in relatively mild conditions
but permits no control over the polymer structure such as molecular weight (MW) or
dispersity (Đ). LP gives a much greater handle on polymerization control with MW
being controlled by stoichiometry and is capable of achieving low dispersities; however,
LP requires highly stringent conditions in which no impurities can be present, including
oxygen and water.
Whereas with the introduction of RDRP techniques it was possible to maintain the ease
of a free radical synthesis with the control of a living polymerization process.3 These
advances have allowed for synthesis of more complex polymeric structures with control
over MW and dispersity.4 The three most common RDRP techniques are Atom Transfer
Radical Polymerization (ATRP),5, 6 Nitroxide Mediated Polymerization (NMP)7-10 and
Reversible Addition Fragmentation chain Transfer (RAFT)11, 12 polymerization. The
steps common to all RDRP techniques are initiation, propagation, transfer and
3
Scheme 1.1. A schematic representation of the steps of initiation, propagation and termination. I2 is the initiator
and M the monomer.3
Both ATRP and NMP proceed by a reversible activation/deactivation equilibrium in
which the equilibrium lies in favour of the dormant species, reducing the amount of
radicals present and therefore the amount of termination. The use of stable radicals to
control polymerization has its foundations in work by Rizzardo and Moad,8 which was
further refined by Georges.13
The use of transition metals to provide the stable free radical was reported in 1995 by
the groups of Sawamoto,14 Matyjaszewski15, 16 and Percec.17 ATRP requires a transition
metal with a covalent bond capable of reversible fragmentation; commonly with a
halide. The labile halide bond is the key to the process as it forms the dormant polymer
4
Scheme 1.2. A representation of the ATRP process using a transition metal complex (Mt) with a halide (X). 5
The reversible nature of the P-X and the X-Mt formation allows for the radical
concentration to be kept low, reducing termination and slowing the growth resulting in
well defined polymers.
NMP works on the same principle as ATRP but in this case an alkoxyamine initiator is
responsible for the presence of dormant and active radicals. The most commonly used
initiator is 2,2,6,6-tetramethylpiperidinyl-1-oxy (TEMPO) (Figure 1.1) which forms an
unstable carbon-oxygen bond with the growing polymer that will be cleaved thermally
giving a radical terminated polymer that can propagate and a nitroxide free radical.9, 18
The growing polymer chain and the available TEMPO can recombine to produce the
5
Figure 1.1. The structure of TEMPO, a common NMP initiator.18
The mechanism of RAFT differs from ATRP and NMP as it uses a degenerative chain
transfer process, with the propagating chain in equilibrium with the dormant chain. At
the same time that RAFT was reported by a group in Australia,11 a similar
polymerization technique was developed in France known as Macromolecular Design
by Interchange of Xanthates (MADIX).19 The term RAFT is commonly used to describe
these types of polymerization as MADIX limited itself to just the use of xanthates to
control the polymerization whereas RAFT encompasses a range of chain transfer agents
(CTAs). These CTAs are responsible for the control over the polymerization with
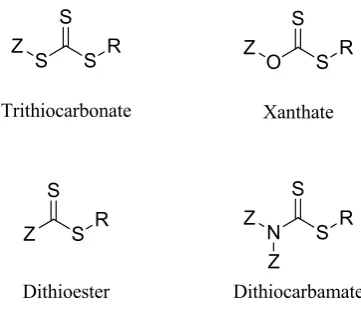
equilibrium between propagating and dormant chains.20-22 The generic families of CTA
can be seen in Figure 1.2.
[image:39.595.227.408.501.656.2]6 The choice of CTA is highly significant to achieve the successful polymerization of
specific monomers. The differing Z and R groups of the CTA can have a significant
impact on its reactivity and therefore need to be tuned to the monomer targeted for
polymerization. The Z group affects the reactivity of the C=S bond towards radical
addition and controls the stability of the fragmentation product20 and the R group must
be capable of forming a free radical leaving group but also to re-initiate
polymerization.21 Therefore the radical formed on the CTA during the polymerization
process must be matched to the reactivity of the radical formed on the growing polymer
chain. Monomers can be split into the two groups of more activated monomer (MAMs)
where the vinyl group is conjugated to a neighbouring functionality, such as a
methacrylate or styrene, and less activated monomers (LAMs) where the vinyl group is
adjacent to an electron rich atom, such as vinyl acetates (Figure 1.3).23
Figure 1.3. The structures of MAMs and LAMs.
LAMs form unstable and highly reactive propagating radicals, as they are not stabilized
through resonance, and therefore the CTA must have a less reactive double bond to
ensure propagation. This can be achieved by using xanthates and dithiocarbamates
which form resonance structures (Figure 1.4) that can stabilize the radical produced. The
7 reactive radicals formed on the MAMs as they have more reactive C=S bonds.24-26
Recently, there has been work to develop a universal CTA that is capable of
polymerizing both MAMs and LAMs.23, 27, 28
Figure 1.4. The resonance structures that can be formed by xanthates and dithiocarbamates which help to stabilize the radical.
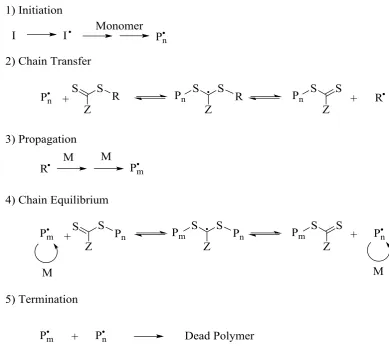
The accepted basic RAFT mechanism can be seen in Figure 1.5. Present are the
processes common to free radical polymerization: initiation, propagation and
termination. However, there are two other important steps associated with RAFT
8
Figure 1.5. The generally accepted mechanism for RAFT polymerization.
Initiation is from an external source, typically azo-(bis)-isobutyronitrile (AIBN), the
radicals of which will either react directly with a CTA or produce oligomers (Pn˙) before
then reacting with the CTA. Ideally, all the CTA will be consumed before propagation
commences. The chain transfer step greatly affects the Đ of the polymer and it is
therefore essential that R˙ is a good homolytic leaving group with respect to Pn˙ to drive
the chain equilibrium towards completion. The propagation step is coupled with the
chain equilibrium so the CTA exchanges between growing polymer chains, keeping the
active radical only present on a particular chain for a short period. The rapid exchange
9 ensuring that chains grow at a similar rate and termination steps are minimized. RAFT
is arguably the most versatile of these three RDRP techniques capable of polymerizing a
wider range of monomers, in a variety of reaction media.32-35 One of the drawbacks of
implementing RAFT is the coloured polymers that it produces but developments in the
10
1.1.2 Heterogeneous and emulsion polymerization
Heterogeneous polymerizations consist of two phases (oil-in-water or water-in-oil) and
are named depending on the nature of the larger, continuous phase. These techniques are
commonly used to prepare well defined polymeric particles.39 There are a number of
types of heterogeneous polymerizations including suspension, precipitation, dispersion
and emulsion.40 The characteristics of the polymerizations are usually identified by the
solubility of the monomer, resulting polymer and initiator. With suspension
polymerization, the monomer and initiator are insoluble within the continuous phase
and monomer droplets are formed which are stabilized by a surfactant. Initiation occurs
within the monomer droplet and the resulting polymer particle will have a particle size
similar to that of the initial monomer droplet.41 Particles across a wide size spectrum
from 20 µm to 2 mm have been synthesized using this technique. In both precipitation
and dispersion polymerization, the initiator and monomer are soluble in the continuous
phase with the resulting polymer insoluble.40, 42 They differ as the growing polymer
particle is stabilized in a dispersion polymerization43 whereas in the precipitation
process the resulting polymer precipitates out of solution.39 Both systems form much
smaller particles compared to suspension polymerization with particles around 0.1 µm
11 With emulsion polymerization the initiator is soluble in the continuous phase, the
monomer sparingly soluble and the resulting polymer insoluble.44, 45 Smith, Ewart and
Harkins established a mechanism for emulsion polymerization in the 1940s, the steps of
which can be seen in Figure 1.6.46, 47
Figure 1.6. A representation of the synthetic process for emulsion polymerization.40
Initially the monomer forms large droplets stabilized by the surfactant in the aqueous
phase. Additionally, excess surfactants will form micelles that may contain a few
monomer units. Typically there are high numbers of surfactant micelles which are much
smaller in size giving a high surface-to-volume ratio compared to the monomer droplets.
As the initiator is soluble in the continuous phase, the polymerization is initiated here
with the few monomer units present in the continuous phase. The polymer (or oligomer)
chain grows until it becomes so hydrophobic that it must enter the surfactant micelle
stabilizing it in the continuous phase. The polymer (or oligomer) continues to propagate
within the surfactant micelle and additional monomer units from the monomer droplets
will diffuse into the micelle and this process continues until the monomer droplet is
12 well-defined polymeric particles. The high conversion obtained by this polymerization
is advantageous as removal of unreacted monomer is not required. However, excess
surfactant not involved in particle stabilization may have to be removed. Additionally,
cross-linker can be added to this polymerization producing more robust cross-linked
particles which have improved stability to temperature, solvent and dilution compared to
13
1.2 Amino Acids in Polymers and Structures
1.1.2
Amino acid monomers
A variety of amino acids have been incorporated into polymers in recent years through
the synthesis of bespoke monomers typically resulting in (meth)acrylamide
monomers.48-50 Polymers incorporating amino acids in this way have received great
interest due to their potential use in a range of applications given their bio-compatible
and stimuli responsive nature.51-54 The groups of Endo and Mori have led the research
on the development of these monomers and incorporation into polymers, both through
conventional and RDRP techniques.50 The typical synthesis of amino acid containing
monomers uses (meth)acryloyl chloride in a coupling reaction with the desired amino
acid to yield the corresponding (meth)acrylamide monomer; this synthetic route can be
seen in Scheme 1.3. Since the report by Sanda et al. in 1997 where this synthetic route
was used to yield the monomeric equivalents of leucine, alanaine, phenylalanine,
glutamic acid, methioine and tyrosine55 the same procedure has been used to synthesize
other amino acid monomers including histidine,56 proline57, 58 and tryptophan.59-62
14 The synthesis of poly(amino acids) has not just been constrained to monomers
synthesized via this route as illustrated in the review by Sanda and Endo.50 Figure 1.7 is
a reproduction from their review of the synthetic routes available to poly(amino acids)
which includes ring opening polymerization and polycondensation along with the
[image:48.595.120.520.253.587.2]radical techniques utilized within this thesis.
15
1.2.2 Polymeric structures incorporating amino acids
One of the primary reasons that amino acids are targeted as monomers is due to their
natural chirality which, through incorporation into polymeric structures, can be
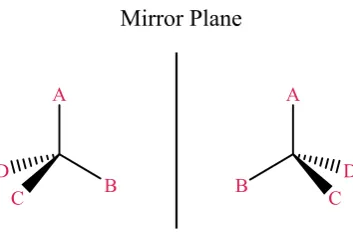
exploited.49 Chirality occurs when a molecule is asymmetric, which typically happens
with the positioning of groups around a tetrahedral carbon atom. With reference to
Figure 1.8 it is possible for two arrangements in a tetrahedral structure with four
different groups; the two structures are mirror images and are non-superimposable, each
possible formation is termed an enantiomer.63 Enantiomers are indistinguishable, apart
from their interactions with other chiral molecules and the direction they rotate plane
[image:49.595.230.407.403.519.2]polarized light.
Figure 1.8. A representation of two enantiomers based on a tetrahedral carbon atom.
The different enantiomers of a chiral molecule are generally referred to as (S)- or (R)-
which is based on the Cahn-Ingold-Prelog priority rules which label the groups in order
of priority based on atomic weight.64, 65 By placing the lowest priority group at the back,
the other priorities will decrease in either a clockwise (R)- or anti-clockwise (S)-
fashion. The labelling of (R)- and (S)- comes from the Latin terms for right and left
16 Another labelling method is also available and particularly prevalent with amino acids,
which is based on how the enantiomers rotate plane polarized light. As the light passes
through a solution of one enantiomer it will either rotate the polarized light clockwise
(dextrorotary) or anti-clockwise (levorotary) which gives rise to the terminology of D-
and L- enantiomers. This terminology still predominates for amino acids with all
naturally occurring amino acids present in the L- configuration. The two naming
systems are not related with the labelling of (R)- and (S)- having no connection to the
way an enantiomer will rotate the plane polarized light.
There are multiple examples of amino acid containing polymers that have been
exploited for their properties, one of which is their inherent chirality. There have been
several investigations on how this chirality is affected in the polymer. One such study
utilized the enantiomers of the amino acid leucine to synthesize chiral micelle
structures; formed from either a mixture of D and L leucine polymers or from single
enantiomer polymers.66 The micelles containing both enantiomers exhibited increased
stability which was assigned to stereocomplexation within the core between the
different enantiomers, this interaction has also been reported by Endo.67 A
representation of this work can be seen in Figure 1.9. Leucine's specific rotation has also
been studied when it has been present in the polymeric form, Endo and co-workers
17
Figure 1.9. A reproduction of an overview of the differing stabilities afforded from mixtures of chiral leucine polymers.66
The pH responsive nature of amino acids is another reason that they have been targeted
for polymer incorporation.69-71 Assembled structures based on phenylalanine have been
shown to change morphology depending on the pH that they have been assembled at
due to the differing ratio of hydrophobic to hydrophilic segments.72 The pH
responsiveness of a tryptophan containing polymer has also been examined with
polymers forming assembled structures at pH values of 6.0, but on reducing the pH to
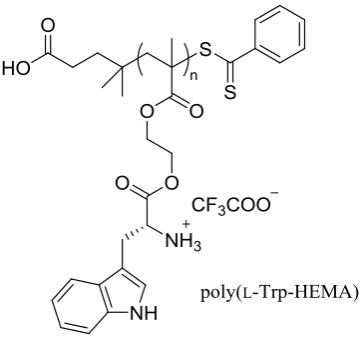
4.0 only the corresponding unimers were present in solution.60 The structure for this
pH-responsive tryptophan polymer can be seen in Figure 1.10.
18 This pH-responsiveness has sometimes also been coupled with the bio-compatibility of
the poly(amino acids) as targets for drug carrying devices.73 Both polymers of
tryptophan and alanine have been investigated for their bio-compatibility.60, 74 In Figure
1.11 the fluorescence microscopy images of HeLa cells in presence of a
poly(tryptophan) can be seen; in the presence of the polymer the cells behave in a
similar manner to the control sample and therefore the polymer has had a negligible
cytotoxicity effect.60
Figure 1.11. A reproduction of the fluorescence microscopy images that were used in alongside other data to demonstrate the negligible cytotoxicity effect of poly(tryptophan).60
Other characteristics of amino acids have also been exploited with their incorporation
into polymeric structures. It has often been noted that lower critical solution
temperatures (LCSTs) can be altered through incorporation of amino acids.51, 75-77
Additionally tryptophan’s fluorescent properties have often been targeted60, 61 and have
been the focus of research in Chapter 5. Their ability in enantiomer separations and
19
1.3 Enantiomer Resolution
The chirality of a molecule has many implications and from an application point of view
these are notable with interactions with any biological compounds. As amino acids and
sugars are chiral the resulting higher order structures of peptides, proteins and
polysaccharides share this chirality and therefore has to be a consideration in the
development of drugs, agrochemicals, food additives, flavourings and fragrances.78, 79
As greater understanding of the role of chirality has been developed, the requirements
for optically pure compounds has become more rigorous; for instance the US Food and
Drug Administration (FDA) require the effects of both enantiomers and their mixtures
before a patent for new drugs can be granted.78, 80 Therefore research into producing one
enantiomer of a desired molecule has flourished but the need for chiral separation still
remains. At early stages of development of new compounds with specific required
characteristics the design and implementation of synthetic routes to achieve a single
enantiomer could be costly and time consuming; one of the reasons that the research
into chiral separation has continued.78 There are two methods available for chiral
separation: formation of chiral auxiliaries and separation based on non-covalent
interactions. Chiral auxiliaries require the chemical modification of the enantiomers into
diastereoisomers which can then be separated out based on their chemical or physical
differences, such as through crystallization.81 The second method has a much wider
scope with non-covalent diastereoisomers formed with a stationary phase through
intermolecular interactions such as hydrogen bonding or π – π stacking.78 Molecularly
imprinted polymers (MIP), chiral polymers, and cyclodextrins have been at the forefront
20 There has been extensive use of cyclodextrins for separation of compounds; both chiral
and achiral. Their unique structure allows for the formation of inclusion compounds
based on hydrophobicity, shape and size which are parameters that can be exploited for
compound separation.82 Their frustum shape gives a hydrophobic interior whilst the
compound itself is hydrophilic and chiral. The chemical structure of cyclodextrins and
their unique 3D shape can be seen in Figure 1.12.83
Figure 1.12. A reproduction of a representation of the chemical and 3D structure of cyclodextrins.83
They have had success for chiral resolutions in both gas chromatography (GC) and high
performance liquid chromatography (HPLC). One of the first reports of use of
β-cyclodextrins for HPLC separation was in 1985 by Armstrong and co-workers.84 They
prepared an HPLC column by covalently attaching β-cyclodextrin to silica which was
then able to resolve a range of molecules including derivatives of amino acids and
barbiturates. In 1998 this group also demonstrated how a range of cyclodextrin based
columns could resolve a variety of enantiomers and could detect as low as 0.1%
enantiomer impurity using HPLC.85 In 1988 Zukowski et al. demonstrated how
immobilized and functionalized β-cyclodextrins could be used for chiral separation in a
21 MIPs have also received attention for their ability to separate out enantiomers. These
constructs are synthesized by templating a polymer around an enantiomer of interest
which yields MIP with greater affinity for the template enantiomer over the other,
enabling separation.87 A typical route to the production of a MIP through a covalent
imprinted approach can be seen in Figure 1.13. This methodology has been developed
by Wulff who used species that contained both the template and the polymerizable
group; after co-polymerization with a cross-linker the template is chemically removed
leaving a cavity with a specific size and shape.88 An overview of MIP materials used for
resolution has been given in a review by Maier and Lindner.87
Figure 1.13. A reproduction of a representation of how templating is used to form MIPs.87
MIPs have been used for a variety of chiral separations including chiral drugs such as
β-blockers and anti-inflammatory drugs with high levels of success, these, along with
others, have been outlined comprehensively in a review by Ansell.89
Whilst these two previously mentioned routes have received the most attention, there
have been reports of other chiral polymers that also exhibit enantiomer resolution type
characteristics. These polymers include poly(amides), poly(urethanes) and
poly(saccharides) and their ability to separate out enantiomers has been outlined by
22 these chiral polymers it has been possible to separate out enantiomers in HPLC set ups.
Additionally chiral polymers synthesized from amino acids have also been used for
enantiomer separation and resolution. For instance unique chiral hydrophobic domains
have been prepared through the self-assembly of micelles based on an L-phenylalanine
hydrophobic block.91 These constructs have shown some chiral resolution ability when
incubated with a racemic solution of small molecule phenylalanine. Similarly, gel
structures based on the amino acid L-alanine have also been shown to provide a route to
enhanced enantiomer concentrations of the amino acid proline.92 Polymers containing
the amino acid tryptophan have chiral recognition ability with the molecule 1,
1’-bi-2-naphthol (BINOL), an important chiral catalyst precursor, which is discussed in detail in
Chapter 2.59 A schematic demonstrating the change in the 1H NMR spectrum of (rac
)-BINOL on exposure to poly(L-tryptophan) can be seen in Scheme 1.4; the phenolic
proton peaks are shifted downfield and split. This chiral resolution ability with BINOL
was extended by De and co-workers as they examined a polymer of leucine in a similar
fashion.93
23
1.4 Catalysis
1.4.1 Immobilized Catalysts
The immobilization of catalysts has received significant attention. Underlying the
immobilization is the desire to reclaim and reuse the catalyst as they can often be
difficult, expensive, toxic and time consuming to prepare.94-96 Therefore, being able to
produce more products from the initial input is a desirable characteristic. Immobilizing
catalysts can be seen as a way of bridging the gap between heterogeneous catalysts,
which typically are easily removed from reactions, and homogeneous catalysts, which
whilst normally less expensive and less toxic are difficult to retrieve.97 Through
immobilization it has been possible to carry out catalysis in the homogeneous phase but
through exploitation of polymeric structures, the catalyst is easier to retrieve after
catalysis.
Amino acids have also been targeted for their catalytic properties, both for when
catalysis is carried out by the amino acid and when the amino acid acts as metal catalyst
ligands. Proline has been immobilized into polymeric supports by a number of groups57,
58
and used for catalysis reactions which have given impressive results (low mol%
loading, high selectivity) and with recycling potential.98 One such immobilization was
carried out by Kristensen et al. in which the catalyst proline was immobilized into either
benzyl methacrylate or styrenic beads (Figure 1.14).58 These were then used to catalyze