MASTER’S
THESIS
Dynamic Three-Dimensional Resource
Space Allocation in a Multi-Item Inventory
Environment
A research into three-dimensional resource space allocation in the Self-Serve Furniture Area and Warehouse department of the local warehouse store of the IKEA Group in Hengelo, Overijssel.
Author:
T.J. Bemthuis
Supervisors:
Dr. P.C. Schuur
Dr. ir. S. Hoekstra
T. Wieffer
M. Martin
A thesis submitted in fulfillment of the requirements
for the degree of Master of Science
in
Industrial Engineering and Management
”The most dangerous poison is the feeling of achievement. The antidote is to every evening think what can be done better tomorrow.”
Ingvar Kamprad
COLOFON
Document
Master’s thesis
Version
Online
Title
Dynamic Three-Dimensional Resource Space Allocation in a Multi-Item Inventory Environment
Description
A research into three-dimensional resource space allocation in the Self-Serve Furniture Area and Warehouse department of the local warehouse store of the IKEA Group in Hengelo, Overijssel.
Keyterms
Logistics, warehouse, warehousing, resource allocation, knapsack problem, 1D-BPP, 3D-BPP, rack-ing
Author
T.J. Bemthuis
Studentnumber
Not available online
Not available online
University
University of Twente
Faculty
Faculty of Behavioral, Management and Social sciences
Master Program
Industrial Engineering and Management
Specialisation
Production and Logistics Management
Mailing Address
Postbus 217 7500 AE Enschede
Website
Graduation Committee
Dr. P.C. Schuur
University of Twente
Dr. ir. S. Hoekstra
University of Twente
T. Wieffer
IKEA Hengelo
M. Martin
IKEA Hengelo
Date of Publication
29 March 2019
Disclaimer
The sources used in this thesis are either cited or mentioned behind, or in, the stated text, image or table. When assumptions are made, these assumptions are explicitly mentioned. When information is used from confidential sources, this information is changed or withdrawn in the online published version, such that this information is only available within the company and educational institute and confidentially is ensured. When information is changed or withdrawn from the online version, it is explicitly mentioned. If it is not mentioned, no information is changed or withdrawn and the online version is the same as the offline version.
Copyright
©T.J. Bemthuis, the Netherlands
Management Summary
Retail selling space is a finite resource that requires frequent decision making about which items to stock and how much space to allocate to these items. The product allocation does not only influence the perceptibility, demand and sales revenue of certain products, it also influences various costs, ergonomics and safety restrictions. The division of this finite amount of retail space is an important decision within an IKEA store. The stores do not purely offer a shopping experience for the visitors, they also operate as a warehouse, where products are received, inventory is held and orders are handled. Currently there are 13 stores operational within the Netherlands, of which one store in Hen-gelo, Overijssel. The general store layout consists of a Showroom, Markethall, Self-Service Furniture Area (SSFA) and Warehouse (WH). The SSFA and WH departments show similar characteristics as a general warehouse, from the storage of products in racking, to order picking services. Since the opening of the store in Hengelo, the amount of flow through the SSFA and WH departments in-creased significantly. Furthermore, it is forecasted that this amount of flow will increase even further. The amount of available retail selling space (or Stock Keeping Area (SKA)) in these departments stays the same, resulting in that the current usage of the SKA is not in line with the expected growth in customer demand. This research focuses on increasing the efficiency of the SKA allocation, within the SSFA and WH departments of the store in Hengelo, Overijssel.
Research Objective
The subject of this thesis is the dynamic allocation of the resource space (SKA) among a set of Stock Keeping Units (SKUs), in which the three-dimensional characteristics of both the SKA, and the SKUs are taken into account to create an efficient solution. The research objective is defined as follows:
To develop an efficient, adaptive and generic approach of SKA allocation, within the racking sec-tions of the SSFA and WH departments.
The research objective is three-fold and the objectives are mutually dependent. First the SKA al-location needs to be efficient. Secondly, the alal-location needs to be adaptive, such that changes in product range and resources can be included. Finally, the allocation needs to be generic, such that it can be applied to different stores settings.
Method
The developed method is based on the existing goods allocation process and incorporates safety and ergonomic restrictions. Furthermore, it is designed such that it is beneficial to a set of defined Key Performance Indicators (KPIs), namely to the internal damages, handling rate, Customer Ser-vice Level (CSL) and fast picking operations. The model is based on the principles of the bin packing problem. The resources can be seen as a set of finite bins, with three-dimensional characteristics. In the regular bin packing problem, these bins are infinite and have identical sizes. In the scope
partments the resources are finite, not always identical and, therefore, can have different sizes. The restriction that only identical products are allowed to be placed upon and behind each other, makes it possible that the height and length dimension of the products can be used as a selection criterion for the racking. In this way, the three-dimensional problem is reduced to a one-dimensional problem and the different bin sizes are incorporated with the use of the selection criteria.
A heuristic is designed to obtain the right SKU dimensions to allocate. This heuristic makes use of the dynamic character of product allocation, whereby boxes can be placed upon, behind and next to each other. In every allocation step the resources are checked if the dimensions fit and afterwards the SKU is allocated according to one-dimensional bin packing problem approximate approaches.
Safety restrictions are implemented with the use of adaptive slack variables per resource. This slack includes slack between SKUs, between SKUs and uprights and between SKUs and sprinklers. This slack is also, together with the correct allocation, beneficial to preventing internal damages. Further-more, the products can be placed according to demand rate, such that fast moving articles are placed closer to the output. The one-dimensional bin packing problem has the goal to place the SKUs in as few resources as possible, therefore increasing the utilization of the resources. In other words, it increases the amount of SKUs that can be allocated within the SKA, therefore increasing the CSL and reducing the buffer movements and handling rate.
Results
The model is programmed into a stand alone executable software program. The outcomes are val-idated, verified and benchmarked against the manual SKA allocation within the WH. In this manual allocation the safety restrictions are not fully implemented and not all products are allocated accord-ing to allocation principles. The model provides an allocation rate of 92.7% of the SKUs currently assigned to the sales locations within the WH and a racking occupation of 81.1%. The model indi-cates a lack of level 00 locations and an overflow of level 10 locations, resulting in 7.3% not allocated products. Furthermore, the allocation time is reduced from a few hours to a few minutes.
Recommendations
The developed model provides insight into the allocation process. It is a complement to, not a substi-tute of, the current goods allocation process. The model and study face limitations due to its scope and time window. The output of the model, in combination with the limitations of this research, result in recommendations for further research. The recommendations are summarized below and are both practical, as theoretical based.
• Update the racking layout. The model output indicates a mismatch in location types. Additional level 00 locations can be created by cannibalizing the overflow of level 10 locations. This canni-balization can increase the product allocation rate to 95.1% (+2.4%) and the racking occupation to 87.7% (+6.6%)
• Further verification and implementation of the model. The model is currently benchmarked against the WH allocation. This benchmark can be extended to the SSFA and other store settings. Furthermore, a frequent usage of the model is recommended, in order to obtain the benefits of the model to their fullest.
Preface
In the autumn of 2018, I began to see the final horizon of my masters. This horizon implies the end of an era, an era which I look back at with great pleasure and nostalgia. At long last, all good things come to an end. Fortunately, an ending is always the beginning of something new. I believe that, within every individual, there is an opportunity and a sense of responsibility to turn these new realities into something special. It goes without doubt that I would like to take on that challenge.
To reach this final horizon of my masters, I had the opportunity to conduct my graduation thesis at theIKEA Group. I’m proud to cordially present you this thesis, which marks the end of my time as anIndustrial Engineering and Management student at theUniversity of Twenteand the beginning of my career as an industrial engineer. This report includes not merely the technical results of my work, but also breathes the joy and spirit which I felt throughout my entire internship period.
This leap to the final horizon was not possible without the persons who gave me the opportunity to do so. First I want to thank all my fellow co-workers ofIKEA Hengelo, with a special word of grati-tude to all the employees within the logistics department. The open culture, guidance and expertise made it possible for me to complete this thesis and work on it with a big smile. Next, I would like to thankThijs Wieffer andKimberly Kruizefor granting me this opportunity. My special thanks goes to
Thijs, who served as my main supervisor, for his expertise, open mind and feedback. Furthermore, I want to thankMarlene Martin for her supervision, time and guidance. I had a great time atIKEA
and enjoyed working in the logistics department, the activities and, of course, theIKEAfamily and culture. At the university, I had the honor to be supervised byPeter Schuur andSipke Hoekstra. I want to thank them both for their constructive feedback, suggestions and open minds. Without the great input from all these people this thesis would not have been possible. I am glad to have had the opportunity to work with all of them.
With the horizon in sight, I look back at the great opportunities that were given. TheUniversity of Twenteenabled me to learn, grow and obtain experiences, throughout my bachelor’s and master’s degree periods. During my time at the university, I met a lot of inspiring and interesting people, from all over the world, with all sorts of different backgrounds. I enjoyed the open minds and diversity of my fellow students, which made it a pleasure to work and laugh with them during lectures, projects, excursions and association meetings. People to never forget. I would like to conclude with the words ofIngvar Kamprad, the founder ofIKEA: ”Most things still remain to be done. Glorious future!”.
Thijs Bemthuis
Enschede, March 2019
Contents
Management Summary vii
Preface ix
List of Figures xiv
List of Tables xv
List of Abbreviations xvii
1 Introduction 1
1.1 Company Introduction . . . 1
1.1.1 Design, Range and Supply . . . 2
1.1.2 Production and Sourcing . . . 3
1.2 Warehouse Store Introduction . . . 3
1.2.1 Warehouse Stores Within the Netherlands . . . 3
1.2.2 Local Warehouse Store . . . 4
1.2.3 Store Layout . . . 4
1.2.4 Capacity . . . 6
1.3 Problem Context . . . 8
1.3.1 Background . . . 8
1.3.2 Problem Identification . . . 9
1.4 Research Design . . . 11
1.4.1 Demarcation . . . 11
1.4.2 Research Objectives . . . 12
1.4.3 Research Contribution . . . 12
1.4.4 Research Questions . . . 13
1.5 Structure of the Report . . . 15
2 Context Analysis 17 2.1 The Logistic Flow . . . 17
2.1.1 The Supply Chain . . . 17
2.2 SKA Allocation Within SSFA and WH Departments . . . 19
2.2.1 Analysis, Planning and Dimensioning the Warehouse . . . 20
2.2.2 Safety and Ergonomic Restrictions . . . 22
2.2.3 Allocation Process and Maintaining . . . 24
2.3 Key Performance Indicators . . . 24
2.4 Upcoming Strategic Changes . . . 26
2.5 Conclusion . . . 27
3 Literature Review 29
3.1 Inventory Storage in Warehouses . . . 31
3.1.1 Storage Process Policies . . . 31
3.1.2 Optimization Methods . . . 32
3.2 Packing Problems . . . 33
3.3 Conclusion . . . 34
4 Model Design 37 4.1 Development Methodology . . . 37
4.2 Requirements . . . 38
4.3 Designing . . . 39
4.3.1 Business Logic . . . 39
4.3.2 Graphical User Interface . . . 47
4.3.3 Input Data . . . 48
4.4 Coding . . . 48
4.4.1 Subprograms . . . 48
4.5 Testing . . . 53
4.5.1 Testing of Functionalities . . . 53
4.5.2 Program Verification . . . 54
4.5.3 Data Analysis . . . 55
4.5.4 Model Performance . . . 56
4.6 Integration . . . 59
4.7 Conclusion . . . 60
5 Conclusions and Recommendations 61 5.1 Conclusions . . . 61
5.2 Recommendations . . . 62
5.2.1 Change of Racking Layout . . . 62
5.2.2 Other Recommendations . . . 66
References 69
Appendices
A In-store Logistics 73
B Forecasting Methodology 75
C Safety Stock Calculations 77
D Racking Types 79
E Sprinkler Zones 81
F Program Layout 83
G Input Data 85
H Flowcharts 87
List of Figures
1.1 IKEA stores worldwide, amended from the IKEA Group yearly summary Financial Year
(FY)17 [1] . . . 2
1.2 Floorplan IKEA Hengelo . . . 4
1.3 Showroom (SR) of IKEA Hengelo . . . 5
1.4 Markethall (MH) of IKEA Hengelo . . . 5
1.5 SSFA of IKEA Hengelo . . . 5
1.6 WH of IKEA Hengelo . . . 6
1.7 Racking locations of IKEA Hengelo . . . 7
1.8 Forecasted sales volume . . . 8
1.9 Structure of the report . . . 15
2.1 IKEA Supply Chain . . . 18
2.2 Product allocation process . . . 19
2.3 Suggested range sequence according to Common Store Planning (CSP) . . . 21
2.4 Suggested product sequence according to CSP . . . 21
2.5 The basic division curve of articles between the SSFA and WH . . . 22
2.6 Sprinkler locations within the racking level 10 . . . 23
2.7 Transverse channels within the racking levels . . . 23
2.8 Damage due to products (mattresses) located at wrong level. . . 25
2.9 Damage due to products placed to close to each other. . . 25
3.1 Visualization of literature study terminology . . . 30
3.2 Typical value distribution of SKUs [2] . . . 31
3.3 Two-dimensional single bin filling [3] . . . 33
3.4 Three-dimensional single bin filling [3] . . . 33
3.5 The Three-dimensional Bin Packing Problem (3D-BPP), Two-Dimensional Bin Packing Problem (2D-BPP) and One-Dimensional Bin Packing Problem (1D-BPP) . . . 35
4.1 The waterfall method, phases according to Thayer et al. [4] . . . 37
4.2 Dimensions finding principle . . . 39
4.3 Allocated SKU dimensions in racking . . . 40
4.4 Customerpack dimensions to allocate . . . 41
4.5 Multipack dimensions to allocate . . . 41
4.6 Heavy customerpack dimensions to allocate . . . 41
4.7 Pallet dimensions to allocate . . . 42
4.8 Pallet dimensions (with extra height) to allocate . . . 42
4.9 Mattress pallet dimensions to allocate . . . 43
4.10 Mattress pallet dimensions (with extra customerpack length) to allocate . . . 43
4.11 Mattress pallet dimensions (with extra customerpack height) to allocate . . . 44
4.12 Mattress customerpack dimensions to allocate . . . 44
4.13 The 1D-BPP principle . . . 44
4.14 The defined racking areas within the WH . . . 45
4.15 Safety restrictions and internal damages . . . 46
4.16 The designed Graphical User Interface (GUI) . . . 47
4.17 Nested sorting flow chart . . . 49
4.18 New dimensions heuristic . . . 50
4.19 Resource selecting heuristic . . . 52
4.20 Model visualization output of racking 69-05-04 . . . 54
4.21 Model visualization output of racking 49-24/25/26-00 . . . 54
4.22 Model visualization output of racking 47-19/20/21-00 . . . 54
4.23 Model visualization output of racking 49-10/11-15 . . . 54
4.24 Flowtype pallet deliveries . . . 56
4.25 Product allocation per allocation type . . . 57
4.26 Not allocated products weight division . . . 58
4.27 Not allocated products width, height and length box plots (AT = 0) . . . 58
4.28 Not allocated products width, height and length box plots (AT = 1) . . . 58
4.29 Racking occupation . . . 59
4.30 Not occupied racking width, height and length box plots . . . 59
4.31 Difficult to allocate SKU . . . 60
5.1 Level 10 cannibalization . . . 62
5.2 Not allocated products box plots per length segment (AT=0) . . . 63
5.3 Not allocated products box plots per length segment (AT=1) . . . 63
5.4 Weight histogram products allocated to buffer . . . 65
5.5 Racking occupation of modified racking set test . . . 65
5.6 A simulation of business processes in Siemens Plant Simulation, retrieved from Be-mthuis [5] . . . 66
5.7 Product damage due to racking framework . . . 67
5.8 Product damage due to lack of barrier . . . 67
List of Tables
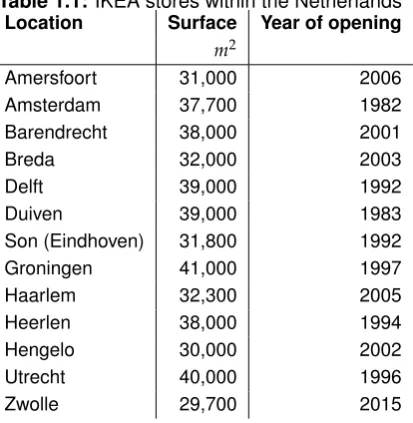
1.1 IKEA stores within the Netherlands . . . 3
1.2 Home Furniture Businesses . . . 4
1.3 SKA per department . . . 6
1.4 Needed capacity per department, by scenario of XXm3product flow . . . 10
4.1 Program of requirements . . . 38
4.2 Testing of requirements . . . 53
4.3 Racking available width . . . 56
4.4 SKU necessary width . . . 56
4.5 Model output bechmark test . . . 57
4.6 Performance of other settings . . . 59
5.1 Level 10 locations that can be cannibalized to level 00 . . . 63
5.2 Model output modified racking set . . . 64
List of Abbreviations
1D-BPP One-Dimensional Bin Packing Problem. xiii, xiv, 33, 35, 40, 44, 45, 50, 51
2D-BPP Two-Dimensional Bin Packing Problem. xiii, 33, 35
3D-BPP Three-dimensional Bin Packing Problem. xiii, 33, 35, 60
APQC American Productivity & Quality Center. 29
BF Best-Fit. 34
BFD Best-Fit Decreasing. 34
CCSBP Class Constrained Shelf Bin Packing Problem. 34
CEO Chief Executive Officer. 26
CP Customerpack. 56–58, 63
CSL Customer Service Level. vii, viii, 8, 9, 26, 27, 34, 38, 45
CSP Common Store Planning. xiii, 20–22
DC Distribution Center. 3, 11, 17, 18, 26, 27
DD Direct Deliveries. 18, 27
EDS End Date Sales. 24
ELF European Low Flow. 18, 27
EP Euro Pallet. 41
FF First-Fit. 34
FFD First-Fit Decreasing. 34
FPL Full Pallet Load. 24
FTL Full Truck Load. 17
FY Financial Year. xiii, 1, 2, 6, 9
GDP Gross Domestic Product. 29
GUI Graphical User Interface. xiv, 39, 47, 48
HFB Home Furniture Business. 4, 5, 20, 24, 34
IoS Ikea of Sweden. 2
KPI Key Performance Indicator. vii, 11–13, 17, 24, 27, 34, 38, 45, 47, 53, 67
MH Markethall. xiii, 4–6, 9, 10, 20
MP Multipack. 57, 58
NF Next-Fit. 34
NFD Next-Fit Decreasing. 34
SKA Stock Keeping Area. vii, viii, xi, xv, 6, 8–14, 17, 19, 21–24, 26, 27, 29, 30, 34, 38, 39, 45, 46, 60, 61
SKU Stock Keeping Unit. vii, viii, xiii–xv, 6, 12, 18, 22, 23, 26, 30–32, 34, 35, 38–42, 44–46, 49–51, 54, 56–61, 64, 67
SLM Sales Location Management. 24
SOP Standard Operating Procedures. 22
SR Showroom. xiii, 4–6, 10, 20
SS Safety Stock. 29
SSFA Self-Service Furniture Area. vii, viii, xi, xiii, 4–6, 8–13, 17, 19–24, 26, 27, 29, 30, 38, 45, 61, 66
VR Virtual Reality. 26
Chapter 1
Introduction
In the framework of completing my master’s degree inIndustrial Engineering and Managementat the
University of Twente, I conducted my graduation project atthe IKEA Group. This research focuses on the store location ofthe IKEA GroupinHengelo, Overijssel. The whole process from the production of raw materials to the finished product in the living room of the end customer implies a complex supply chain. A part of this supply chain is the distribution of products through the local warehouse stores ofthe IKEA Group. With this complexity comes challenges for increasing efficiency and im-provements in customer service.
This chapter provides an introduction to this research. Section 1.1 introducesthe IKEA Group, fo-cusing on both the national and international context of the company. Subsequently, Section 1.2 introduces the local warehouse store inHengelo, Overijssel. Section 1.3 contains the problem iden-tification, in which we identify and state the problem addressed in this research. Section 1.4 contains the research design, including the research objective, scope, questions and approach. Finally, Sec-tion 1.5 concludes this chapter with the structure and motivaSec-tion of the remaining part of this thesis.
1.1
Company Introduction
The IKEA Group is a global home furniture company and was originally founded in 1943 [6]. The name ”IKEA” is an acronym formed from the founder’s initials (Ingvar Kamprad), the first letters of the farm he grew up in (Elmtaryd) and his hometown in Smland, southern Sweden (Agunnaryd) [6]. The IKEA Group consist of a group of companies (Ingka Holding B.V. and its controlled entities) that are owned by the Stichting Ingka foundation [7]. Ingka Holding B.V. is one of the 11 franchisees and it exploits the IKEA warehouse stores through franchise agreements with Inter IKEA Systems B.V., the owner of the IKEA concept and the worldwide franchisor of IKEA [8] (Section 1.1.1). Inter IKEA Sys-tems B.V. is owned by the Inter IKEA Group, which operates independent from the IKEA Group [8].
Over the Financial Year (FY) 2017 the group registered 817 million store visits worldwide [1]. In total these visits generated a part of the total revenue of 36.3 billion euro’s, from which 2.5 billion euro’s net profit [1]. The group employed a total of 149.000 co-workers, from which 134.400 in retail, 9.100 in distribution, 2.100 in shoppingcentres and 3.400 in other occupations [1]. Every year the IKEA product range is renewed with (approximately) 2.500 products, which sums up to a total of (approximately) 9.500 products in the IKEA range [1].
At the end of the FY17 the IKEA Group operated 355 IKEA stores in 29 countries [8]. Furthermore, it operated 24 pick-up and order points, 43 shopping centers, 31 store distribution sites and 26 customer distribution sites worldwide [9] (Figure 1.1).
Figure 1.1:IKEA stores worldwide, amended from the IKEA Group yearly summary FY17 [1]
1.1.1
Design, Range and Supply
Design, range and supply are part of the main occupations of the Inter IKEA Group [10]. Further-more, the focus lies on franchise operations and industry. The franchise operations are located in the Netherlands, the range operations in Sweden and the supply operations in Switzerland [10]. Most of the industry activities are based in Poland [10].
Inter IKEA systems B.V. is a part of the Inter IKEA Group and is owner of the IKEA concept and worldwide IKEA franchisor [10]. It develops the IKEA concept and implements it in new and existing markets [10]. Currently, the IKEA concept is being reviewed with regard to reestablishing different aspects to align multichannel retailing [10] (see Chapter 2). Moreover, Inter IKEA B.V. is occupied with defining a new strategy which will focus on three main areas: health and sustainable living, be-coming circular and climate positive, and contributing to a fair and equal society [10].
The range and supply business of the Inter IKEA Group is responsible for developing and supply-ing the global IKEA range [10]. This includes activities within the whole value chain, from supplier to customer [10]. Within these activities also Ikea of Sweden (IoS) AB, IKEA Supply AG, IKEA Commu-nications AB, IKEA Food Services AB and related businesses are involved [10].
1.2. WAREHOUSESTOREINTRODUCTION 3
the owner of the goods within the Distribution Centers (DCs) worldwide [10]. Overall there are 24 purchase and logistic service offices to support external suppliers [10]. IKEA Communications AB is the communication agency that creates and produces IKEA communication for customers and other IKEA organizations, e.g. the IKEA catalogue [10]. IKEA Food Services AB develops the food and beverages product range sold in the IKEA restaurants, cafes, bistros and Swedish food markets in the IKEA stores [10].
1.1.2
Production and Sourcing
The industry business of the Inter IKEA Group focuses on manufacturing the IKEA home furnishing products [10]. In total, it produces approximately 10 to 12% of the total IKEA range. The main focus lies on furniture, in which it is the (self proclaimed) largest producer in the world [10]. The operations are conducted through 40 production sides, including forestry, sawmills and production of board material, wood components and ready furniture [10]. These production units are located in China, France, Hungary, Lithuania, Poland, Portugal, Russia, Slovakia, Sweden and the USA [11]. The remaining products of the IKEA range are supplied by (approximately) 1.000 external home furnishing suppliers in 51 countries [10]. About 20% of products are shipped directly from the suppliers to the IKEA stores [12], the rest through a DC.
1.2
Warehouse Store Introduction
Within this research, we focus on the IKEA Group within the Netherlands, with a more narrow focus on the warehouse store location in Hengelo, Overijssel. In Section 1.2.1 we first introduce the different store locations in the Netherlands and briefly highlight the history of IKEA within the Netherlands. Afterwards we define the store location in Hengelo in Section 1.2.2.
[image:21.595.326.533.499.711.2]1.2.1
Warehouse Stores Within the Netherlands
Table 1.1:IKEA stores within the Netherlands
Location Surface Year of opening
m2
Amersfoort 31,000 2006
Amsterdam 37,700 1982
Barendrecht 38,000 2001
Breda 32,000 2003
Delft 39,000 1992
Duiven 39,000 1983
Son (Eindhoven) 31,800 1992
Groningen 41,000 1997
Haarlem 32,300 2005
Heerlen 38,000 1994
Hengelo 30,000 2002
Utrecht 40,000 1996
Zwolle 29,700 2015
1.2.2
Local Warehouse Store
Table 1.2:Home Furniture Businesses HFB group Products Categories
01 Living room
02 Store and organise furniture
03 Work spaces
04 Bedroom furniture 05 Beds and Mattresses
06 Bathroom
07 Kitchen
08 Dining
09 Children
10 Lighting and home decor 11 Bed and Bath Textiles
12 Home Textiles
13 Rugs
14 Cooking
15 Eating
16 Decoration
17 Oudoor
18 Home Organisation 19 Secondary Storage 20 Other Business Opportunities
92 Family
The warehouse store in Hengelo opened in 2002 (see Table 1.1). It is located in the north of Hengelo, in the shopping area ”Plein Westermaat”, nearby the motorway A1 and close to the Dutch-German bor-der. Due to the location of the store, the ma-jority of the visitors come from both the Nether-lands and Germany. Ten years after the open-ing of the store, the store increased their cus-tomer service with the built of a parking garage and increased their parking capacity with 650 places [13]. Furthermore, at the same time, they started to increase their floor capacity with almost 4000
m2 [13] to (approximately) 30.000 m2 (see Table 1.1).
The warehouse store is divided into different depart-ments, namely the Showroom (SR), Markethall (MH), Self-Service Furniture Area (SSFA) and Warehouse (WH). Within these sections different areas are located based on product categories, or ”Bubbles”. A product category is called a Home Furniture Business (HFB). A list of the HFB groups can be found in Table 1.2.
1.2.3
Store Layout
In the previous section we defined the different departments within the IKEA store. These different departments have an important influence in the layout of the store, since products are located ac-cording to the HFB groups (see Table 1.2). Figure 1.2 shows the floor plan of IKEA Hengelo, as available for the customers visiting the store. The figure shows that the different HFB groups are categorized in sections within each department, except for the SSFA.
1.2. WAREHOUSESTOREINTRODUCTION 5
The Showroom (SR)
Figure 1.3:SR of IKEA Hengelo On the first floor of the store the SR is located.
[image:23.595.320.523.302.454.2]The SR is the first sales area the visitor enters, when entering the store according to the floor plan (Figure 1.2). Within the SR the range of IKEA furniture and furnishing accessories are represented. It enables customers to see the products of IKEA displayed. Afterwards the products can be picked up in the SSFA or be or-dered online. Examples of HFB groups that are represented here are 01 (living room), 03 (work spaces) and 07 (Kitchen) (Table 1.2). A visual example of the SR of IKEA Hengelo is given in Figure 1.3.
The Markethall (MH)
Figure 1.4:MH of IKEA Hengelo The MH is located on the ground floor of the
store and is entered by the visitor after leaving the SR (according to the floor plan (Figure 1.2)). The MH is similar to the SR, except the products located in the MH are more accessories, instead of furniture. The products can be picked directly or be ordered online. An example of the MH de-partment of IKEA Hengelo is given in Figure 1.4.
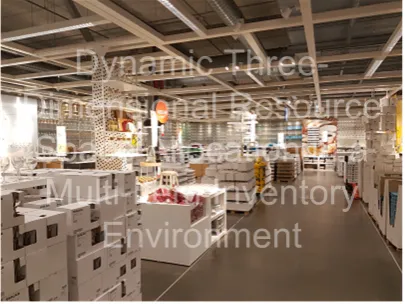
The Self Service Furniture Area (SSFA)
Figure 1.5:SSFA of IKEA Hengelo The SSFA is located on the ground floor and is
entered by the visitor after leaving the MH. The SSFA is a sales area, in which the full height of the building is used to get maximum efficiency for storage, display and availability. The SSFA enables visitors to pick-up products that were displayed in the SR or MH. Furthermore, a small range of products are displayed that enable vis-itors to see the products of IKEA. Figure 1.5 shows an example of the SSFA of IKEA Hen-gelo. The idea of the SSFA was originally cre-ated in the 1960s. Large volumes of customers caused long lines at the merchandise pick-up
The Warehouse (WH)
Figure 1.6:WH of IKEA Hengelo The WH is a department that is not accessible
to visitors. The WH is located in the same area as the SSFA, but separated by flexible gates that can be removed. Furthermore, the WH is connected to the docking, forklift charging area and merchandise pick-up area, such that it can be operational during opening hours and visitors are not bothered. Figure 1.6 shows an example of the WH department of IKEA Hengelo. The general store layout of the SSFA and WH de-partments is further outlined in Chapter 2.
[image:24.595.349.498.352.655.2]1.2.4
Capacity
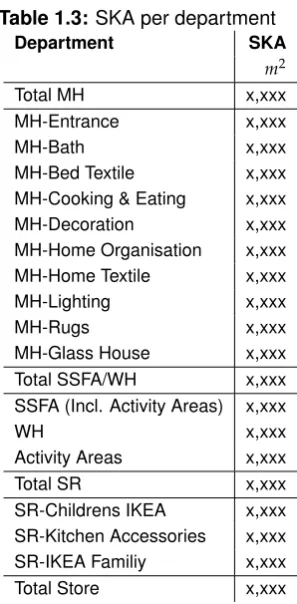
Table 1.3:SKA per department
Department SKA
m2
Total MH x,xxx
MH-Entrance x,xxx
MH-Bath x,xxx
MH-Bed Textile x,xxx MH-Cooking & Eating x,xxx MH-Decoration x,xxx MH-Home Organisation x,xxx MH-Home Textile x,xxx MH-Lighting x,xxx
MH-Rugs x,xxx
MH-Glass House x,xxx Total SSFA/WH x,xxx SSFA (Incl. Activity Areas) x,xxx
WH x,xxx
Activity Areas x,xxx
Total SR x,xxx
SR-Childrens IKEA x,xxx SR-Kitchen Accessories x,xxx SR-IKEA Familiy x,xxx Total Store x,xxx
Capacity is an important aspect within the IKEA sup-ply chain. The IKEA concept is based on selling large volumes of products and making them available to cus-tomers at the lowest possible price. The total space capacity of an individual IKEA store has an impor-tant impact on the inventory allocation within the supply chain.
Since the opening of the warehouse store in Hengelo in 2002, the sales turnover grow significantly from (roughly) XX million euro’s in the FY02 to (roughly) XX million euro’s in the FY18. In 2002 the original floor space concerned (approx.) 26.500m2.
This includes the floor space of all the different departments and walking areas within the store. In 2013 the floor space increased to (approx.) 30.000m2. This additional floor space contribute primarily to the SR and MH departments, the floor space of the SSFA and WH did not increased by this upgrade. The actual space used for storing Stock Keeping Units (SKUs), the so-called Stock Keeping Area (SKA), is only a part of the total floor space. The SKA per department is shown in Table 1.3.
1.2. WAREHOUSESTOREINTRODUCTION 7
1.3
Problem Context
This section provides the context analysis of the problem studied in this thesis. In Section 1.3.1 the background of the problem is discussed and explained. Consecutively, in Section 1.3.2 the actual problem is identified and discussed. From this problem identification a concrete problem statement is subtracted and formulated.
1.3.1
Background
Figure 1.8:Forecasted sales volume In Section 1.2.2 it is explained that over
the last decade the sales turnover is in-creased from roughly XX million euro’s to roughly XX million euro’s (approximately XX% increase). This increasing sales turnover (in euro’s) is correlated to the increasing sales volume (measured in m3) and, there-fore, to the corresponding product flow through the warehouse store. For the upcom-ing years it is forecasted that the sales volume will increase further (see Figure 1.8).
As addressed in Section 1.2.2, the capacity of the local warehouse store is divided into differ-ent departmdiffer-ents. Since the original opening of
the warehouse store in 2002, the floor space of the SSFA and WH departments is not increased. The product flow through the SSFA and WH is increased in correlation with the increased sales turnover. Within the SSFA products are located that customers can pick themselves. The available space to place products within the SSFA is limited. When the demand of a product per day is higher than the available space to place this particular number of products (within the SKA), it causes out-of-stock options and a reduced Customer Service Level (CSL). During customer hours it is not possible to shift products from the storage locations to the picking locations within the SSFA (Figure 1.7), due to safety restrictions.
Products within the WH are not accessable for customers, but are collected by employees. The time this collection takes is increased when products are not located on the floor picking locations, but instead need to be picked from the buffer locations. As mentioned before, within the WH it is possible to move products from the buffer to the floor locations during opening hours, nevertheless the buffer locations are also limited and out-of-stock options can occur. Furthermore, longer picking times imply longer waiting times for customers and a reduced customer service. Efficient usage of the SKA is necessary to cope with this increasing sales volume in a fixed SKA availability. Moreover, efficient SKA usage implies benefits for both the customers, as the local warehouse store. Efficient usage of the SKA implies:
• A better availability and a higher customer satisfaction. It can result in fewer non-central short-ages, because more weeks of stock can be hold upon store level.
1.3. PROBLEMCONTEXT 9
• Lower prices for IKEA customers. A positive bottom line can have a positive effect on the costs that can results in lower prices for the IKEA customers.
• Lower supply chain costs. An efficient SKA result in fewer shortages, that reduces extra and shortage deliveries.
• More sales. Less shortages implies more sales.
• An improved home delivery and picking with delivery services. A faster and more efficient operation for external partners and customers.
An important notice that has to be made is that, according to the IKEA group, a lack of storage space does not always mean extra capacity is required. Shortage locations can sometimes be rationalized.
Capacity Determination and Allocation
Within the IKEA store a special sales-to-range-to-space tool is used to determine the right amount of space requirements (inm2) per department to meet the expected sales volume (inm3), as forecasted (Figure 1.8). Furthermore, the size of each sales area within an IKEA store is determined by the forecasted sales space need for every product sold (see Chapter 2 and Appendix A).
Products are allocated according to their size and selling volume. Furthermore, the allocation of products is subjected to the dimensions of the sales location. The best-selling furniture products are allocated to the SSFA to make them more accessible. Within the SSFA there are special locations that are appropriate for selling large volumes. For example, the end of aisles, including end podia, and the activity area (see Appendix A for more details). Within the SSFA this allocating best-selling product to easily accessible sales locations is used and can also be applied to the MH department. In Chapter 2 the allocation principles are further outlined. The in-store logistics and sales space determination are discussed in Appendix A.
1.3.2
Problem Identification
In the previous sections we introduced the local warehouse store and the available capacity within the store. Although that since the opening of the store in 2002 the floor space within the SSFA and WH is not increased, the sales turnover increased significantly. This increased sales turnover resulted in an increased product flow through the warehouse store and the corresponding departments. This flow is measured inm3as explained in Section 1.3.1. This flow inm3corresponds with a space required
inm2(SKA), which differs per department and department section. Table 1.4 shows the current SKA, the corresponding SKA needed as forecasted till FY22 (see Figure 1.8, based on XXm3flow) and
We define a problem as a situation in which there is a discrepancy between the desired situation (norm) and the actual situation (reality) [14]. From Table 1.4 we can see that it is forecasted that there would be a lack of SKA within the warehouse store. If we look further within this problem, we see that this lack is mainly located within the SSFA and WH departments. This is a clear problem, in which in the desired situation this lack of SKA is not present. Due to the long-term implementations it is currently not desirable to extend this SKA with new to build capacity. The focus lies on a short-term solution, that can increase the efficiency of the SKA usage and reduce the amount of SKA needed to meet the expected customer demand. Therefore can reduce or resolve the problem and the cor-responding effects to the customers. We define the problem statement below.
Problem statement:The current usage of the SKA, within the SSFA and WH departments, is not in line with the expected growth in customer demand.
As explained above, the problem focuses on two specific departments within the warehouse store, namely the SSFA and WH departments. Furthermore, the focus lies on the current usage of the SKA and does not include extending the SKA. In the next section this problem statement is further operationalized and the research design is outlined.
Table 1.4:Needed capacity per department, by scenario of XXm3product flow
Department Actual floor Space Space needed Lack/surplus
(by XXm3flow)
m2 m2 m2
Total MH x,xxx x,xxx x,xxx
MH-Entrance x,xxx x,xxx x,xxx
MH-Bath x,xxx x,xxx x,xxx
MH-Bed Textile x,xxx x,xxx x,xxx
MH-Cooking & Eating x,xxx x,xxx x,xxx
MH-Decoration x,xxx x,xxx x,xxx
MH-Home Organisation x,xxx x,xxx x,xxx
MH-Home Textile x,xxx x,xxx x,xxx
MH-Lighting x,xxx x,xxx x,xxx
MH-Rugs x,xxx x,xxx x,xxx
MH-Glass House x,xxx x,xxx x,xxx
Total SSFA/WH x,xxx x,xxx x,xxx
SSFA (Incl. Activity Areas) x,xxx x,xxx x,xxx
WH x,xxx x,xxx x,xxx
Activity Areas x,xxx x,xxx x,xxx
Total SR x,xxx x,xxx x,xxx
SR-Childrens IKEA x,xxx x,xxx x,xxx
SR-Kitchen Accessories x,xxx x,xxx x,xxx
SR-IKEA Familiy x,xxx x,xxx x,xxx
1.4. RESEARCHDESIGN 11
1.4
Research Design
This section outlines the design of this research. In Section 1.4.1 the scope of this research is demarcated, building upon the demarcation made within the problem statement. Consecutively, in Section 1.4.2 the research objectives are outlined, followed by the research contribution in Section 1.4.3. Finally, in Section 1.4.4 the research questions, and the methodology used to answer them, are outlined and discussed.
1.4.1
Demarcation
In the previous sections the scope is already partly defined. To cope with the complexity of this study, we define the boundaries in more detail in this section. This demarcation is based on the preliminary research, the problem context and the input of stakeholders. Although some aspects are not within the scope of this research, these still can be mentioned within this thesis and the further recommen-dations, nevertheless no extensive research is done upon these aspects.
Although the supply chain of IKEA is an factor to notice within this research, we do not focus on the supply chain processes of the IKEA Group and Inter IKEA Group (i.e. production facilities and DCs), but only address them briefly. For the aim of this research we focus on the supply chain part that directly affects the local warehouse store, as explained in Section 1.2.2, since the internal logis-tics within the store are the main focus of this research. More specifically, we demarcate our scope even further to the specific SSFA and WH departments within the store. Since these departments are interlinked with the other departments, we also briefly address the other departments and overall store picture. Within the SSFA and WH we focus on the racking sections and not on the activity areas and end podiums, due to the complexity of the resource allocation within these sections. Further-more, the other departments and sections are not explicitly mentioned and are not part of the solution we provide.
For the local warehouse store it is of importance that the customers are the main target of inter-est. All possible solutions should be in line with the needs of the (potential) customer. Therefore, we also need to include the needs of the customer to be able to define a potential solution. However, due to time limitations, it is not realistic to do an extensive customer research. For that reason, we focus on previous conducted research and the Key Performance Indicators (KPIs) of the local warehouse store, that are subjected to the needs of the customer. Next to the view of the customers, the view of the employees are also taken into account within this research. In the end, the employees should be able to adapt the solution. Therefore, we include the view and opinions of the dedicated employees within our research scope.
Within the IKEA range every year several products are changed and becoming obsolete (approxi-mately 2.500 items annually, see Section 1.1). This changing range is important to meet the chancing customer’s needs. Furthermore, the demand of the customers is stochastic. Within this research we do not explicitly focus on this chancing range and stochastic demand, but we implement it as a part of the solution.
1.4.2
Research Objectives
The objective of this research is to create a solution in line with the defined problem statement, as discussed in Section 1.3.2. Furthermore, in the research objective several aspects are important to include within its scope, as demarcated in the previous section (Section 1.4.1). First the solution should be able to achieve an efficient SKA usage within the racking of the SSFA and WH depart-ments. Secondly, the solution should be adaptive and needs to be able to include the stochastic behaviour of the product demand, the changing range of products and the opinion of employees. Thirdly and finally, the solution should be able to provide insight into the performance of the SKA in relation to different allocation configurations. The three defined aspects are mutual dependent. In other words, an efficient SKA usage is dependent on including the stochastic behaviour, product range changes and employees’ opinions. Furthermore, the evaluation of the efficiency of different strategies is dependent on the design of the strategies. We formulate the research objective below.
Research objective: To develop an efficient, adaptive and generic approach of SKA allocation, within the racking sections of the SSFA and WH departments.
Within the research objective the scope is explicitly demarcated. (1) First we look at an adaptive and generic way of SKA allocation. The model should be adaptive and generic in the sense that the model should be applicable in all similar store settings. A warehouse store in another city should be able to use the model in the same way as the local warehouse store in subject. The model should be adaptive, i.e. store specific settings should be able to be set and the model should be generic, i.e. applicable for similar store settings. (2) Furthermore, the objective specifically looks at the SKA allocation within the SSFA and WH departments. (3) The current SKA allocation method is unknown and has first to be defined in order to look for inefficiencies and potential improvements. The focus on increasing efficiency is based on increasing the SKA utilization and KPI values. The current situ-ation, including the current allocation methodology, restrictions and important KPIs are discussed in Chapter 2.
1.4.3
Research Contribution
1.4. RESEARCHDESIGN 13
1.4.4
Research Questions
In Section 1.4.2 we defined and explained our research objective. This research objective includes different aspects, which need to be researched in order to obtain a potential solution for the defined problem statement. Within the explanation of the research objective, we defined several research topics. To reach our objective, we composed a succession of research questions which we have to answer. The main research question is the leading theme of this research and can be answered through answering the several research questions. These research questions are defined in a logical sequence of activities, which covers the entire scope of this project.
The questions are defined into four main parts, namely (i) mapping of the current situation (context analysis), (ii) analyzing of the current situation and identification of opportunities based on litera-ture (literalitera-ture review), (iii) creation and validation of a solution based on the identified opportunities (model design and validation) and (iv) implementation plan. Since the implementation of the solution is, due to time limitations, without the scope of this research, we also include an implementation plan. With the introduction of every question a short description is given, based on the planned approach of answering and the motivation for the question.
We have formulated the main research question below.
Main research question:How should an adaptive and generic SKA allocation method be designed, such that it provides an efficient SKA usage within the racking sections of the SSFA and WH depart-ments?
The main research question is in line with the defined research objective and includes the demar-cated scope, as discussed in Section 1.4.1. The main research question is answered with the use of the sequence of research questions, as discussed above.
(i) Context Analysis
To get more insight in the current way of working within the local warehouse store, with a explic-itly focus on the material handling from the arriving of products till the purchase by the customer, a thorough analysis of the current way of working is needed. Within this part we familiarize ourselves with the existing logistic processes within the store and potential future changes. Furthermore, we go more in depth into the characteristics of the SKA within the scope departments and identify the corresponding KPIs. Our approach of answering this question consists of examining documents from the IKEA group and the local warehouse store. Besides that, we conduct interviews with employees to obtain additional information and to ensure validity of our documentation. Furthermore, we con-duct field research to obtain the correct characteristics of the scope departments. The first research question is defined below.
Research Question 1: How are the logistic flows, processes and information flows currently or-ganized?
a) What are the characteristics of the distribution network and the internal material handling?
b) What are the characteristics of the SSFA and WH departments, including the SKA allocation?
(ii) Literature Review
The literature review provides the theoretical framework for this research. Research question 1 pro-vides the context analysis of the current situation. After the current situation is known, literature is used to get familiar with existing methods to find possibilities for improvements, within the current sit-uation. The literature study focuses on the SKA allocation methods and strategies within comparable settings and situations. In this literature review we focus on both peer-reviewed scientific articles (i.e. journal papers), as also on books, newspapers and other relevant articles, that include relevant liter-ature. We start the literature review with an investigation about what is currently known in literature about SKA allocation, whereby we focus on other similar settings and the correlation to our situation. Next, we combine the results from the literature review with the results from research question 1, and look into the methodology that is most suitable for our specific case. The second and third research question is defined below.
Research Question 2: What is currently known in literature about SKA allocation? a) How is the SKA allocation executed in comparable settings?
b) How can those SKA allocation methods be used in correlation to the local warehouse store in subject?
Research Question 3: What kind of SKA allocation method is most suitable for this research?
(iii) Model Design and Validation
After we have studied the available literature and combined it with the context analysis, we start de-signing the actual model based on the opportunities found. This research question is answered with the use of a combination of literature review and expert input. This ensures that we design a valid and robust model, which is implementable and provides benefits for the customers and employees of the local warehouse store. First, we need to select a design framework which we can use for structuring the model design. Afterwards, the actual model can be designed and validated. Research question four, five and six are defined below.
Research Question 4: What methodology design framework should be used for the model design?
Research Question 5: How should the model be designed to support the efficiency of SKA uti-lization?
Research Question 6: How can the designed model be verified and validated?
(iv) Implementation
The implementation of the model is, due to time limitations, out of the scope of this research. Nev-ertheless, it is important that correct documentation is provided to support the implementation of the model in practise. The implementation plan that can be used to implement the model in different store settings and situations. The last research question is defined below.
1.5. STRUCTURE OF THEREPORT 15
1.5
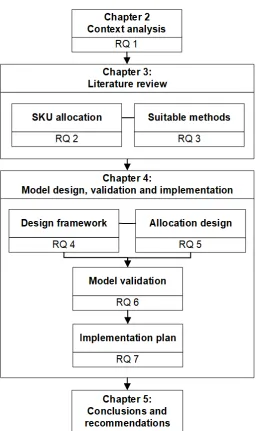
Structure of the Report
[image:33.595.185.443.256.688.2]The structure of this report is divided into the different sections, as explained in the previous section, namely: (i) context analysis, (ii) literature review, (iii) model design and validation and (iv) implemen-tation plan. Within this report these sections are presented in a chronological sequence, whereby in Chapter 2 the context analysis is given and the answer to the corresponding research question. In Chapter 3 the literature study is given and in Chapter 4 the design, validation and implementation plan of the model is presented. This research is concluded in Chapter 5, with the conclusions of this research and recommendations for further research. Figure 1.9 shows a graphical representation of the structure of this report.
Chapter 2
Context Analysis
This chapter provides the context analysis of the current situation within the local warehouse store, with regards to the scope of this research. Section 2.1 covers an overview of the logistic flow, from the production to the end customer. The in-store logistics and material handling is further outlined in Appendix A. Section 2.2 provides the characteristics of the SSFA and WH departments, in which the focus lies on the SKA allocation process. In Section 2.3 the corresponding KPIs, as apply to the departments in subject, are discussed. Section 2.4 outlines the upcoming changes of the IKEA Group, based on strategy and vision. Finally, Section 2.5 concludes this chapter and provides a concluding answer to research question 1.
2.1
The Logistic Flow
This section focuses on the logistic flows from the production to the end customer, with a focus on the logistics within the IKEA store. Section 2.1.1 starts with a global overview of the supply chain of an IKEA store, with the focus on the different distributions methods, from the production to the end customer and the flows through the local IKEA store. In Appendix A we focus more specifically within the supply chain and provide an in-depth analysis of the in-store logistics of the IKEA store, from the ordering of products to the arriving of products at the customer.
2.1.1
The Supply Chain
The supply chain of IKEA is a network of facilities that are owned and operated by IKEA or by IKEA business partners, e.g. factories, DCs and stores. The processes within the supply chain are interdependent activities performed and shared by the organizations within the supply chain, including, but not limited to, activities within:
• sales planning and forecasting
• ordering
• delivering and handling goods
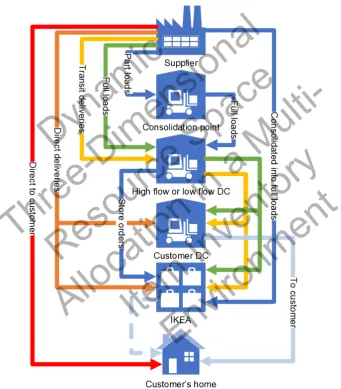
The supply chain of IKEA can be seen as a multi-echelon system, since it makes use of several stock points within its flow from supplier (central location of the production) to the different warehouse stores. Consolidation points enable part loads from suppliers to merge into Full Truck Loads (FTLs). This enables benefits of scale and reduces the impact for the environment.
In the previous chapter it is discussed that IKEA has own production facilities, but also makes use of more than 1.000 suppliers within 51 countries. To manage this amount of suppliers, IKEA makes use of high-flow and low-flow DCs. The low-flow range is stored centrally for large regions, while the high-flow range is stored in centers closer to the relevant market [15]. The high-flow focuses on the 20 percent of SKUs that account for 80 percent of the volume, low-flow warehouses are more manual. The European Low Flow (ELF) is located in Dortmund (Germany). These DCs supply the customer DCs and the IKEA stores. Furthermore, the IKEA stores receive Direct Deliveries (DD) from the supplier, in which the products are not distributed though one of the DCs. An example of DD are shipments of large high-flow cabinets (The ”PAX” range), that come directly from the supplier in Poland. Consolidated flows are also considered as DD, although some storage may exists a the consolidation points. If a supplier is not available to meet the DD, one of the DCs could provide this demand if inventory is sufficient at that echelon. Large customer orders can also be directly delivered from the supplier to the customer. A simplified overview of the supply chain of IKEA is given in Figure 2.1. The different colors, and corresponding text, represent different shipping methods.
2.2. SKA ALLOCATIONWITHINSSFAANDWH DEPARTMENTS 19
2.2
SKA Allocation Within SSFA and WH Departments
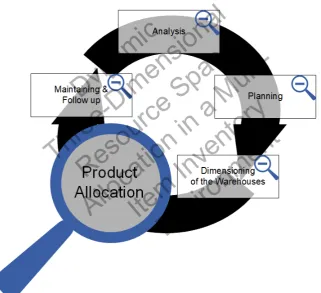
SKA allocation within the SSFA and WH departments is an entire process, whereby goods can be assigned, adjusted or un-assigned to a certain SKA. The way the SKA allocation is done differs per store and depends on store specific characteristics and complexity. Within the IKEA Group an allocation process is defined based on knowledge of IKEA co-workers. This process can be divided into five different stages (Figure 2.2). Within this thesis we focus on the actual product allocation part and only briefly discuss the other parts. Product allocation within the SSFA and WH departments has multiple goals, namely:
• Enabling large sales volumes and low costs in all fields.
• Enabling customer involvement (within SSFA) to keep prices low.
• Maximizing the product availability, while minimizing the logistical costs.
• Reducing product handling and internal damages.
• Creating a balance between an efficient picking process and an easy customers’ buying pro-cess.
[image:37.595.157.479.421.714.2]In Section 2.2.1 we outline the first three steps of the process, namely analysis, planning and dimen-sioning the warehouse. Subsequently, we define the safety and ergonomic restrictions in Section 2.2.2, whereby afterwards we outline the actual allocation and maintaining process in Section 2.2.3.
2.2.1
Analysis, Planning and Dimensioning the Warehouse
The first step in the allocation process is the analysis of the current and mid to long term planning of the store. This includes research on, but not limited to, the needs of the customers in the local mar-ket, commercial agenda, seasonal activities, global and country business plans, market developing and multichannel strategies. In other words, this means analysis on what you want to sell, how much and when. For the upcoming years the IKEA Group announced strategical changes, we outline these changes Section 2.4. We do not go further into detail of the analysis part of the product allocation process, since this part is set as fixed and out of the scope of this research.
The second step in the allocation process is the planning where to place groups of products. This phase has an important effect on the customers’ buying process, internal damages, picking opera-tions, SSFA and WH division, and overall goods flow. Decisions have to be made in what sequence, and where, the ranges and products are going to be allocated.
Range Sequence
The layout of the SR and MH departments are based on HFB groups (Chapter 1). In the SSFA and WH departments the layout is not singly based on these HFB groups, because the shopping behav-ior is different in comparison with the SR and MH departments. In the SSFA the customers often have a picking list that help their buying process. Within the range sequences the HFB groups and commercial combinations are kept together as much as possible, in order to support the easy-buying process for the customers. This means that product combinations that are often bought together are also located close to each other, although the products are different HFB groups.
The Common Store Planning (CSP) provides general principles for the range sequence, the local warehouse store in subject follows these principles. The store and organize furniture is placed in the beginning of the SSFA, to secure a location close to the goods receiving area. This increases the efficiency of replenishment. Bulky and heavy products (e.g. system wardrobes and sofas) are located closer to the cash lines, in order to increase the easy-buying process. Smaller HFB groups (e.g. IKEA children’s range) are placed to the right of the customer flow, since they do not require a lot of warehouse space. Furthermore, some products are restricted to certain racking because of their size. The CSP provides a XL-aisle for long items, e.g. the PAX-range. The allocation of a product range within the same aisle increases the picking efficiency of these products for both the customers, as for the employees. The other areas are intended to be flexible, to react on peak and off-season periods. An example of the product range sequence according to the CSP can be found in Figure 2.3.
Product Sequence
2.2. SKA ALLOCATIONWITHINSSFAANDWH DEPARTMENTS 21
Figure 2.3:Suggested range sequence according to CSP
[image:39.595.127.497.411.661.2]Dimensioning the Warehouse
The layout of the IKEA stores are set by the IKEA standard layout principles. This includes the sizes of activity areas, the width of the aisles and the several racking possibilities. It is all documented in the Standard Operating Procedures (SOP). This layout is further out of the scope of this research. The SSFA stocks the best selling part of the IKEA furniture range. The general rule within the IKEA stores is that at least 75% of the furniture sales volume is allocated to the SSFA department (often this is set to at least 80%). The other items, so called slow(er)-movers, are allocated to the WH department and can be collected by the customers at the merchandise pick-up point. The article density in the WH is therefore higher, generally speaking the division between the SSFA and WH department based on article numbers is approximately 50/50. Figure 2.5 shows an example of the basis decision curve of SKA allocation. It can be seen that the fast(er) moving articles are located into the SKA of the SSFA and the slow(er) movers to the SKA of the WH, whereby approx. 80% of the total turnover in pieces is located into the SSFA, corresponding to approx. 50% of the total number of articles. The division is store specific and depends on what is most favorable for the store. The only requirement is that a majority of the IKEA stores total furniture sales in pieces are available to visitors in the SSFA, in order to keep the prices and costs low.
Figure 2.5:The basic division curve of articles between the SSFA and WH
2.2.2
Safety and Ergonomic Restrictions
Safety and ergonomic restrictions are key aspects within the determination of SKA allocation. The products differ in weight, size and therefore the difficulty of handling. The customers and co-workers are therefore important stakeholders within the allocation of the products. Within the CSP a maxi-mum weight of 15 kg is set for products placed on level 10 and upwards. Furthermore, a maximaxi-mum gripping height of 185 cm is set.
Next to the ergonomic restrictions, there are multiple safety restrictions within the product alloca-tion process. Next to the width of the aisles, escape routes and other safety restricalloca-tions there are also restrictions within the racking. These restrictions are subjected to fire legislation and can be summarized into four main points, as defined below.
2.2. SKA ALLOCATIONWITHINSSFAANDWH DEPARTMENTS 23
height of 15 centimeters from the sprinklers (Figure 2.6 and 2.7). This rule makes sure that the sprinkler water is distributed freely among the entire racking section.
• Around the uprights there is at least 7.5 centimeters of free space at both sides (including the upright itself) in order to create a transverse channel (Figure 2.6 and 2.7)
• At level 10 there is at least 15 centimeters of free space between the back to back sections in order to create a transverse channel (Figure 2.7). This transverse channel needs to be in one line within a racking. Note that at the floor level (level 00) back to back placing is possible.
[image:41.595.143.483.314.714.2]• At both level 00 and 10 there need to be transverse channels around packages or stables of SKUs longer than 150 centimeters (which are stabled as one solid piece, straight upon each other). These transverse channels need to be placed at a maximum of 150 centimers within a racking section (Figure 2.7). Further the occasional irregular spaces, planned or unplanned, will function as flue space. Appendix E shows the sprinkler restrictions in more detail.
Figure 2.6:Sprinkler locations within the racking level 10
2.2.3
Allocation Process and Maintaining
There are several ways of SKA allocation, but due to the complexity and multiple variables that need to be taken into account, a manual expertise is favorable. The most common method for SKA allocation is divided into 11 steps and outlined below. This method is amended from the product allocation guidelines of the IKEA Group. Nonidentical products are only allowed to be placed next to each other, so not on top or behind each other.
1. Create a list of all items that need to be allocated, except for items that have past the End Date Sales (EDS) and have a stock of zero.
2. Identify all the items that already have a fixed location.
3. Identify the SKA dimensions.
4. Identify articles that are non-DC pick. These are articles that are only sent on a Full Pallet Load (FPL), such that at least a FPL SKA is preferable.
5. Identify the ergonomic characteristics of each item (Section 2.2.2) and identify the items that are over the weight limit.
6. Identify large, oversized and other items that are subject to a higher risk of damage.
7. Determine what range allocation is best suitable to fit the large and oversized articles, in order to create an efficient picking operation and easy buying process.
8. Identify the dimensions of the pallets of the articles, if the articles need to be loaded with a pallet and how much articles are on a pallet.
9. Identify required sales space quantity per product.
10. Allocate the articles per HFB, keep families together (when possible) and allocate the best selling articles first, such that lower selling articles are more likely to be allocated on level 10 locations.
11. Allocate fast moving closer to the aisles within the SSFA department and closer to the pick-up desk in the WH department;
Every week the forecasts are updated within the Sales Location Management (SLM) tool (Appendix A). These forecasts updates correspond to a recommended sales space capacity. In order to achieve sufficient inventory on the floor, the space capacities need to be maintained. Furthermore, the com-mercial aspects (including activities and EDS), shopping behavior, introduction of new products and damages need to be taken into account in maintaining the product allocation.
2.3
Key Performance Indicators
The KPIs are important factors to follow up on the performance of the SKA allocation. Within the IKEA store several KPIs are used to identify and follow up on the performance of the store. We identify four KPIs that are a direct indicator on the performance of the SKA allocation.
2.3. KEYPERFORMANCEINDICATORS 25
Figure 2.8:Damage due to products (mattresses) located at wrong level.
[image:43.595.133.493.428.699.2]• CSL: The CSL is a function of different indicators. The first indicator is the order fill rate. The order fill rate is the fraction of the total customer demand that is met from stock. The stock out rate is the complement of the fill rate and is the fraction of sales lost due to stock out. The SKA per SKU should have enough space to meet the customer demand, in order to obtain a high CSL and no loss sales. An article that oversales could require a bigger sales location. Local local shortage could occur if articles are allocated to a not large enough SKA.
• Handling: High handling number could indicate that articles are not located to a correct SKA, resulting in a need to replenish these articles more frequently, resulting in higher costs. Also within the handling the direct flow rates (and therefore also backflow rates) are included. The goal for both the SSFA and WH department is a direct flow of at least 75 %.
• Fast picking: The order picking within the WH department has the goal to be picked within four minutes, plus one minute for every extra product, after accepting the order to be picked by an employee.
2.4
Upcoming Strategic Changes
IKEA stores are operating in a dynamic market. Every year new products are added to their product range and old products are removed from it. IKEA continuously renew their products to keep up with customer demand, create new demand and keep up with the latest trends. Like the product range of IKEA, also the whole home furniture market is dynamic. On the holding level transformations of the business model are announced [16], to keep up with the latest changes in the market. The Chief Executive Officer (CEO) of IKEA has promised a radical change in response to the changing shop-ping habits of the customers and the shift towards online shopshop-ping [16]. The upcoming three-year strategy of IKEA includes full digital solutions in all countries, including home delivery options at ”an affordable price” and the move from out-of-town stores to stores within city centers [16]. Within the IKEA strategy this is announced as services that make it easier for people to bring home, care for and pass on products [17]. Next, IKEA also explores the ideas of loaning furniture to customers instead of selling it, using Virtual Reality (VR) to help customers plan their home interiors and other kind of store formats [16]. Furthermore, the strategy focuses more on sustainability and a positive impact to the society, whereby it aims, e.g., to achieve zero emission home deliveries by 2025 and becoming climate positive [17].
![Figure 1.1: IKEA stores worldwide, amended from the IKEA Group yearly summary FY17 [1]](https://thumb-us.123doks.com/thumbv2/123dok_us/9598459.463169/20.595.69.500.135.394/figure-ikea-stores-worldwide-amended-group-yearly-summary.webp)