warwick.ac.uk/lib-publications
Original citation:Crafts, N. F. R.. (2015) UK economic growth since 2010 : is it as bad as it seems? National Institute Economic Review, Volume 231 (Number 1). R17-R29.
Permanent WRAP URL:
http://wrap.warwick.ac.uk/66288
Copyright and reuse:
The Warwick Research Archive Portal (WRAP) makes this work by researchers of the University of Warwick available open access under the following conditions. Copyright © and all moral rights to the version of the paper presented here belong to the individual author(s) and/or other copyright owners. To the extent reasonable and practicable the material made available in WRAP has been checked for eligibility before being made available.
Copies of full items can be used for personal research or study, educational, or not-for profit purposes without prior permission or charge. Provided that the authors, title and full bibliographic details are credited, a hyperlink and/or URL is given for the original metadata page and the content is not changed in any way.
Publisher’s statement:
http://dx.doi.org/10.1177/002795011523100103
A note on versions:
The version presented here may differ from the published version or, version of record, if you wish to cite this item you are advised to consult the publisher’s version. Please see the ‘permanent WRAP URL’ above for details on accessing the published version and note that access may require a subscription.
UK Economic Growth since 2010: Is It as Bad as It Seems?
Nicholas Crafts
University of Warwick
January 2015
Abstract
This paper reviews UK supply-side policies since 2010 in terms of their impact on growth and considers medium-term growth prospects in the context of the puzzle of disappointing post-crisis TFP performance. It is argued that there is no reason to believe that growth prospects have deteriorated significantly compared with the pre-crisis period. Changes in policy under the coalition government are unlikely to have made a big difference to growth potential. On the one hand, this means opportunities for radical reform have been ignored; on the other hand, there has been no repeat of the 1930s’ debacle.
Keywords: economic growth; industrial strategy; productivity puzzle; supply-side policy
JEL Classification: N14; O25; O52
1
Introduction
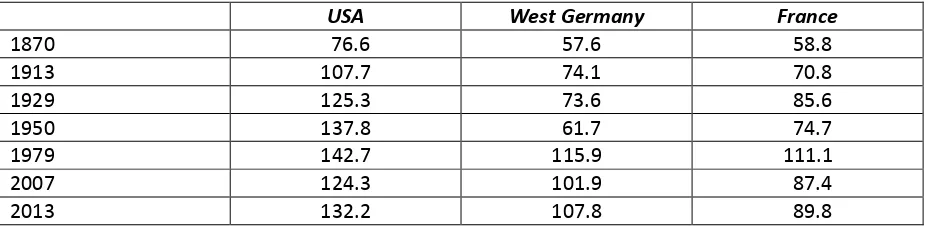
On the eve of the crisis, the growth performance of the UK economy was generally seen as quite satisfactory (Van Reenen, 2013). A long period of relative economic decline vis-à-vis other European economies seemed to have come to an end under the auspices of the supply-side policies initiated under the Thatcher government and continued in most respects by New Labour (cf. Table 1). Subsequent developments have come as a rude shock; in 2014 quarter 2, real GDP per person was still only at 98.2 per cent of the previous peak level in 2008 quarter 1 while real GDP per hour worked at the end of 2013 was about 16 per cent below what would have been expected on the basis of its pre-crisis trend (Barnett et al., 2014).
The context for UK growth has changed in the last few years in several important respects. First, and most obvious, the economy has been through its worst financial crisis since the 19th century. This has surely had a permanent and sizeable adverse effect on the level of potential output and may even mean that estimates of future trend growth need to be revised down.1 Second, the concept of ‘secular stagnation’ which haunted economists in the 1930s and 1940s has been re-discovered (Teulings and Baldwin, 2014) with the implication that long-term growth in all advanced economies may slow down as a result of unfavourable trends in demography and technology.2 Third, a major consequence of the crisis is that public finances have been seriously damaged. This has raised the level of public debt to GDP significantly and has led the government to initiate what promises to be a lengthy period of fiscal consolidation. Fourth, the crisis has also raised questions about the structure of the UK economy, in particular, as to whether the financial sector had become too big and manufacturing too small. ‘Re-balancing’ the economy under the auspices of a return to ‘industrial policy’ started to be discussed for the first time in a generation. Fifth, the 2010 election resulted in a coalition government which has had to make compromises on economic policy between the Conservatives and the Liberal Democrats. There has been no possibility of coherent radical change on the scale of the Attlee or Thatcher governments.
All this prompts two questions which this paper will address. First, are UK medium-term growth prospects now much worse than would have been thought in 2007? Second, how effective have the coalition government’s supply-side policies been in improving likely future growth performance? Informed by modern growth economics, my approach to these questions will be based on the premise that government can affect the growth rate to some extent through its choice and implementation of supply-side policies and the main focus of this paper is to consider the government’s record in this regard. I also take the view that the disappointing growth outcomes of the past few years do not of themselves make the answers to these questions obvious.
The paper proceeds as follows. In the next section, the details of recent growth performance and some future projections are presented in an internationally comparative perspective. Then, quantitative indicators of key components of supply-side policy are reviewed. After that, several important aspects of policymaking that might affect growth are examined in more depth including
1
It is generally agreed that serious financial crises reduce the level of potential output although by how much is debateable. There is no strong evidence that post-crisis trend growth is reduced but the transition period while the levels effect materializes may be quite long (IMF, 2009).
2 In the context of a focus on medium-term growth, in this paper I treat ‘secular stagnation’ as a concept
2 the composition of fiscal consolidation, the ‘industrial strategy’, and the extent to which supply-side policy is vulnerable to ‘government failure’. Finally, conclusions are presented.
Past Performance and Future Projections
The period 1995 to 2007 covers the years from the point at which the ICT revolution became a very significant aspect of productivity performance to the eve of the crisis and can be thought of as the ‘old normal’. Although there was a change in government in 1997, there was no radical revision of supply-side policy which exhibited a high degree of continuity under the ‘post-Thatcher consensus’. Prima facie at least, growth outcomes were very respectable for an advanced economy without the scope for rapid catch-up growth of post-war ‘Golden Age’ Europe or the contemporary BRIC economies.3
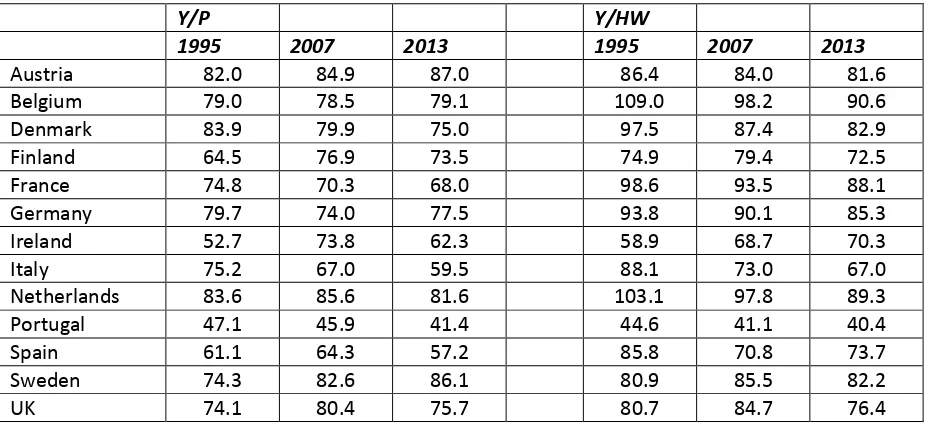
The estimates reported in Table 2 show the growth rate of real GDP per person at 2.87 per cent per year and of labour productivity (measured per hour worked) at 2.52 per cent per year.4 This was fairly similar to Sweden, a good deal better than France, Germany and especially Italy, but below Ireland which for the first half of this period was still in its Celtic Tiger catch-up phase. Table 3 shows that the labour productivity gap with the United States fell a little during these years and stood at just over 15 per cent in 2007. At this point, labour productivity seems to have been below the level in both France and Germany but adjusting for the impact of labour market distortions there was probably little or no difference from these countries.5
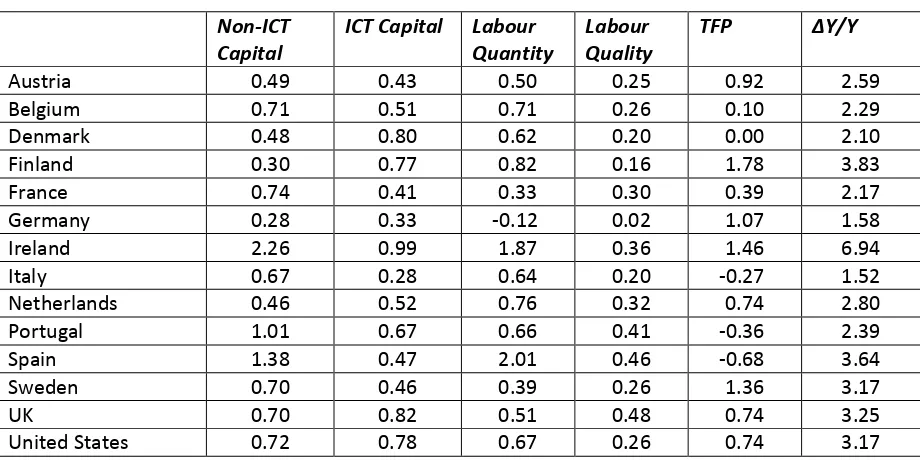
The growth accounting estimates which are presented in Table 4 show that the UK had relatively strong contributions from the growth of ICT capital and of labour quality. The former reflected the relatively rapid take-up of the new technology by the UK, at least when compared with mainland Europe, and the latter the rapidly increasing educational attainment of the labour force in terms of higher-level qualifications. Labour productivity growth in market services was notably strong in the UK based on substantial contributions from business services, financial services and, especially, distribution (Crafts, 2012a). TFP growth of 0.74 per cent per year was also very respectable when it is remembered that the highflyers, Finland, Ireland and Sweden, had a significant boost from much larger ICT production sectors than the UK (Timmer et al., 2010).
Despite a welcome recovery in the last two years, overall since 2007 growth, especially of labour productivity, has been disappointing. The estimates in Table 2 show that the change in the growth rate of real GDP per hour worked, at -3.03 percentage points per year, was the strongest reversal of fortune recorded. This has resulted in a widening of the labour productivity gap with the United States to 23.6 per cent. In Table 4, the growth accounting estimates show that the really big change
3
It is sometimes claimed that mismeasurement of financial services output distorted the pre-crisis picture; Oulton (2013a) shows that any such effect is very small - at most 0.1 percent per year during 2000-2007. 4 The output gap was positive in 2007 but probably small enough - 2 per cent according to Murray (2014) - that
it does not distort these growth rate estimates. 5
3 in the sources of growth in the short term has been in TFP growth which went from 0.74 per cent per year in 1995-2007 to -1.36 per cent per year in 2007-13. This exceeds the rate of decline of labour productivity in the latter period (-0.87 per cent per year) because there was an offset in terms of continued capital deepening and labour quality growth (albeit at slower rates than pre-crisis).
This raises the question of the extent to which negative productivity growth over these recent years reflects a one-time adjustment to a lower level of potential output or a ‘new normal’ lower trend rate of growth of productivity. It is well-known that financial crises can have permanent adverse direct effects on the level and possibly also the trend growth rate of potential output. Thinking in terms of a production function or growth accounting, there may be direct adverse effects on capital inputs as investment is interrupted, on human capital if skills are lost or restructuring makes them redundant, on labour inputs through increases in equilibrium unemployment, and on TFP if R & D is cut back or innovative firms cannot get finance.
The orthodox view, embraced by OECD and the Office for Budget Responsibility (OBR) among others, is that there has been a big levels effect but no impact on future trend growth such that log labour productivity will maintain a trend path parallel to what would have been expected in 2007.6 Thus OBR (2014b) believes that the future long run trend rate of growth of labour productivity will be 2.2 per cent per year while the current output gap is only about 1 per cent of GDP.7 The views of OECD economists are captured in Tables 5 and 6.
The estimates by Ollivaud and Turner (2014) reported in Table 5 show a levels effect on labour productivity of 9.1 per cent most of which comes from a fall in TFP of 7.4 per cent. At the same time, these authors estimate that the output gap is only 1.3 per cent of GDP so the adverse effect is expected to be permanent. It is striking that the estimated impact of the crisis on TFP is much larger than that in other countries (with the exception of Finland).
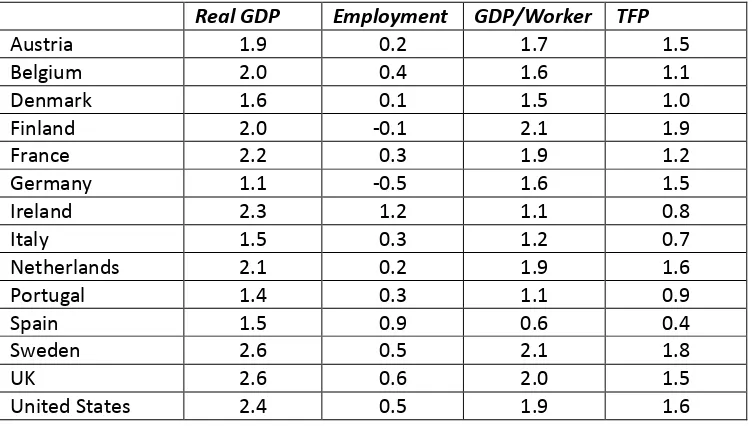
The long-run growth projections reported in Table 6 are based on a growth model which allows for TFP growth in the leader (United States) and a component based on scope for catch-up by other countries and how well this scope will be exploited which depends on supply-side policy settings and institutions. In effect, the assumptions underlying OECD (2014a) are that secular stagnation will not undermine American TFP growth and that there has been no significant change in UK policy either for better or worse. The former seems to be reasonable based on mainstream opinion among American economists (Fernald, 2014). It is true that projections of growth rates over the next 10 to 15 years in the United States have been reduced somewhat since the Great Recession and it is generally accepted that employment growth and the rate of improvement of labour quality will be slow down. However, even Gordon (2014), often cited as a notorious pessimist, expects labour productivity growth at 1.3 percent per year based on TFP growth around the average of the last 40 years. New technologies such as artificial intelligence and small robots will no doubt contribute but the most obvious factor underpinning TFP growth will be continuing progress in ICT (Byrne et al., 2013). Future technological progress is notoriously hard to predict but there is quite possibly scope
6 This would actually be quite similar to what analysis based on time-series econometrics suggests for the
experience of the United States in the context of the massive financial crisis during the Great Depression (Ben-David et al., 2003).
7 This projection and those of Tables 5 and 6 imply that the sustainable trend rate of growth pre-crisis was a
4 for a significant acceleration in TFP growth since a major legacy of the ICT revolution will be much higher productivity in undertaking R & D (Mokyr, 2014).
Not only is it likely that productivity will continue to increase steadily in the United States but there is also a bit more scope for catch-up growth in the UK than before the crisis since the productivity gap with the United States has widened. Whether OECD is right to assume that the UK is still as well positioned to exploit this source of growth will be considered in later sections of this paper. However, even at this point, it is worth noting that there has been no dramatic change of the kind that the UK experienced in the crisis of the 1930s which saw the abandonment of free trade and a serious weakening of competition in product markets that took decades fully to reverse and undermined productivity performance in the decades after World War II (Crafts, 2012b).
The persistent weakness of labour productivity has spawned a large literature on the ‘productivity puzzle’. It is important to know whether the orthodox view that it basically reflects a large levels effect, resulting from the financial crisis and accruing primarily through a one-off decline in TFP, is correct. A more pessimistic interpretation would be that it is partly the result of a slowdown in trend labour productivity growth. A more optimistic interpretation would be that some of what is now counted as a permanent effect will actually be regained as the economy returns to normal.
There is still considerable uncertainty about these issues, especially with regard to TFP.8 A recent overview suggested that as much as 6 percentage points (3/8ths) of the shortfall is currently unexplained (Barnett et al., 2014) but found quite strong evidence that the crisis had led to impairment of resource reallocation, and thus had decreased efficiency as well as holding back implementation of innovations, while also noting that there is little evidence of spare capacity and that labour hoarding seems unlikely still to be a strong factor. The decline in TFP seems quite large (by at least 4 percentage points) compared with what might be predicted on the basis of earlier financial crises (Oulton, 2013b). Thus, it still seems possible to fear that trend TFP growth will be weaker in future or to hope that as uncertainty among businesses recedes and normal patterns of entry and exit return there will be an increase in efficiency that will repair some of the damage.
An Overview of Supply-Side Policy
Despite attaining laughing-stock status in Punch-and-Judy politics, ‘post-neoclassical endogenous growth theory’ offers important insights into the way supply-side policy can be designed to promote productivity growth. The main thrust is that growth depends on investment in tangible and intangible capital, in education and training, and on innovation. Decisions to invest and innovate respond to economic incentives such that well-designed policy which addresses market failures can raise the growth rate a bit. This implies governments need to pay attention to making investments that complement private sector capital accumulation, for example in infrastructure, to supporting activities like education and research and development where social returns exceed private returns, to avoiding the imposition of high marginal direct tax rates, to recognising that regulations can undermine productivity, and to fostering competitive pressure on management to develop and adopt cost-effective innovations.
8 Falling real wages may well explain the (smaller) contribution from lower than counterfactual capital per
5 After the election of the Thatcher government, the stance of supply side policy changed markedly. Selective industrial policies were phased out, horizontal policies were downsized and narrowed in scope with the ending of most investment and employment subsidies, and competition in product markets was strengthened considerably, initially through reducing trade barriers and deregulation rather than by strengthening anti-trust policy. The effect of greater competition on productivity performance was substantial (Crafts, 2012b). Privatization, industrial relations reform, and restructuring taxation were new priorities. Taken together, these might be seen as policy changes designed to improve the workings of a ‘liberal market economy’ (Hall and Soskice, 2001).
When Labour won a landslide victory in the 1997 election, it was possible to wonder whether in government it would revert to 'Old Labour' policies. The answer soon became apparent and was a resounding 'No'. 1970s-style policy was conspicuous by its absence: there was no nationalization programme, no move to subsidize manufacturing investment, no counterpart of the National Enterprise Board, no return to high marginal rates of direct tax, no attempt to resist de-industrialization by supporting declining industries, and no major reversal of industrial relations reform. Implicitly, the Thatcher supply-side reforms had been accepted. The changes that Labour made were to strengthen some aspects of horizontal industrial policies with a new emphasis on education, R & D, investing in public capital, and strengthening competition policy.
The Coalition government has to a considerable extent continued in the same vein. The statement of its growth strategy (HMT and BIS, 2011) had four declared aims, namely, to create the most competitive tax system in the G20, to make the UK one of the best places in Europe to start, finance and grow a business, to encourage investment and exports as a route to a more balanced economy, and to create a more educated workforce that is the most flexible in Europe. This can largely be construed as continuity in terms of signalling an intention to improve horizontal industrial policies and this impression is strengthened by much of the detailed discussion in the document. Nevertheless, the aspiration to achieve a ‘more balanced economy’ did mark something of a change in response to the shock of the financial crisis, clearly represented a desire to strengthen sectors which were deemed to central to these goals through an ‘industrial strategy’, and entailed a move back towards more selective industrial policies albeit without the corporatist overtones of the 1970s or any grand ambition to move to develop a ‘co-ordinated market economy’.9
Given these ambitions to improve key areas of supply-side policy, what has happened in key areas? The government would like to be judged at least in part by the ranking assigned to the UK in indices of ‘competitiveness’ and is no doubt pleased by a move up from 12th to 9th in the World Economic Forum’s league table between 2010/11 and 2014/15.10 However, the relationship between such measures and long run growth potential is tenuous at best. It is possible to look at more meaningful quantitative indicators which empirical work has found to be linked to growth performance and this approach is followed here. In some cases, it is too soon for the numbers to have changed but it is possible to say something about whether it seems likely that they will improve in due course. The obvious starting point is policies towards education and innovation, the importance of which is
9
The change in thinking at BIS was already gathering pace under Peter Mandelson during the last months of the Labour government.
6 emphasized by many growth economists and this resonates with the rhetoric of The Plan for Growth. In each of these areas, there have been some interesting policy developments.
The quality of education is generally seen as important for growth and there is evidence that cognitive skills matter. As measured by international test scores, UK schooling improved slowly between 1975 and 2000 but has been flat-lining recently and is well below the top performers as measured by OECD’s PISA (Programme for International Student Assessment) scores, a benchmark highlighted in HMT and BIS (2011). The average for maths and science in 2012 was 504 compared with 503 in 2009 and 505 in 2006; the UK remains at 7th out of the 14 countries listed in Table 2 as it was in 2006. Hanushek and Woessmann (2012) estimate that increasing this score by 25 points – a bit less than half the difference between the UK and Singapore - would raise the long-run growth rate by about 0.3-0.4 percentage points.
A key finding of the literature on schooling outcomes is that it is crucial effectively to address principal-agent problems in the delivery of education. Across countries, about 80 percent of the variance in cognitive skills is explained by the organization of the education system (Woessmann et al., 2007). The most important implications of this study for English schools seem to be to improve the accountability provided by the examinations system, to strengthen the autonomy of head teachers in running schools, and to provide effective competition in the provision of schooling. Broadly speaking, this is the direction of travel of the present government’s policies which have been introduced as major reforms. These have included the announcement of significant changes in the design of GCSEs and A-Levels, changes in the design of school league tables to measure progress scores, a major expansion of schools with academy status from about 200 in 2010 to over 4000 in 2014, and new entry by Free Schools, of which there were over 250 in autumn 2014. Whether these reforms have the desired effect on PISA scores (let alone growth rates!) will only be seen in the fullness of time.
There is consensus in the literature that R and D has a strong impact on TFP growth (with an elasticity of perhaps 0.15) and has a very high social rate of return, on average 2 to 3 times as high as the median private rate of return of around 20 to 25 per cent (Frontier Economics, 2014). More generally, the process of innovation is exposed to market failures and there is a strong prima facie case for government intervention. This has long been recognised by UK governments yet the UK level of R and D (1.73 per cent of GDP of which business R and D comprised 1.10 per cent of GDP) is less than half that of the biggest spending OECD countries and little changed since 2007 (OECD, 2014b).
7 TFP spillovers in the market economy (Haskel and Wallis, 2013).11 Overall, this suggests that support for R and D has been underfunded and could have been better targeted but these remarks also apply to the previous government.
From a growth perspective, the UK has been investing too little in infrastructure. Investment in public capital has positive effects on real GDP, where an output elasticity of about 0.2 is a reasonable assumption, and also ‘crowds in’ private capital in the medium term (Kamps, 2005a). The UK net stock of public capital relative to GDP fell substantially between 1980 and 2010 (from 64% to 36%). To maintain the level of public capital to GDP at a growth-maximizing level, public investment of about 2.7 per cent of GDP per year would be needed but UK investment has fallen from 2.4 to 1.9 per cent of GDP since 2010 and during 2014/15 through 2018/19 this will fall to an average of 1.8 per cent (OBR, 2014a).12 This is an unhelpful policy development.
Transport infrastructure, especially roads, is a notorious case of underinvestment. Eddington (2006, p. 204-6) estimated that, in the absence of road pricing, there was a case for investment of £30 billion on strategic roads between 2015 and 2025 to deliver annual welfare benefits of £3.4 billion per year and a GDP impact of £2.3 billion per year in 2025. Most of this investment has not been made although reviews of unfunded transport schemes regularly show a large number of schemes with high benefit-cost ratios (Smith et al., 2011). Current proposals for the period through 2021 include only £0.5 billion per year for strategic roads compared with £3 billion for HS2.13 Continuing the traditional roads policy, memorably described by Glaister (2002) as ‘predict but don’t provide’, runs the risk of a growing disincentive to private investment and of productivity being impaired as journey times increase (Rice et al. 2006).
Reforming taxation with a view to increasing the growth rate would generally entail reducing marginal direct tax rates and increasing indirect and property taxes (Mirrlees et al., 2011). The coalition government has cut corporate taxes. Calculations of Effective Average and Effective Marginal Tax Rates (taking into account capital allowances) indicate that by 2015 the former will be 20.3 and the latter 18.9 per cent, compared with 26.9 and 20.0 per cent, respectively, in 2007 (Bilicka and Devereux, 2012). Estimates by OECD economists suggest that this might raise labour productivity growth by about 0.1 percentage points per year (Johansson et al., 2008). This is some progress but hardly matches the 2011 aspiration; in fact, on the EMTR measure the UK will be 13th/14 of the countries listed in Table 2.
11 The policy will be phased out after 2016 following objections by Germany and the EU that it is an illegal
subsidy. 12
The growth-maximizing ratio of public to private capital is where the marginal product of public capital equals the after-tax marginal product of private capital and the interest rate on government debt. For a Cobb-Douglas production function using the two types of capital this ratio Ω = γ/(1 – γ)2 where γ is the output elasticity of public capital and the growth maximizing ratio of public capital to output Φ = Ω1 – γ . For γ = 0.21, this is 42.3 per cent and, given the 95 per cent confidence interval around γ, the 95 per cent confidence interval on Φ is 32.4 per cent to 52.1 per cent (Kamps, 2005b). The growth maximizing rate of public investment can then be shown to be (δ + g)Φ where δ is the depreciation rate of public capital and g is the trend growth rate for the UK assumed to be 4 per cent and 2.4 per cent, respectively. In the long run, public capital/GDP = (Ipub/Y)/(δ + g) so investing 1.8 per cent of GDP in public capital implies that this ratio would be only 28.1 per cent.
13 The official ex-ante BCR of 2.3 for the full HS2 (which will cost about £50 billion) would make this project a
8 Regulations can inhibit innovation or slow down adjustment to new technologies or changes in comparative advantage. Empirical studies indicate that product market regulations that create barriers to entry (Nicoletti and Scarpetta, 2005) and employment protection that makes reorganization of the labour force costly (Caballero et al., 2013) have a significant cost in terms of foregone productivity growth. Both aspects of regulation have been shown to retard the diffusion of ICT (Cette and Lopez, 2012). The most commonly used indices, PMR and EP, are those constructed by OECD. The UK has benefited from relatively low scores on both measures since the 1990s and that has continued to be the case since 2010. On a scale of 0 to 6 (lowest best), the UK scored 1.09 for PMR and 1.03 for EP in 2013, in each case a small improvement on 2008 and ranked 2nd of the countries listed in Table 2. This can help underpin future productivity growth given the continuing scope for technological progress in ICT.14
It should be noted, however, that not all UK regulation is productivity friendly. Land-use planning reduces labour productivity both by making land unduly expensive and by restricting city size which means that agglomeration economies are foregone and spatial adjustment is impeded – successful British cities are too small (Leunig and Overman, 2008). Cheshire and Sheppard (2005, p. 660) concluded that ‘controlling land supply by fiat has created price distortions on a par with those observed in Soviet-bloc countries”. One of the implications is an implicit regulatory tax rate of around 300 per cent which makes office space in cities like Leeds and Manchester much more expensive than even New York and San Francisco (Cheshire and Hilber, 2008). Similarly, planning policy by making land for retailing very expensive and by constraining retailers to choose less productive sites has reduced the level of TFP in the supermarkets by about 32 per cent in post-1996 compared with pre-1988 stores thereby significantly reducing the rate of TFP growth in the sector (Cheshire et al., 2015). The National Planning Policy Framework introduced in 2012 addresses some of these issues by introducing a presumption in favour of development where there is no local plan but still retains the Green Belt and did not liberalize the rules for retailing. Again, this represents only a timid step in a direction favourable to growth – a bit underwhelming compared with the rhetoric of The Plan for Growth.
Another aspect of UK regulation which potentially affects productivity is immigration policy where the government wishes to be more restrictive than Labour had been prior to 2010 with a target of reducing net migration from hundreds of thousands to tens of thousands and has imposed a cap on non-EEA economic migration. The key issue here is what impact migration (especially high-skill migration) has on the productivity of the domestic labour force and thus on the income of the resident population through spillover effects. Obtaining reliable estimates is challenging but the international evidence points to positive effects (MAC, 2010) and a recent study suggests that the increase in the migrant share of the UK labour force between 1997 and 2007 might have raised labour productivity by between 0.27 and 0.40 percentage points (Rolfe et al., 2013). The impact of a more restrictive migration policy on productivity may not be dramatic but the government’s vote-seeking approach to this aspect of policymaking does not really match the aspiration of The Plan for Growth to create a more educated workforce that is the most flexible in Europe.
14 Given current supply-side policy, Oulton (2012) projects a contribution to labour productivity growth from
9 It is widely agreed that increased product-market competition has been strongly positive for UK productivity performance. New Labour accepted this analysis, maintained a pro-globalization stance, and strengthened competition policy quite considerably with the Competition Act of 1998 and the Enterprise Act of 2003 which increased the independence of the competition authorities, removed the old ‘public-interest’ defence, and introduced criminal penalties for running cartels. The quantitative index of competition policy devised by Buccirossi et al. (2013), which they found has a strong causal effect on productivity growth, shows major improvement for the UK between 1995 and 2005 sufficient to raise TFP growth by about 0.3 percentage points.
The main change in competition policy introduced by the present government has been the innovation of the Competition and Markets Authority in 2014. This basically aims to consolidate Labour’s reforms by improving enforcement through increasing the speed and number of competition investigations (Graham, 2012). A recent evaluation by OECD found that UK competition policy is quite close to international best practice at a time when there is relatively little difference across advanced economies (Alemani et al., 2013). If there is a cause for concern with regard to competition, it is rather to be found in ‘murky protectionism’ as flagged up by Global Trade Alert. The UK ranks 9th in their list of countries which have introduced the most protectionist measures since 2008 with a total that is fairly similar to Germany and Italy (Evenett, 2014).
Thus far, this review of supply-side policies since 2010 suggests a strong element of continuity from the previous government in terms both of strengths (competition and regulation) and weaknesses (innovation and infrastructure). The most striking changes have been in education but any positive impact that they may have on growth performance will only emerge in the long run. Overall, there is no real reason to think that significant damage has been done to the outlook for productivity performance but if there are grounds for complaint perhaps they reside more in errors of omission than of commission. This theme is pursued in the following section.
Three Key Policy Issues
Three areas of policy deserve some critical scrutiny, namely, the approach to fiscal consolidation, the re-thinking of industrial policy in the context of re-balancing the economy, and the institutional framework within which supply-side policy is designed and monitored. The first two of these have been central concerns for policymakers since 2010 but concerns about the last appear to have fallen on deaf ears despite being given a high profile by the LSE’s Growth Commission (2013).
A key decision by (and perhaps the chief rationale of) the Coalition was to address the incipient problem of fiscal sustainability by embarking immediately on a policy of fiscal consolidation. From the perspective of supply-side policy towards growth, this raises the key issue of the composition of the fiscal adjustment, given its size, with regard to the balance between expenditure and tax, capital and current expenditure, direct and indirect taxes etc. If it is thought that crises offer a greater opportunity for radical change, fiscal consolidation could even entail a serious reform of the tax system.
10 £21.8 billion in net investment. In 2019/20, interest payments on the national debt are expected to be about double and net investment about half the 2009/10 level. On the tax side, the standard rate of VAT was increased to 20% at the start of 2011 and the headline corporate tax rate is coming down from 28 per cent in 2009/10 to 21 per cent in 2014/15. Between 2009/10 and 2014/15 the increase in receipts from Vat and Fuel Duties will exceed that from income tax and NICs by £9.5 billion but by 2019/20 the reverse will be true with income tax and NICs contributing an additional £50 billion more. The number of higher-rate income tax payers is projected to be 5.0 million in 2014/15 (about twice the 1999/2000 figure) compared with 3.2 million in 2009/10 while the VAT revenue base remains narrow by OECD standards.
This does not really represent a supply-side friendly model of fiscal consolidation although, clearly, the impact could have been a good deal worse. Equally, however, the government has lacked any semblance of a coherent strategy of tax reform (Johnson, 2014) although blueprints have been provided. The Mirrlees Review provided a powerful case for tax reforms which would have significant positive effects on the level of GDP and its growth rate. The key is to reduce personal and, especially, corporate income tax paid for by raising consumption and property taxes. The proposals made include implementing a land value tax, ending exemptions from VAT, making a normal rate of return non-taxable (Mirrlees et al., 2011). To be fair, while some of these changes could be made quickly, the Mirrlees-Review agenda is, as its authors themselves say, really a long-term programme for reform and it is ‘politically challenging’ especially for a coalition government.
The distinctive feature of supply-side policy under the Coalition compared with the recent past is the pursuit of an ‘industrial strategy’ which aims to promote growth in through boosting eleven selected sectors and to stimulate the advance and commercialization of eight selected technologies with the underlying objective of re-balancing the economy (Rhodes, 2014).15 The government is in the process of developing ‘strategic partnerships’ in key sectors with growth potential to address market failures, especially with regard to innovation, and to underpin investment (BIS, 2012). These entail a high-level forum, skills improvement initiatives, and public support for research centres. An interesting component of this approach is the funding of ‘catapult centres’ which aim to enhance business capabilities in the exploitation of new technologies.16 Industrial strategy expenditure is running at about £2 billion per year.
Although this is a return to ‘selective industrial policy’, it is not really ‘back to the 1970s’. Back then, there is no doubt that such policies were a very expensive failure characterized by costly support for declining industries and vain attempts to compete with the United States in high-technology industries (Crafts, 2012a). The current approach is on a much smaller scale and is closer to ‘soft industrial policy’ with the government as a facilitator that seeks to address coordination failures rather than to ‘pick winners’ (Warwick, 2013). In particular, the aim is to address market failures associated with the so-called ‘valley of death’ in terms of the phase of technology platform research
15
The sectors are aerospace, agricultural technologies, automotives, construction, information economy, international education, life science, nuclear, offshore wind, oil & gas, and professional & business services while the technologies are advanced materials, agri-science, big data, energy storage, regenerative medicine, robotics and autonomous systems, satellites, and synthetic biology.
16 There are nine catapult centres so far in cell therapy, digital economy, energy systems, future cities,
11 (which often entails high risk, high cost and provision of public goods) that comes between basic research and applied R and D (Tassey, 2014).
It is quite possible that, if the share of manufacturing in the economy were to rise, labour productivity growth would increase; in the pre-crisis period the growth rate of real output per hour worked in manufacturing exceeded that in market services by about 1 percentage point per year.17 However, there is as yet no sign of an upturn in manufacturing’s share of economic activity and it is difficult to think of a credible scenario in which it could occur (Foresight, 2013). Manufacturing was 9.5 per cent of GDP and 9.8 per cent of employment in the first three quarters of 2014 compared with 10.2 per cent and 9.8 per cent, respectively, in 2010, and 10.8 per cent and 11.0 per cent, respectively, in 2007. The notion that the industrial strategy will lead to significantly faster growth through re-industrialization any time soon seems far-fetched.
It is also difficult to believe that the industrial strategy really tackles the most important reasons for the business (and manufacturing) innovation shortfall which the Coalition wishes to remedy and in this respect it is no different from earlier governments. In particular, R and D is an activity which is vulnerable to short-termism and impatient capital where future returns are myopically discounted, a problem more likely to be found in a liberal market economy than a co-ordinated market economy. It has been regularly documented that UK equity markets are notably short-termist (Miles, 1993; Black and Fraser, 2000; Davies et al., 2014) and that this has adverse effects on long-term innovation related investment (Bond et al., 2003; Hughes, 2013). The Kay Review (Kay, 2012) reaffirmed this point and argued the need for changes to incentive structures in equity markets if shortfalls in long-term investments were to be redressed. The government has made positive noises and this is work in progress which, if successfully implemented, could eventually matter more than the industrial strategy per se.
The LSE Growth Commission (2013) has recently suggested that failures in the institutional architecture are at the roots of the persistent and serious failure in UK investment in public capital which has continued under the present government. (Vote-seeking politicians cannot be expected to make good policy or respect cost-benefit analysis). They propose a solution in terms of several new institutions with powers delegated by parliament with statutory responsibility for strategy, an infrastructure planning commission with responsibility for delivery and an infrastructure bank to provide finance.
Whether this solution is the best one or not, the diagnosis is surely correct and applies quite widely to supply-side policy.18 Supply-side policy is exposed to government failure but this has not been addressed by institutional innovation in the UK. In other aspects of public policy, it is accepted that politicians cannot be trusted to deliver efficient outcomes. Recent examples include the delegation of monetary policy to an independent Bank of England, the establishment of NICE to consider the costs and benefits of new drugs, the de-politicization of competition policy by removing the ministerial prerogative to over-rule the competition authorities, and the Office of Budget
17
However, a smaller financial services sector might not help; it should be noted that labour productivity growth in financial services was appreciably higher than in manufacturing, 4.23 per cent per year compared with 3.48 per cent per year in the ten years to 2007 (EU KLEMS, 2011).
18 For example, with regard to investment in roads a more attractive solution may be to make the road
12 Responsibility to evaluate macroeconomic forecasts and the implications of government policy for fiscal sustainability. With regard to the politics of protectionism, we long ago signed up to international treaties (GATT/WTO/EU) which remove political discretion and which have guarded against a repeat of the policy errors of the 1930s.
At a minimum, there is a need for serious surveillance of supply-side policy. An agency tasked with this function might be asked inter alia to require government departments to provide information for the public domain and to audit government policies for their effects on medium-term productivity performance. It might also be asked to benchmark supply-side policies against international best practice and be expected to provide a regular strategic assessment and evidence papers.19 A reconsideration of the framework in which supply-side policy is generated is made all the more urgent by the return of selective industrial policy, the recent upsurge of populism, and the likelihood of an indecisive General Election in 2015. The present government’s lack of interest in reform of the institutional architecture of supply-side policy has been unfortunate.20
Conclusions
In the introduction, I posed two quite difficult questions, namely ‘are UK medium-term growth prospects much worse than would have been thought in 2007?’ and ‘how effective have the coalition government’s supply-side policies been in improving likely future growth performance?’. Here are tentative answers informed by the discussion of the previous three sections.
My answer to the first question is ‘probably not’. I suggest that the fashionable notion of ‘secular stagnation’ based on a major decline in future productivity growth in the United States probably is a mirage whereas decent UK productivity performance prior to 2007 is not. There has been no major change in quantifiable supply-side fundamentals either in terms of strengths or weaknesses. However, the continuing, still not well understood, weakness of TFP so long after the crisis, which is the essence of the ‘productivity puzzle’, is a serious concern.
My answer to the second question is ‘not very’. The picture is mixed and certainly does not correspond to the grandiose claims of The Plan for Growth. Radical reform has not been the order of the day, which is perhaps not surprising under a coalition government, but no significant damage has been done. It might be argued that there have been marginal improvements in competition policy, innovation policies, land-use planning, and the structure of taxation. In contrast, infrastructure policy continues to disappoint and the composition of fiscal consolidation has not been very growth-friendly. The much-vaunted ‘industrial strategy’ is a quite modest re-positioning of industrial policy which is most unlikely to re-balance the economy in the direction of a larger share of GDP originating in manufacturing. Changes in education policy may eventually improve the quality of schooling but this remains to be seen and will, in any case, take many years to affect growth performance. The institutional architecture has not been reformed so as effectively to address government failure in supply-side policy.
19
An example of a somewhat similar remit is the Australian government’s independent research and advisory body, the Australian Productivity Commission.
20 For example, this attitude was demonstrated by its summary rejection of the proposal by the Foresight
13
References
Alemani, E., Klein, C., Koske, I., Vitale, C. and Wanner, I. (2013), ‘New indicators of competition law and policy in 2013 for OECD and non-OECD countries’, OECD Economics Department Working Paper No. 1104.
Barnett, A., Batten, S., Chiu, A., Franklin, J. and Sebastiá-Barrel, M. (2014), ‘The UK productivity puzzle”, Bank of England Quarterly Bulletin, 54, pp. 114-128.
Ben-David, D., Lumsdaine, R. and Papell, D. H. (2003), ‘Unit roots, postwar slowdowns and long-run growth: evidence from two structural breaks’, Empirical Economics, 28, pp. 303-319.
Bilicka, K. and Devereux, M. (2012), CBT Corporate Tax Ranking 2012. Oxford: Centre for Business Taxation.
BIS (2012), Industrial Strategy: UK Sector Analysis.
Black, A. and Fraser, P. (2000), ‘International comparisons on stock-market short-termism: how different is the UK experience?’, The Manchester School, 68 (supplement), pp. 38-50.
Blundell, R., Crawford, C. and Jin, W. (2014), ‘What can wages and employment tell us about the UK’s productivity puzzle?’, Economic Journal, 124, pp. 377-407.
Bond, S. R. and Guceri, I. (2012), ‘Trends in UK BERD after the introduction of R & D tax credits’, Oxford University Centre for Business Taxation Working Paper No. 12/01.
Bond, S. R., Harhoff, D. and Van Reenen, J. (2003), ‘Investment, r and d and financial performance’, London School of Economics Centre for Economic Performance Discussion Paper No. 595.
Bourles, R. and Cette, G. (2007), ‘Trends in ‘structural’ productivity levels in the major industrialized countries’, Economics Letters, 95, pp. 151-156.
Buccirossi, P., Clari, L., Duso, T., Spagnolo, G. and Vitale, C. (2013),’Competition policy and economic growth: an empirical assessment’, Review of Economics and Statistics, 95, pp. 1324- 1336.
Byrne, D., Oliner, S. and Sichel, D. (2013), ‘Is the information technology revolution over?’, International Productivity Monitor, 25, pp. 20-36.
Caballero, R. J., Cowan, K. N., Engel, E. M. and Micco, A. M. (2013), ‘Effective labor regulation and microeconomic flexibility’, Journal of Development Economics, 101, pp. 92-104.
Cette, G. and Lopez, J. (2012), ‘ICT demand behaviour: an international comparison’, Economics of Innovation and New Technology, 21, pp. 397-410.
Cheshire, P. C. and Hilber, C. A. L. (2008), ‘Office space supply restrictions in Britain: the political economy of market revenge’, Economic Journal, 118, pp. F185-F221.
14 Cheshire, P. and Sheppard, S. (2005), ‘The introduction of price signals into land-use planning: a proposal’, Urban Studies, 42, pp. 647-663.
Crafts, N. (2012a), ‘Creating competitive advantage: policy lessons from history’, in Greenaway, D. (ed.), The UK in a Global World, London, CEPR Press, pp. 7-35.
Crafts, N. (2012b), ‘British relative economic decline revisited: the role of competition’, Explorations in Economic History, 49, pp. 17-29.
Davies, R., Haldane, A. G., Nielsen, M. and Pezzini, S. (2014), ‘Measuring the costs of short-termism’, Journal of Financial Stability, 12, 16-25.
Eddington, R. (2006), The Eddington Transport Study, London, The Stationery Office.
EU KLEMS (2011), Growth and Productivity Accounts. http://euklems.net/
Evenett, S. J. (2014), The Global Trade Disorder. London: CEPR Press.
Fernald, J. (2014), ‘Productivity and potential output before, during and after the great recession’, NBER Working Paper No. 20248.
Flyvberg, B. (2009), ‘Survival of the unfittest: why the worst infrastructure gets built – and what we can do about it’, Oxford Review of Economic Policy, 25, pp. 344-367.
Foreman-Peck, J. (2013), ‘Effectiveness and efficiency of SME innovation policy’, Small Business Economics, 41, pp. 55-70.
Foresight (2013), The Future of Manufacturing: a New Era of Opportunity and Challenge for the UK, London, Government Office for Science.
Frontier Economics (2014), Rates of Return to Investment in Science and Innovation, London.
Glaister, S. (2002), ‘UK transport policy, 1997-2001’, Oxford Review of Economic Policy, 18, pp. 154- 186.
Glaister, S. and Smith, J. W. (2009), ‘Roads: a utility in need of a strategy’, Oxford Review of Economic Policy, 25, pp. 368-390.
Gordon, R. J. (2014), “The demise of U. S. economic growth: restatement, rebuttal, and reflections”, NBER Working Paper No. 19895.
Graham, C. (2012), ’The reform of UK competition policy’, European Competition Journal, 8, 539-562.
Griffith, R. and Miller, H. (2011), ‘Corporate taxes and intellectual property’, in Brewer, M. Emmerson, C. and Miller, H. (eds.), The IFS Green Budget 2011, London, Institute for Fiscal Studies, pp. 223-241.
15 Hall, P. A. and Soskice, D. (2001), ‘An introduction to varieties of capitalism’, in Hall, P. A. and
Soskice, D. (eds.), Varieties of Capitalism, Oxford, Oxford University Press, pp. 1-68.
Haskel, J. and Wallis, G. (2013), Public support for innovation, intangible investment and productivity growth in the UK market sector”, Economics Letters, 119, pp. 195-198.
Hanushek, E. A. and Woessmann, L. (2012), ‘Do better schools lead to more growth? Cognitive skills, economic outcomes, and education’, Journal of Economic Growth, 17, pp. 267-321.
HM Treasury and BIS (2011), The Plan for Growth, London.
Hughes, A. (2013), ‘Short-termism, impatient capital and finance for manufacturing innovation in the UK’, Future of Manufacturing Project Evidence Paper No. 16.
IMF (2009), World Economic Outlook.
Johansson, A., Heady, C., Arnold, J., Brys, B. and Vartis, L. (2008), ‘Taxation and economic growth’, OECD Economics Department Working Paper No. 620.
Johnson, P. (2014), ‘Tax without design: recent developments in UK tax policy’, Fiscal Studies, 35, pp. 243-273.
Kamps, C. (2005a), ‘The dynamic effects of public capital: VAR evidence for 22 OECD countries’, International Tax and Public Finance, vol. 12, pp. 533-558.
Kamps, C. (2005b), ‘Is there a lack of public capital in the European Union?’, EIB Papers, vol. 10(1), pp. 73-93.
Kay, J. A. (2012), The Kay Review of UK Equity Markets and Long-Term Decision-Making, London, The Stationery Office.
Leunig, T. and Overman, H. (2008), ‘Spatial patterns of development and the British housing market’, Oxford Review of Economic Policy, 24, pp. 59-78.
LSE Growth Commission (2013), Investing in Prosperity: Skills, Infrastructure and Innovation, London, London School of Economics.
Maddison, A. (2010), Historical Statistics of the World Economy, 1-2008AD. http:// www.ggdc.net/maddison
Migration Advisory Committee (2010), Limits on Migration: Limits on Tier1 and Tier 2 for 2011/12 and Supporting Policies, London, The Stationery Office.
Miles, D. (1993), ‘Testing for short-termism in the UK Stock market’, Economic Journal, 103, pp. 1379-1396.
16 Mokyr, J. (2014), “Secular Stagnation? Not in Your Life”, in Teulings, C. and Baldwin, R. (eds.), Secular Stagnation: Facts, Causes and Cures, London, CEPR Press, pp. 83-89.
Murray, J. (2014), “Output gap measurement: judgement and uncertainty”, Office for Budget Responsibility Working Paper No. 5.
Newbery, D. (2005), ‘Road user and congestion charges’, in Cnossen, S. (ed.), Theory and Practice of Excise Taxation, Oxford, Oxford University Press, pp. 197-233.
Nicoletti, G. and Scarpetta, S. (2005), ‘Regulation and economic performance: product market reforms and productivity in the OECD’, OECD Economics Department Working Paper No. 460.
Office for Budget Responsibility (2011), Economic and Fiscal Outlook.
Office for Budget Responsibility (2014a), Economic and Fiscal Outlook.
Office for Budget Responsibility, (2014b), Fiscal Sustainability Report.
OECD (2014a), Economic Outlook.
OECD (2014b), Main Science and Technology Indicators.
Ollivaud, P. and Turner, D. (2014), ‘The effect of the financial crisis on OECD potential output’, OECD Economics Department Working Paper No. 1166.
Oulton, N. (2012), ‘Long-term implications of the ICT revolution: applying the lessons of growth theory and growth accounting’, Economic Modeling, 29, pp. 1722-1736.
Oulton, N. (2013a), ‘Has the growth of real GDP in the UK been overstated because of
mismeasurement of banking output?’, National Institute Economic Review, 224, pp. R59-R65.
Oulton, N. (2013b), ‘Medium and long run prospects for UK growth in the aftermath of the financial crisis’, London School of Economics Centre for Economic Performance Occasional Paper No. 37.
Pessoa, J. P. and Van Reenen, J. (2014), ‘The UK productivity and jobs puzzle: does the answer lie in wage flexibility?’, Economic Journal, 124, pp. 433-452.
Rhodes, C. (2014), ‘Industrial policy since 2010’, House of Commons Library Standard Note, SN/EP/6857.
Rice, P., Venables, A. J. and Patacchini, E. (2006), ‘Spatial determinants of productivity: analysis for the regions of the UK’, Regional Science and Urban Economics, 36, pp. 727-752.
Rolfe, H., Rienzo, C., Lalani, M. and Portes, J. (2013), Migration and Productivity: Employers’ Practices, Public Attitudes and Statistical Evidence, London, NIESR.
Smith, J. W., Alexander, J. and Phillips, D. (2011), Providing and Funding Strategic Roads, London, RAC Foundation.
17 The Conference Board (2014), Total Economy Database.
http://www.conference-board.org/data/economy/database/
Teulings, C. and Baldwin, R. (eds.) (2014), Secular Stagnation: Facts, Causes and Cures. London: CEPR Press.
Timmer, M., Inklaar, R., O’Mahony, M. and van Ark, B. (2010), Economic Growth in Europe: a Comparative Economic Industry Perspective, Cambridge, Cambridge University Press.
Van Reenen, J. (2013), ‘Productivity under the 1997-2010 Labour government’, Oxford Review of Economic Policy, 29, pp. 113-141.
Warwick, K. (2013), ‘Beyond industrial policy’, OECD STI Policy Paper No. 2.
18
Table 1. Real GDP/Head (UK = 100 in each year)
USA West Germany France
1870 76.6 57.6 58.8
1913 107.7 74.1 70.8
1929 125.3 73.6 85.6
1950 137.8 61.7 74.7
1979 142.7 115.9 111.1
2007 124.3 101.9 87.4
2013 132.2 107.8 89.8
Notes: estimates refer to Germany from 1870 to 1937. Purchasing power parity estimates in $1990GK for 1870 through 1979 and in $2005EKS from Penn World Table for 2007 and 2013.
19
Table 2. Growth of Real GDP/Person and Real GDP/Hour Worked, 1995-2007 and
2007-2013 (% per year)
1995-2007 2007-2013
Y/P Y/HW Y/P Y/HW
Austria 2.45 1.88 0.57 0.73
Belgium 2.14 1.23 0.27 -0.14
Denmark 1.77 1.19 -0.88 0.34
Finland 3.66 2.61 -0.58 -0.30
France 1.64 1.67 -0.46 0.23
Germany 1.55 1.78 0.94 0.30
Ireland 5.08 3.42 -2.36 1.61
Italy 1.18 0.54 -1.65 -0.22
Netherlands 2.38 1.67 -0.67 -0.30
Portugal 1.96 1.42 -1.48 0.96
Spain 2.60 0.50 -1.67 1.91
Sweden 3.08 2.58 0.42 0.57
UK 2.87 2.52 -0.87 -0.51
United States 2.18 2.12 0.14 1.22
20
Table 3. Levels of Real GDP/Person and Real GDP/Hour Worked, 1995, 2007 and 2013
(USA = 100 in each year)
Y/P Y/HW
1995 2007 2013 1995 2007 2013
Austria 82.0 84.9 87.0 86.4 84.0 81.6
Belgium 79.0 78.5 79.1 109.0 98.2 90.6
Denmark 83.9 79.9 75.0 97.5 87.4 82.9
Finland 64.5 76.9 73.5 74.9 79.4 72.5
France 74.8 70.3 68.0 98.6 93.5 88.1
Germany 79.7 74.0 77.5 93.8 90.1 85.3
Ireland 52.7 73.8 62.3 58.9 68.7 70.3
Italy 75.2 67.0 59.5 88.1 73.0 67.0
Netherlands 83.6 85.6 81.6 103.1 97.8 89.3
Portugal 47.1 45.9 41.4 44.6 41.1 40.4
Spain 61.1 64.3 57.2 85.8 70.8 73.7
Sweden 74.3 82.6 86.1 80.9 85.5 82.2
UK 74.1 80.4 75.7 80.7 84.7 76.4
Note: comparison for Ireland is based on GNP
21
Table 4. Sources of Growth, 1995-2007 and 2007-2013 (% per year)
a)
1995-2007
Non-ICT Capital
ICT Capital Labour Quantity
Labour Quality
TFP ΔY/Y
Austria 0.49 0.43 0.50 0.25 0.92 2.59
Belgium 0.71 0.51 0.71 0.26 0.10 2.29
Denmark 0.48 0.80 0.62 0.20 0.00 2.10
Finland 0.30 0.77 0.82 0.16 1.78 3.83
France 0.74 0.41 0.33 0.30 0.39 2.17
Germany 0.28 0.33 -0.12 0.02 1.07 1.58
Ireland 2.26 0.99 1.87 0.36 1.46 6.94
Italy 0.67 0.28 0.64 0.20 -0.27 1.52
Netherlands 0.46 0.52 0.76 0.32 0.74 2.80
Portugal 1.01 0.67 0.66 0.41 -0.36 2.39
Spain 1.38 0.47 2.01 0.46 -0.68 3.64
Sweden 0.70 0.46 0.39 0.26 1.36 3.17
UK 0.70 0.82 0.51 0.48 0.74 3.25
United States 0.72 0.78 0.67 0.26 0.74 3.17
b)
2007-2013
Non-ICT Capital
ICT Capital Labour Quantity
Labour Quality
TFP ΔY/Y
Austria 0.32 0.28 -0.06 0.06 -0.01 0.59
Belgium 0.36 0.47 0.32 0.22 -1.02 0.35
Denmark -0.02 0.75 -0.69 0.06 -0.73 -0.63
Finland 0.23 0.96 -0.18 0.20 -1.74 -0.53
France 0.65 0.11 -0.07 0.16 -0.74 0.11
Germany 0.17 0.41 0.24 0.10 -0.24 0.68
Ireland 0.90 0.61 -1.90 0.16 -0.85 -1.08
Italy 0.04 0.14 -0.72 0.05 -0.83 -1.32
Netherlands 0.27 0.22 0.06 0.08 -0.84 -0.21
Portugal 0.12 0.75 -1.52 0.55 -1.22 -1.32
Spain 0.67 0.28 -1.74 0.30 -0.56 -1.05
Sweden 0.52 0.63 0.28 0.10 -0.55 0.98
UK 0.56 0.21 0.14 0.14 -1.36 -0.31
United States 0.27 0.39 -0.16 0.14 0.33 0.97
Notes: based on standard neoclassical growth accounting formula
22
Table 5.Crisis Effect on Level of Potential Output in 2014 (% fall relative to pre-crisis level)
Labour Productivity
Due to
Capital/Worker
Due to TFP Employment Total
Austria 3.0 1.5 1.5 -2.1 0.9
Belgium 3.4 0.5 2.9 -0.1 3.3
Denmark 2.6 1.2 1.4 2.1 4.7
Finland 8.6 -1.2 9.8 -1.7 6.9
France -0.2 -0.3 0.1 -0.9 -1.1 Germany 0.4 0.5 -0.1 -4.3 -3.9
Ireland 5.4 0.2 5.2 5.6 11.0
Italy 2.3 1.7 0.6 1.8 4.1
Netherlands 3.2 -0.6 3.8 0.2 3.4
Portugal 2.4 3.0 -0.6 7.3 9.7
Spain -4.4 -3.5 -0.9 12.4 8.0
Sweden 5.8 0.6 5.2 -1.0 4.8
UK 9.1 1.7 7.4 -0.5 8.6
United States 1.8 1.3 0.5 0.7 2.5
Note: Column (1) is based on output per worker.
23
Table 6. OECD Growth Projections, 2014-2030 (% per year)
Real GDP Employment GDP/Worker TFP
Austria 1.9 0.2 1.7 1.5
Belgium 2.0 0.4 1.6 1.1
Denmark 1.6 0.1 1.5 1.0
Finland 2.0 -0.1 2.1 1.9
France 2.2 0.3 1.9 1.2
Germany 1.1 -0.5 1.6 1.5
Ireland 2.3 1.2 1.1 0.8
Italy 1.5 0.3 1.2 0.7
Netherlands 2.1 0.2 1.9 1.6
Portugal 1.4 0.3 1.1 0.9
Spain 1.5 0.9 0.6 0.4
Sweden 2.6 0.5 2.1 1.8
UK 2.6 0.6 2.0 1.5
United States 2.4 0.5 1.9 1.6
24
Table 7. Public Finances, 2009/10 to 2019/20 (£ billion current)
2009/10 Outturn
2014/15 Projected
2019/20 Projected Expenditure
Current 600.9 671.7 707.0
Welfare 187.1 215.0 240.7
Debt Interest 30.9 35.9 60.1
Net Investment 49.5 27.7 26.9
Total Managed Expenditure 669.7 719.9 779.9
Revenue
Income Tax and NICs 244.1 272.0 354.1
Corporate Tax 36.5 41.7 45.9
VAT 73.5 110.1 130.2
Fuel Duties 26.2 27.0 29.8
Current Receipts 513.3 645.8 803.0