warwick.ac.uk/lib-publications
Original citation:
Lu, Yi, Higgins, Matthew D., Noel, Adam, Leeson, Mark S. and Chen, Yunfei. (2016) The effect
of two receivers on broadcast molecular communication systems. IEEE Transactions on
NanoBioscience.
Permanent WRAP URL:
http://wrap.warwick.ac.uk/82229
Copyright and reuse:
The Warwick Research Archive Portal (WRAP) makes this work by researchers of the
University of Warwick available open access under the following conditions. Copyright ©
and all moral rights to the version of the paper presented here belong to the individual
author(s) and/or other copyright owners. To the extent reasonable and practicable the
material made available in WRAP has been checked for eligibility before being made
available.
Copies of full items can be used for personal research or study, educational, or not-for profit
purposes without prior permission or charge. Provided that the authors, title and full
bibliographic details are credited, a hyperlink and/or URL is given for the original metadata
page and the content is not changed in any way.
Publisher’s statement:
“© 2016 IEEE. Personal use of this material is permitted. Permission from IEEE must be
obtained for all other uses, in any current or future media, including reprinting
/republishing this material for advertising or promotional purposes, creating new collective
works, for resale or redistribution to servers or lists, or reuse of any copyrighted component
of this work in other works.”
A note on versions:
The version presented here may differ from the published version or, version of record, if
you wish to cite this item you are advised to consult the publisher’s version. Please see the
‘permanent WRAP URL’ above for details on accessing the published version and note that
access may require a subscription.
Abstract – Molecular communication is a paradigm that utilizes molecules to exchange information between nano-machines. When considering such systems where multiple receivers are present, prior work has assumed for simplicity that they do not interfere with each other. This paper aims to address this issue
and shows to what extent an interfering receiver, RI, will have an
impact on the target receiver, RT, with respect to Bit Error Rate
(BER) and capacity. Furthermore, approximations of the Binomial distribution are applied to reduce the complexity of calculations. Results show the sensitivity in communication performance due to the relative location of the interfering
receiver. Critically, placing RI between the transmitter TX and RT
causes a significant increase in BER or decrease in capacity.
Index Terms— Bit Error Rate, Broadcast Channel, Channel Capacity, Diffusion-based Molecular Communications.
I. INTRODUCTION
OLECULAR communication is a recently established paradigm that utilizes molecules to exchange information between nano-machines [1]. In a fluidic medium, with no drift, the essential premise is that the information molecules are released at the transmitter and then propagate via diffusion until they reach a receiver where it will be absorbed and removed from the environment. To date, there have been several key papers that address the characteristics of the channel for point to point (PTP) transmission systems, for example [2]–[7]. However, scenarios where multiple transmitters communicate with multiple receivers, such as the multi-access channel or the broadcast channel in molecular communication, have not yet received as much attention as the topic deserves. Existing papers on this subject include [8]–[12]. Given the scale of work regarding the broadcast channel in conventional communication systems, and the prevalence of multiple-input multiple-output in natural molecular communication system [9], [10], this knowledge gap within molecular communication systems is thus important to redress.
The investigations in [11] and [12] aimed to analyze the broadcast channel where a single transmitter communicates
Yi Lu, Mark S. Leeson and Yunfei Chen are with the School of Engineering, University of Warwick, Coventry, CV4 7AL, UK.
Matthew D. Higgins is with the WMG, University of Warwick, Coventry, CV4 7AL, UK.
Email: {yi.lu; m.higgins; mark.leeson; yunfei.chen}@warwick.ac.uk. Adam Noel is with the School of Electrical Engineering and Computer Science, University of Ottawa, Ottawa, ON, K1N 6N5, Canada.
Email: anoel2@uottawa.ca.
Manuscript accepted:13 October 2016.
(a)
[image:2.595.309.548.210.468.2](b)
Fig. 1. Molecular communication system with two absorbing receivers. (a) RI
is placed on the z-axis. (b) RI is placed on a circle.
with multiple receivers and provided subsequent capacity calculations. However, the current literature generally assumes that the signal at each receiver is independent, receiving molecules as if other receivers were not present, i.e. effectively treating the system as multiple PTP communication channels. Unlike conventional Radio Frequency (RF) electromagnetic communications where the receivers are generally regarded as not being able to interfere with each other [13], for a molecular communication system with multiple absorbing receivers, the receivers do interfere with each other as the absorbed molecule cannot be captured by any other receivers.
In this paper, in order to investigate how the receivers influence each other, we consider a communication system with one transmitter and two receivers. As shown in Fig. 1, one transmitter, TX emits molecules into a channel with two
identical receivers that can absorb the same type of molecule. One receiver is defined as the target receiver, RT, whilst the
other is defined as the interfering receiver, RI. If we use the
independence assumptions of [11] and [12], then there would be no molecule ‘sink’ or ‘absorption’ component caused by the presence of the interferer. This further implies that the performance of the system with respect to the target receiver is
The Effect of Two Receivers on Broadcast
Molecular Communication Systems
Yi Lu
, Matthew D. Higgins,
Senior
Member
,
IEEE
, Adam Noel,
Member
,
IEEE
,
Mark S. Leeson,
Senior Member
,
IEEE
and
Yunfei Chen,
Senior Member
,
IEEE
likely to be overestimated.
This paper aims to clearly show the influence of RI on RT as a
function of their relative positions. In this paper, two studies of the effects of positions of RI on RT are presented, see Figs. 1(a)
and (b). For both studies, a fixed position of TX and RT is
considered. Fig. 1(a) shows the first study, where RI and RT are
centered on the same line, i.e. fixed x and y coordinates. Each receiver’s location is defined by the z-coordinate of its center. Three positions of RI will be investigated. Scenario 1 considers
that RI is located to the left of both TX and RT. Scenario 2
considers that RI is between TX and RT. Finally, Scenario 3
considers that RI is located to the right of both TX and RT. Fig.
1(b) shows another study, where the positions of TX and RT are
the same as the first study, however, RI is placed on a circle that
is centered at the origin and the radius of this circle is the distance between TX and RI. In this study, four scenarios are
investigated, the details of which are given in Section V. At each of these positions the impact on the Bit Error Rate (BER) and channel capacity of the communication link between TX
and RT, which can be represented as the target link, will be
shown.
This paper will therefore present and contribute the following:
Firstly, a two-receiver broadcast communication channel with a three-dimensional diffusion-based propagation model is simulated for a molecular communication system with absorbing receivers. One of the important parameters of performance analysis, capture probability, can be obtained through this simulation. According to the analysis of capture probability, interference exists between the two receivers, and each communication channel should therefore not be simply modeled as a PTP channel. It is believed that this is the first paper to show this in the literature.
Secondly, the channel model is analytically studied for molecular communications, where a detailed explanation and derivation of the arrival model is provided to help the reader more easily understand why and how to use this model. Furthermore, the expressions for BER and channel capacity are derived with the consideration of an arbitrary length of Inter Symbol Interference (ISI).
Thirdly, two studies of the positions of RI are presented. First,
the position of RI is studied by varying its location on the
z-axis. Second, the position of RI is changed along a circle.
Thus, the study of positions of RI includes both
one-dimensional case and two-dimensional case.
Finally, the impact of the introduction of the interfering receiver with respect to its relative location is investigated by analyzing the performance of the target link.
The remainder of this paper is organized as follows. The diffusion-based molecular communication model is given in Section II. The channel model is investigated in Section III. In Section IV and Section V, the numerical results for both studies are presented and analyzed. Finally, the paper is concluded in Section VI.
II. DIFFUSION –BASED MOLECULAR COMMUNICATION MODEL
In this work, the three-dimensional random walk is used to describe the molecular diffusion process. If the Cartesian coordinates of the kthmolecule at time t are (x
k(t), yk(t), zk(t)),
then the coordinates of this molecule at time t+Δt are given by [14]:
1
( ) ( ) 2 ,
k k
x t t x t
D t (1)2
( ) ( ) 2 ,
k k
y t t y t
D t (2)3
( ) ( ) 2 ,
k k
z t t z t
D t (3) where ζ1, ζ2andζ3are independent random numbers sampledfrom a Gaussian distribution with mean 0 and variance 1. D is
the diffusion coefficient and Δt is the time step.
A number of molecules are released as an impulse at the beginning of each time slot from coordinates (x0, y0, z0) (i.e., (0,
0, 0)). For the diffusion process, each moleculeexecutes a random walk in three-dimensional space that follows (1)-(3), and each one moves independently of all other molecules [14]. For the reception process, a molecule is absorbed if it is within one of the receivers at the end of a time step. Once it has been absorbed, it is eliminated. The receiver can decode the information by counting the number of received molecules at the end of the time slot. In this work, we assume that the transmitter and receiver are synchronized [15], [16] and receivers can count the number of received molecules during a time slot [10].
The ability that a molecule can be captured by the receiver is denoted as the capture probability. The expression of the capture probability for a PTP molecule communication system is given in [17]. However, the analytical expressions for the capture probability with respect to time for the multi-receiver system are still unknown. Therefore, here, the capture probability for each receiver is obtained via simulation process. In the simulation, the number of received molecules at each receiver in 105 trials can be obtained by taking a large time slot
duration, ts, (5000s). Thus, the capture probability of a
molecule at a receiver can be calculated using the number of received molecules divided by the total number of trials.
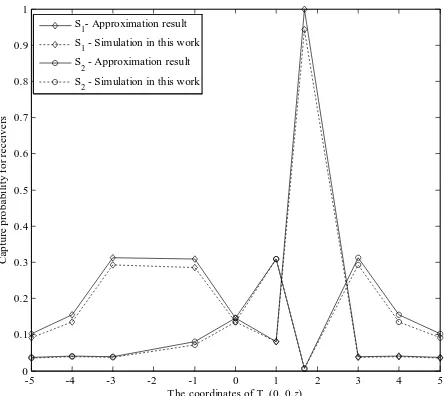
The simulation process has been compared with the model for two absorbing spheres in [18] to validate the correct behavior of the simulation process. There, the authors introduced a scenario where molecules located at coordinates (0, 0, z) diffuse to a pair of receivers S1 and S2 located at (0, 0, l/2)
and (0, 0, -l/2) respectively, where l is an arbitrary distance. For this scenario, the analytical and approximation capture probabilities for S1 and S2 are given when the diffusion time is
large enough (i.e., as t →∞). Comparisons in [18] show a strong agreement between the analytical and the approximation results. Thus, only the asymptotic capture probabilities found using the approximate expressions are compared with simulation in this work.
The approximations for capture probability p1,ap with S1 and
p2,ap with S2 were introduced as [18, Eq. (4.20)]:
2
2
2
1,ap ra 1 1 ra ra 2 1 ra ,
2
2
2
2,ap ra 2 1 ra ra 1 1 ra .
p r r r l r r l r l (5) where rra is the radius of the receivers, r1 and r2 are the distances
between the TX and the centers of the two receivers.
As shown in Fig. 2, the capture probabilities found using the approximate expressions (4) and (5) are compared with the simulation results. The parameters used in this comparison agree with [3] and [18], where l= 4μm, rra = 0.31487μm, and D
= 79.4μm2s-1.
The R-square coefficient [19] of determination is introduced to measure the goodness of fit between simulation results and results from approximations. The closer this value is to 1, the better the fit of the simulation is, and is given by:
2
R
1 SSE SST,
(6)where SSE is the sum of squared errors of prediction and SST is the sum of squares of the difference between the dependent variable and its mean. The R-square for S1 and S2 are 0.9935
and 0.9910 respectively. This comparison confirms that the results from this simulation process are accurate.
III. CHANNEL ANALYSIS
The influence of RI on RT can be reflected in the performance
of the target link. Thus, the focus here is the analysis of the target link.
The value of ts used in Section II is too large to be used in a
communication system. Thus, this value can be determined by finding the time at which 60% of molecules arrives at the RT
[3]. The capture probability for RT within one time slot, PT(rT,
ts), can be recomputed via the same simulation process
introduced in Section II, where rT is the distance between the TX
and RT.
Considering an on-off keying modulation scheme, the system transmits information via the release, or not, of molecules from the TX. A ‘1’ is represented by a specific
number of molecules released from the TX, and ‘0’ is
represented by an absence of released molecules. At the receiver, when the number of molecules exceeds a pre-designed threshold τ, the symbol is denoted as a ‘1’; otherwise, denoted as a ‘0’. Considering that N information molecules are released as an impulse at the start of the time slot, the threshold τ can be determined by finding the minimum BER for τ∈ [1, N].
Following [3], the number of molecules received by the receiver out of the current N molecules released in the current time slot, N0, follows a Binomial distribution:
0 ~ , T T, s .
N B N P r t (7)
The transmitted molecules cannot be guaranteed to reach the receiver within one time slot, which can cause ISI. In this work, we consider a memory channel with an ISI length I. Molecules that do not reach a receiver within one time slot may arrive in a future time slot. We denote Ni as the number of molecules that
were released at the start of the ith time slot before the current
one and arrive in the current time slot.
Consider that Ni (Ni= y) interfering molecules are received in
the current time slot amongst those remaining molecules. Thus
[image:4.595.309.533.85.283.2]Fig. 2. Comparisons of capture probabilities between approximation and simulation results with a large simulation time.
the probability density function of Ni= y, Pr(Ni= y) can be
derived as:
r 0 0
0
0
0
P P P
1 1
1 1 1
1
N
i r i ,i r ,i
x N
N x y N x
y x
x
N y
y x N y x
x
y
N y N y| N x N x
N x N
q q p p
y x
N N y
q p p p q
y x
N N y
q p y x
01 1 ,
N y
N y x x
x
p p q
(8)and then, by applying the Binomial theorem [20], we derive
r
P 1 1 1
1 1 1 ,
y i
y N y
N
N y q p p p q
y N
q p q p
y (9)
where N0,i is the number of molecules absorbed during (0, i·ts),
N0,i ~ N(NPi, NPi(1 – Pi)), p = Pi = PT(rT,i·ts), and q is the
probability that a molecule can be absorbed in the current time slot for the ith transmission, i.e., q = (P
i+1 – Pi)/(1 – Pi), where
i = 1, 2, .. I.
Equation (9) obviously shows that Ni follows a Binomial
distribution:
, (1 )
1
~ , i i .
i N q p ~
N B B N P P (10)
Due to the effects of ISI, the influence from previous consecutive symbols must be considered. However, the summation of Binomial distributions is hard to compute. Thus, N0 and Ni can be approximated using the Gaussian
approximation N0;G, Ni;G and the Poisson approximation N0;P,
Ni;P, respectively:
0;G ~ 1, 1 1 1 ,
N N NP NP P (11)
0 ;P ~ 1 ,
N P NP (12)
-5 -4 -3 -2 -1 0 1 2 3 4 5
0 0.1 0.2 0.3 0.4 0.5 0.6 0.7 0.8 0.9 1
The coordinates of TX (0, 0, z)
C ap tu re p ro b a b il it y f o r re c ei v e rs
S1- Approximation result S1 - Simulation in this work S2 - Approximation result S
1 1
;G , 1 1
~
, ,
~
i i i
i i i
i i
i
N N P P N P P P P
N N (13)
P 1 ; ~ ,i N Pi Pi
N P (14)
where ϖi = N(Pi+1 – Pi) and γi = N(Pi+1 – Pi)(1 – Pi+1 + Pi ).
For a memory channel with an ISI length I, 2I different bit sequences may be generated based on the different permutations of I previous information symbols. The total number of molecules received in the current time slot is composed of molecules sent at the start of the current time slot, and the number of molecules sent from the start of all I previous time slots. Thus, the total number of molecules received in the current time slot using the Gaussian and Poisson approximations, i.e., Nc;G and Nc;P respectively can be
calculated as:
c;G c 0;G c ;
c c 1 1 c
1 1
G 1
c 1
~ , 1 ,
I I
i i i i
i i I i i i a N a
N a N
a NP
a NP P a
N (15)
c 0;P c ;P 1 c 1 P c 1 1 c; ~ , I i i i I
i i i
i
a N a N
a NP a N P
N P
P (16)where {ac-i, i = 0, 1, 2, .., I} represents the transmitted
information bits in binary form for the current and all previous I symbols.
An error occurs when there is a difference between the transmitted symbol and the received symbol. When ‘0’ is transmitted, but ‘1’ is received, the error probability for the Gaussian and Poisson approximations can be computed as:
1 tx tx 01;G, 1 01, tx tx 0 r ; 1 c , , G P 1 1 , = j j j j j I j j j I p p p pP N
(17)
1 tx tx 1 tx t 01 x 01,;P, Pr c; P,
1
1 1 Q 1, ,
j j j j j j I I j p p p N p
P
(18) where:
01, c , 01, c ,
1 1
01, c , 1
1
, ,
,
I I
j i j i j i j
i i
I
j i
i
j i i
i
a a
a N P P
(19){ac-i,j i = 1, 2, ..., I} is the binary message sequence of the bit
sequence j, and j = 1, 2, …, 2I, is the bit sequence index. ptx is the transmitted probability of bit ‘1’. Pr(Nc;G/P,j > τ) is the
probability of Nc;G/P,j > τ, and αj is the number of ‘1’s in the bit
sequence j. Φ(·) is the cumulative distribution function of standard Gaussian distribution, and Q(·) is the regularized gamma function.
Conversely, when a ‘1’ is transmitted, but a ‘0’ is received, the error probability for the Gaussian and Poisson approximations can be given as:
1 tx tx 1 10, tx 10;G tx 10,, Pr c;G,
1 1 . j j j j I j j I j j p p p P p N (20)
1 tx tx 1 tx t 10; xP, r c
10, ; P, P
1
1 Q 1,
. j j j j j j I I j p p p P N p (21) where:
10, c , 10, 1 1 c ,
1 1 10, c 1 , 1 1 1
, 1 .
.
I I
j i j i j i j
i i
I
j i j i i
i
i
N a NP P a
a N P P P NP
(22)Thus, the BER for the target link, PTe,can be derived as:
Te 01 10 2 01;G/P, 10;G/P, 1 + = , I j j j
P P P
P P
(23)where P01;G/P, j = P01;G, j or P01;P, j and P10;G/P, j = P10;G, j or P10;P, j.
The selection is based on the approximation model that will be used for the analysis in the designed system.
Consider that the binary input and the output of the single channel can be represented as X ={X1, X2, …, Xk}and Y = {Y1,
Y2, …, Yk} respectively. Therefore, the capacity of the memory
channel for a system with an impulsive on-off keying scheme can be calculated as [21, Eq. (1.2)]:
tx 1
1
lim max ; ,
k
i i k p
i
C X Y
k
I (24)where I(Xi;Yi) is the mutual information defined as [22, Eq.
(5)]:
tx 01 tx 10
tx 10 tx 01
; |
1 1
1 1 1 ,
i i i i i
X Y H Y H Y X
p P p P
p P p P
I H H H (25)
where H(δ) = – δlog2δ – (1 – δ)log2(1 – δ).
For a memory channel with an ISI length I, after the Ith
symbol, the detection of emitted molecular signal will be affected by the I most recent previous signals. According to (17)-(23), it can be deduced that the average error probability stays constant after the Ith symbol, thus:
X Yi; i
XI1;YI1
, I i k .I I (26)
tx
tx
tx
tx
1
1 1
1 1
1 1 1
lim max ;
1 1
lim max ; ;
0 lim max ;
max ; .
k
i i k p
i
I k
i i i i
k p
i i I
I I k p
I I p
C X Y
k
X Y X Y
k k
k I
X Y k
X Y
I
I I
I
I
(27)
The channel capacity for the target link with the Gaussian and Poisson approximations can be derived by substituting the corresponding equations for each approximation into (27).
IV. NUMERICAL RESULTS FOR THE FIRST STUDY In this section, the numerical results for the first study are presented. The capture probability of RT, and the BER and
capacity of the target link are given based on the simulation and theoretical derivation. The performance of a PTP communication system is compared against a single receiver, RS, where the transmission distance between TX and RS is rS =
7μm. The set of simulation parameters is shown in Table I. The TX and RT are placed in fixed positions (0, 0, 0) and (0, 0,
7μm), and the coordinates of RI (0, 0, zI,) are variable with
zI∈ {-7, -4, -2, 2, 4, 10, 12, 14}μm. We denote rI-, rI+ and rI++ as the distance between the TX and RI in Scenarios 1, 2, and 3,
respectively.
Using the simulation process introduced in Section II, the capture probabilities of RT with different positions of RI and RS
are illustrated in Fig. 3. The results show that all capture probabilities increase with increasing simulation time. When the simulation time is long enough, the capture probability appears to converge. It can also be seen that for different positions of RI, the capture probabilities of RT are different.
They are all smaller than the capture probability of RS. For the
two-receiver system, the maximum and minimum values of capture probabilities of RT occur in Scenario 3 with rI++ =
14μm, and Scenario 2 with rI+ = 2μm respectively. These
results illustrate that the capture ability of RT is weakened and
have thus shown the different levels of impact due to the existence of RI. This is because RI absorbs information
molecules that could have arrived at RT. Furthermore, for
different positions of RI, the ability to absorb the information
molecules is different which is also reflected in the values of capture probabilities of RT. Finally, the RI has the greatest
impact when it is literally blocking the RT, i.e., when RI is
placed between TX and RT. These results demonstrate that
treating the two-receiver molecular communication as two PTP molecular communication models is inappropriate.
[image:6.595.306.545.87.451.2]In Section III, the BER and channel capacity were analyzed for the Gaussian and Poisson approximations. In order to determine which approximation is more accurate for this work, the cumulative density functions (CDFs) of the number of received molecules for the Gaussian and Poisson models are compared with the CDF of the simulation results. The Root Mean Squared Error (RMSE) is introduced as follows [24, Eq. (8)]:
TABLE I Parameters setting
Parameters Definition Value D
rra
Δt
rI,
rT
rS
I (x0, y0, z0)
(0, 0, zI)
(0, 0, zT)
Diffusion coefficient Radius of receivers
Time step Distance between TX and RI
Distance between TX and RT
Distance between Tx and RS
ISI length Coordinate of TX
Coordinate of RI
Coordinate of RT
79.4μm2/s
1μm
0.0001s Variable
7μm 7μm
10 [23] (0, 0, 0) Variable
[image:6.595.80.285.90.186.2](0, 0, 7μm)
Fig. 3. The comparisons of capture probabilities between RT and RS.
2sim G/P
0 1
RMSE CDF CDF ,
1 i
N
i i
x
x x
N
(28)where CDFsim and CDFG/P are CDFs of the simulation results
and the Gaussian or Poisson model results, respectively. Figs. 4 (a) and 4 (b) show the RMSE of CDFs for PTP system with rS= 7μm and the two-receiver system with rT = 7μm,
respectively. The results indicate that the RMSE of the Poisson model is more stable as N varies. However, the Gaussian model obviously improves with increasing N. As shown in Fig. 4(a), the Poisson model is more accurate for N < 4000, after which the Gaussian model is better. The BER against the number of molecules per bit is also presented in this figure. When N < 4000, a BER level as low as 10-9 can be measured for both the
Gaussian and Poisson models. In this case, the Poisson model is preferred for a PTP communication system based on the lower RMSE values. For the target link of the two-receiver system in Fig. 4(b), the RMSEs are measured for different distances of RI.
The results show that the values of the RMSE of the Poisson model are always lower than the values obtained from the Gaussian model for N = 0 ~ 10000. Thus, the Poisson approximation is considered in this analysis.
0 0.5 1 1.5 2 2.5 3 3.5 4 4.5 5 0
0.02 0.04 0.06 0.08 0.1 0.12 0.14
Time(s)
C
ap
tu
re
P
ro
b
a
b
il
it
y
r
S = 7m
r
I- = 7m
r
I- = 4m
r
I- = 2m
r
I+ = 2m
r
I+ = 4m
r
I++ = 10m
r
I++ = 12m
r
I++ = 14m
2.6 2.7 2.8 2.9
Fig. 4. RMSE of CDFs for (a) PTP system with rS= 7μm (b) Two-receiver
system with rT= 7μm.
The BERs and capacities of the target link of the two-receiver system with rT= 7μm and the PTP system with rS
= 7μm are presented in Fig. 5(a) and Fig. 6. The numerical
results clearly show that increasing the number of molecules leads to a lower BER and higher capacity. The performance ranking is consistent with the capture probabilities show in Fig. 3. Thus, the lowest BER and also the highest capacity is provided by the PTP system, and the lowest and highest BERs of the target link occur in Scenario 3 with rI++ = 14μm and
Scenario 2 with rI+ = 2μm, respectively. The BERs at N = 5000
for different values of zI are shown in Fig. 5(b). O1 and O2 are
the regions that RI overlaps with the TX and RT respectively.
The overlap between RI and TX or RI and RT is physically
unrealizable, thus, these two regions are not considered. This figure directly shows the BER trend of the target link with varying positions of RI. As RI changes position from Scenario 1
to Scenario 2 to Scenario 3, the BER increases at first and when
Fig. 5. (a) BER comparisons between the target link with different positions of RI and the PTP system, ptx = 0.5 (b) BER with different values of zIat N = 5000. it arrives at the closest position to TX in Scenario 2, the BER
reaches a maximum, and then the BER decreases. Both BER and capacity imply that the RI’s existence does reduce the
reliability of the target link, and due to the significant impact, the positions of the RI in Scenario 2 are especially undesirable
for RT, where the reliability of the target link is the worst of the
three Scenarios. In Scenario 2, the RT is effectively blocked by
RI, and the capture ability of RI and RT reach their highest level
and lowest level, respectively. Thus, the worst performance of RT is obtained. The impact of RI in Scenario 1 and Scenario 3
are very similar, except when rI- = 2μm, i.e., when the RI is very
close to the TX. The distance variations of RI in Scenario 3 and
Scenario 2 cause the smallest and the biggest change in both BER and capacity respectively. The increase in distance between RI and TX leads to decreasing and increasing the
capture probability of RI and RT respectively. Thus, in each
scenario, the further the distance between the RI and TX, the less
the impact on RT.
0 1000 2000 3000 4000 5000 6000 7000 8000 9000 10000 0.0005
0.001 0.003 0.01 0.02
Number of molecules per bit (N) (a)
R
M
S
E
Gaussian, rS = 7m
Poisson, rS = 7m
100 200 500 1000 2000 4000 10-8
10-6 10-4 10-2 100
Number of molecules per bit (N)
B
E
R
Gaussian, rS = 7m Poisson, rS = 7m
0 1000 2000 3000 4000 5000 6000 7000 8000 9000 10000 10-4
10-3 10-2 10-1
Number of molecules per bit (N) (b)
R
M
S
E
rI- = 7m
rI- = 4m
rI- = 2m
rI+ = 2m
rI+ = 4m
rI++ = 10m
rI++ = 12m
rI++ = 14m Gaussian Approximation Poisson Approximation
9400 9500 9600 9700 9800 9900 10000
10-3.29
10-3.27
10-3.25 10-3.23
10-3.21 10-3.19
10-3.17
10-3.15
100 500 1000 2000 5000 10000 20000 10-9
10-8 10-7 10-6 10-5 10-4 10-3 10-2 10-1 100
Number of molecules per bit (N) (a)
B
E
R
r
S = 7m
r
I- = 7m
r
I- = 4m
r
I- = 2m
r
I+ = 2m
r
I+ = 4m
r
I++ = 10m
r
I++ = 12m
r
I++= 14m
10-4
-7 -6 -4 -2 0 2 4 5 9 10 12 14 10-9
10-8 10-7 10-6 10-5
z
I
(b)
B
E
R
N = 5000
O1 O2
[image:7.595.46.281.85.523.2]Fig. 6. Channel capacity comparisons between the target link with different positions of RI and the PTP system.
V. NUMERICAL RESULTS FOR THE SECOND STUDY
In this section, the second study of the effect of positions of RI on RT is presented. Similar to the first study, the numerical
results focus on the capture probability of the RT, and the BER
and channel capacity of the target link. A comparison of these results between the two-receiver system and the PTP system are also presented. In the simulation, rI= 5μm, and the coordinate
of RI, (xI, 0, zI) is variable. All other parameters are the same as
in Table I.
As shown in Fig. 1(b), the TX and RT are placed in fixed
positions (0, 0, 0) and (0, 0, 7μm), and RI is placed on a circle
that is located in the xz-plane and centered at the origin. To distinguish these scenarios from those that were considered in the first study, here, the four scenarios are labeled as Scenario 4 to Scenario 7. The scenarios and the corresponding positions of RI are shown in Table II.
In this study, the position of RI is changing from P1 to P14 in
sequence. Fig. 7 shows the comparisons of capture probabilities between RT with different positions of RI and RS. As in the
previous study, a PTP molecular communication system gives the maximum value of capture probability. The best and worst case in the two-receiver system occurs in P8 and P1 respectively. When varying the positions of RI according to
above order, the distance between RI and RT increases first and
when RI is placed in P8, the distance between RI and RT reach
the maximum value, after that, this distance begins to decreases. The increase of the distance between RI and RT leads
to an increasing of the capture probability of RT. On the
contrary, the decrease of this distance increases the impact of RI
on RT which results in a decreasing of the capture probability of
RT. In addition, the values of capture probability of RT are very
similar when RI arrives at those positions which are
symmetrical about the z-axis (e.g. P2 and P14). The positions of RI in Scenario 5 and Scenario 6 change to the capture
probabilities of RT are fairly minor compare with positions in
[image:8.595.306.545.92.310.2]Fig. 7. The comparisons of capture probabilities between RT and RS. TABLE II
Scenarios and positions
Scenario 4 Scenario 5 Scenario 6 Scenario 7 P1(0,0,5) P6(4,0,-3) P9(-3,0,-4) P11(-5,0,0) P2(2,0,4.58) P7(3,0,-4) P10(-4,0,-3) P12(-3,0,4) P3(3,0,4) P8(0,0,-5) P13(-3,0,4)
P4(4,0,3) P14(-2,0,4.58)
P5(5,0,0)
Unit: μm
Scenario 4 and 7. This is because the positions of RI in Scenario
4 and Scenario 7 will be easier for the RI to capture the
information molecules that could be absorbed by RT, especially
when RI is located at P1.
On the basis of the above analysis, the capture probability curves from P6 to P10 are very similar and differ only slightly from each other. Thus the changes of positions of RI in Scenario
5 and 6 have similar effects on RT. In addition, the capture
probabilities of RT are very similar when positions of RI are
symmetrical about the z-axis. Therefore, for the remainder of this work, only P1, P2, P3, P4, P5 and P8 are needed for the analysis of BER and channel capacity of the target link.
The RMSE as a decision metric was used in Section IV to determine which approximation is suitable for the proposed system. Employing the same decision method, the Poisson approximation is also selected for use in this study. Fig. 8(a) and Fig. 9 show the BER and capacity of the target link when considering different positions of RI. The results indicate that
an increase in the distance between RI and RT leads to
decreasing BER and increasing capacity. The worst and the best performance occurs in P1 and P8, respectively. Fig. 8(b) show the BER of the target link with different positions of RI at
N = 5000, it clearly shows a BER trend of the target link with the varying positions of RI. As the position of RI changes from
scenario 4 to Scenario 5 to Scenario 6 to Scenario 7, the BER decreases first and when it arrives at the farthest distance from RT, which is P8, the lowest BER is obtained and after that, with
200 400 600 800 1000 1200 1400 1600 1800 2000 0.3
0.4 0.5 0.6 0.7 0.8 0.9 1
Number of molecules per bit ( N )
C
ap
a
ci
ty
r
S = 7m
r
I- = 7m
r
I- = 4m
r
I- = 2m
r
I+ = 2m
r
I+ = 4m
r
I++ = 10m
r
I++ = 12m
r
I++ = 14m
270 280 290 300 310 320 330
0.855 0.86 0.865 0.87 0.875 0.88 0.885
0 0.5 1 1.5 2 2.5 3 3.5 4 4.5 5 0
0.02 0.04 0.06 0.08 0.1 0.12 0.14
T ime(s)
C
ap
tu
re
P
ro
b
a
b
il
it
y
r
S = 7m
P1 P2 P3 P4 P5 P6 P7 P8 P9 P10 P11 P12 P13 P14
1.46 1.48 1.5 1.52 1.54 1.56 1.58
Fig. 8.(a) BER comparisons between the target link with different positions of RI and the PTP system, ptx = 0.5 (b) BER with different positions of RIat N =
5000.
decreasing distance between RI and RT, the BER increases
again. This study illustrates that when considering the positions of RI that have the same distance from TX, the further the
distance between RI and RT, the less the impact on RT.
VI. CONCLUSION
In this paper, the two-receiver broadcast channel for molecular communications system has been simulated and the idea of an interferer node RI and the effect of its location on RT
are introduced. The channel model was then analyzed with both the Gaussian approximation and the Poisson approximation. The RMSE [24] is applied as a metric to determine which approximation is better for the system. Here, two studies of the effect of positions of RI on RT are provided. Through the
[image:9.595.47.285.86.522.2]simulation and theoretical derivations, the impact of the
Fig. 9. Channel capacity comparisons between the target link with different positions of RI and the PTP system.
position of RI on RT is shown via the BER and channel capacity
of the target link. The results indicate that different positions of RI relative to TX and RT have varying effects on RT, especially
when the RT is completely blocked by RI, i.e., the positions in
Scenario 2 and P1 in Scenario 4. In addition, for all scenarios, the further the RI is away from TX or RX, the better performance
of the target link can be achieved. Furthermore, the performance of the target link of the two-receiver system is always worse than the performance of the PTP system when considering the same parameters. Therefore, the use of the PTP approximation should not be used for a broadcast system with absorbing receivers as it cannot guarantee, or predict, the reliability of the signal at a given receiver.
It can also be concluded from this work that these new findings should open up further avenues of research. The absorbing receiver is in fact an idealization in comparison to binding receivers (either reversibly or irreversibly) with finite kinetic rates and thus the results here provide an upper bound on the performance degradation due to the interfering receiver. Thus, there would be some interesting work to carry out in understanding the design and placement more specifically for an absorbing receiver as found in drug delivery systems as the design may limit the side effects of the drug delivery system [25].
Furthermore, whilst the focus of this paper has been at the physical layer, further work is also possible at other levels of the stack. Particular interest may be found in optimizing the addressing scheme to minimize the effects from the interfering receivers [26]. In addition, emphasis on either the hidden and/or exposed receiver, as typical concepts of wireless networks, can also be investigated.
Finally, this work, has introduced to the literature the notion of a single interfering receiver but naturally, extensions can be seen found in analyzing multiple interfering receivers at all layers of the stack.
100 500 1000 2000 5000 10000
10-9 10-8 10-7 10-6 10-5 10-4 10-3 10-2 10-1 100
Number of molecules per bit ( N ) (a)
B
E
R
rS = 7m P1 P2 P3 P4 P5 P8
10-5
P1 P2 P3 P4 P5 P6 P7 P8 P9 P10 P11 P12 P13 P14
10-8
10-7
10-6
Locations of RI (b)
B
E
R
N = 5000
Scenario 4 Scenario 5 Scenario 6 Scenario 7
200 400 600 800 1000 1200 1400 1600 1800 2000 0.4
0.5 0.6 0.7 0.8 0.9 1
Number of molecules per bit ( N )
C
ap
a
ci
ty
r
S = 7m
P1 P2 P3 P4 P5 P8
660 680 700 720 740 760
[image:9.595.309.544.86.296.2]REFERENCES
[1] I. F. Akyildiz, F. Brunetti, and C. Blázquez, "Nanonetworks: A new communication paradigm," Comput. Netw., vol. 52, pp. 2260-2279, Aug. 2008.
[2] M. Pierobon and I. F. Akyildiz, "A physical end-to-end model for molecular communication in nanonetworks," IEEE J. Sel. Areas Commun., vol. 28, pp. 602-611, May 2010.
[3] M. Ş. Kuran, H. B. Yilmaz, T. Tugcu, and B. Özerman, "Energy model for communication via diffusion in nanonetworks," Nano Commun. Netw., vol. 1, pp. 86-95, Jun. 2010.
[4] M. Ş. Kuran, H. B. Yilmaz, T. Tugcu, and I. F. Akyildiz, "Modulation Techniques for Communication via Diffusion in Nanonetworks," in IEEE Int. Conf. Commun. (ICC), Jun. 2011, pp. 1-5.
[5] M. Pierobon and I. F. Akyildiz, "Capacity of a Diffusion-Based Molecular Communication System With Channel Memory and Molecular Noise," IEEE Trans.Inf. Theory., vol. 59, pp. 942-954, Feb 2013.
[6] H. ShahMohammadian, G. G. Messier, and S. Magierowski, "Optimum receiver for molecule shift keying modulation in diffusion-based molecular communication channels," Nano Commun. Netw., vol. 3, pp. 183-195, Sep. 2012.
[7] H. B. Yilmaz, A. C. Heren, T. Tugcu, and C. B. Chae, "Three-Dimensional Channel Characteristics for Molecular Communications With an Absorbing Receiver," IEEE Commun. Lett., vol. 18, pp. 929-932, Jun. 2014.
[8] C. Lee, B. Koo, N. R. Kim, B. Yilmaz, N. Farsad, A. Eckford, et al., "Molecular MIMO communication link," in IEEE Comput. Communi. Workshops (INFOCOM WKSHPS), May. 2015, pp. 13-14.
[9] L. S. Meng, P. C. Yeh, K. C. Chen, and I. F. Akyildiz, "MIMO communications based on molecular diffusion," in IEEE Global Commun. Conf. (GLOBECOM), Dec. 2012, pp. 5380-5385.
[10] B. H. Koo, C. Lee, H. B. Yilmaz, N. Farsad, A. Eckford, and C. B. Chae, "Molecular MIMO: From Theory to Prototype," IEEE J. Sel. Areas Commun., vol. 34, pp. 600-614, Mar. 2016.
[11] B. Atakan and O. B. Akan, "On molecular multiple-access, broadcast, and relay channels in nanonetworks," in Proc. ICST BIONETICS, Japan, Dec. 2008, pp. 1-8.
[12] S. F. Bush, Nanoscale Communication Networks: Artech House, 2010. [13] W. Guo, C. Mias, N. Farsad and J. L. Wu "Molecular Versus
Electromagnetic Wave Propagation Loss in Macro-Scale Environments," IEEE Trans. Mol. Biol. Multi-Scale Commun., vol 1, pp. 18-25, Nov. 2015.
[14] H. C. Berg, Random Walks in Biology: Princeton University Press, 1993.
[15] L. Felicetti, M. Femminella, G. Reali, T. Nakano, and A. V. Vasilakos, "TCP-like molecular communications," IEEE J. Sel. Areas Commun., vol. 32, pp. 2354-2367, 2014.
[16] H. ShahMohammadian, G. G. Messier, and S. Magierowski, "Blind synchronization in diffusion-based molecular communication channels," IEEE commun. Lett., vol. 17, pp. 2156-2159, 2013. [17] M. S. Leeson and M. D. Higgins, "Error correction coding for molecular
communications," in IEEE Int. Conf. Commun.(ICC), 2012, pp. 6172-6176.
[18] H. Sano, "Solutions to the Smoluchowski equation for problems involving the anisotropic diffusion or absorption of a particle," The J. Chem. Phys., vol. 74, pp. 1394-1400, Jan. 1981.
[19] W. Mendenhall, R. Beaver, and B. Beaver, Introduction to Probability and Statistics: Cengage Learning, 2012.
[20] F. P. Miller, A. F. Vandome, and M. B. John, Binomial Theorem: Exponentiation, Summation, Natural Number, Pascal's Triangle, Formula, Combinatorics, Element (mathematics), Set (mathematics), Binomial Coefficient, Binomial Distribution: VDM Publishing, 2010. [21] S. Verdú and H. Te, "A general formula for channel capacity," IEEE
Trans. Inf. Theory, vol. 40, pp. 1147-1157, Jul. 1994.
[22] T. Nakano, Y. Okaie, and L. Jian-Qin, "Channel Model and Capacity Analysis of Molecular Communication with Brownian Motion," IEEE Commun. Lett., vol. 16, pp. 797-800, Jun. 2012.
[23] Y. Lu, M. D. Higgins, and M. S. Leeson, "Comparison of Channel Coding Schemes for Molecular Communications Systems," IEEE Trans. Commun., vol 63, pp. 3991-4001, Nov. 2015.
[24] H. B. Yilmaz and C. Chan-byoung, "Arrival modelling for molecular communication via diffusion," Electron. Lett., vol. 50, pp. 1667-1669, Nov. 2014.
[25] L. Felicetti, M. Femminella, G. Reali, and P. Liò, "Applications of molecular communications to medicine: A survey," Nano Commun. Netw., vol. 7, pp. 27-45, March 2016.
[26] T. Nakano, T. Suda, Y. Okaie, M. J. Moore, and A. V. Vasilakos, "Molecular communication among biological nanomachines: A layered architecture and research issues," IEEE Trans. Nanobiosci., vol. 13, pp. 169-197, Sept. 2014.
Yi Lu received the degree of Bachelor of Engineering with First Class Honors in Electronic Engineering from University of Central Lancashire, UK, in 2011. And then she obtained a Master degree of Engineering with Distinction in Electronic Engineering from University of Sheffield, UK, in 2012. She is currently a scholarship student pursuing a PhD study in Nano- communications at University of Warwick.
Matthew D. Higgins received his MEng in Electronic and Communications Engineering and his PhD in Engineering from the School of Engineering at the University of Warwick in 2005 and 2009 respectively. Remaining at the University of Warwick, he then progressed through several Research Fellow positions, in association with some of the UKs leading defence and telecommunications companies before undertaking two years as a Senior Teaching Fellow in Telecommunications, Electrical Engineering and Computer Science subjects. In July 2012, Dr Higgins was promoted to the position of Assistant Professor where his research focused on Optical, Nano, and Molecular Communications. As of March 2016, Dr Higgins was appointed as an Associate Professor at WMG working in the area of Connected and Autonomous Vehicles.
Mark S. Leeson received the degrees of BSc and BEng with First Class Honors in Electrical and ElectronicEngineering from the University of Nottingham, UK, in 1986. He then obtained a PhD in Engineering from the University of Cambridge, UK, in 1990. From 1990 to 1992 he worked as a Network Analyst for National Westminster Bank in London. After holding academic posts in London and Manchester, in 2000 he joined the School of Engineering at Warwick, where he is now a Reader. His major research interests are coding and modulation, molecular communications, optical communication systems and evolutionary optimisation. To date, Dr Leeson has over 230 publications and has supervised fifteen successful research students. He is a Senior Member of the IEEE, and a Fellow of both the UK Institute of Physics and the UK Higher Education Academy.