warwick.ac.uk/lib-publications
Original citation:
Yang, Bowei, Guo, Weisi, Chen, Bozhong, Yang, Guangpu and Zhang, Jie. (2016) Estimating
mobile traffic demand using
T
witter. IEEE Wireless Communications Letters .
Permanent WRAP URL:
http://wrap.warwick.ac.uk/78833
Copyright and reuse:
The Warwick Research Archive Portal (WRAP) makes this work of researchers of the
University of Warwick available open access under the following conditions.
This article is made available under the Creative Commons Attribution 3.0 (CC BY 3.0) license
and may be reused according to the conditions of the license. For more details see:
http://creativecommons.org/licenses/by/3.0/
A note on versions:
The version presented in WRAP is the published version, or, version of record, and may be
cited as it appears here.
Estimating Mobile Traffic Demand using Twitter
Bowei Yang
1, Weisi Guo
2*, Bozhong Chen
3, Guangpu Yang
3, Jie Zhang
3,4Abstract—In this paper, the authors show that structured social media data can act as an accurate predictor for wireless data demand patterns at a high spatial-temporal resolution. A case-study is performed on Greater London covering a 5000km2 area. The data used includes over 0.6 million geo-tagged Twitter data, over 1 million mobile phone data demand records, and UK census data. The analysis shows that social media activity (Tweets/sn) can accurately predict thelong-termtraffic demand for both the uplink and downlink channels. The relationship between social media activity and traffic demand obeys a power law and the model explains for over 71-79% of the variance in real traffic demand. This is a significant improvement over existing methods of long-term traffic prediction such as census population data (R2=0.57). The authors also show that social media data can also forward predictshort-termtraffic demand for up to 2 hours on the same day and for the same time in the following 2-3 days.
I. INTRODUCTION
Over the past few years, large volumes of data has been transforming businesses to deliver higher precision and more personalised services. Fine-grain traffic data can transform the business model of cellular network operators by enabling the deployment of small-cells [1]. Historically, Call Detail Record (CDR) based research, has yielded useful macroscopic statis-tical models on the spatial-temporal pattern of traffic demand. For example: the number of active users in a BS is ∼Pois(.)
distributed and the 3G traffic demand per user session is
∼ Log-N(.) distributed [2]–[4]. As operators seek to deploy small-cells to efficiently scale the overall network capacity and target traffic hotspots or signal blind-spots, there is a need to move from macroscopic traffic models to microscopic traffic modeling.
Small-cell deployment needs to consider a number of im-portant parameters [5], [6]: 1) high resolution traffic demand data over a small coverage radius (10-25m), 2) interference with adjacent cells, and 3) high resolution signal propagation modeling that is sensitive to building architecture and materi-als. In this paper, we focus on addressing challenge 1), which has received relatively little attention, but is crucial to the economic feasibility of the small-cell business. Traditionally, traffic is measured using CDR data, but as CDR is typically aggregated over the relatively large coverage area of macro Base Stations (BSs). Even with cooperative localization and antenna information, the accuracy is not sufficient for small
1School of Aeronautics and Astronautics, Zhejiang University, China. 2School of Engineering, University of Warwick, UK.3Department of
Elec-tronic and Electrical Engineering, University of Sheffield, UK.4RANPLAN,
Cambridge, UK. This research is partially supported by EU H2020 ”DE-CACE” project and the National Natural Science Foundation of China (NSFC) grant No. 61501399 and 61272467, and the EPSRC Centre for Doctoral Training in Urban Science and Progress (EP/L016400/1). *corresponding
author email: [email protected]
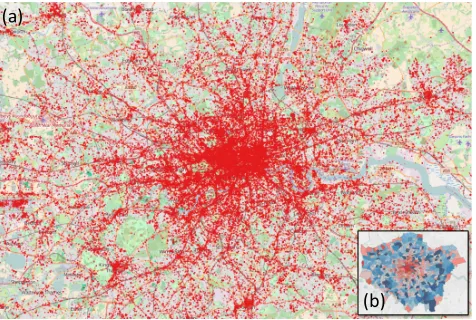
[image:2.612.320.558.151.311.2](b) (a)
Fig. 1: Twitter data in 5000km2 area centred on London: (a) 0.4 million geo-tagged data, (b) 0.6 million at ward level.
cell deployment and the BS data isoperator-specific. Alterna-tive methods that are operator-neutral have been prototyped in recent years include using mobile apps to mine device data usage [7]. However, both of these methods require large-scale participation from smartphone users, which is difficult to achieve without financial incentives.
On the other hand, large volumes of real time online social network (OSN) data can provide network operators with an opportunity to analyze and combine into existing cell planning and operational practices. The advantage of using social media data over operators own data are as follows: 1) it can discover the overall traffic demand across all wireless networks (RATs) and operators (i.e., the whole market, as opposed to its own), 2) it can uncover textual data about how people feel about various aspects of service (not analysed in this paper), and 3) it provides updated data demand: current base stations were deployed by the operator many years ago, and new data trends will have emerged due to changes in the city.
II. DATASETS ANDBASICCORRELATIONS
A. Data Sets and Metrics
In this particular paper, the authors utilize four data sets:
1) Structured Social Media Data:0.6 million geo-tagged
Tweets purchased from Twitter over a period of 2 weeks (time resolution in seconds) for the Greater London and surrounding suburbs area (40km radius from centre of London). An example of the Twitter data is mapped in Fig. 1a with ward level aggregate in Fig. 1b.
2) 3G Mobile Traffic Data: 1.2 million mobile phone
usage records - Uplink (UL) and downlink (DL) usage, data is aggregated to the ward level. The 3G packet-switched data traffic load (demand) is obtained from the core network over a period of 2 weeks, the time resolution of the data is on a minute basis.
3) 3G Base Station Data:BS location data for an operator.
4) Registered Population Data: ward population and
ge-ographical data from the 2011 UK census [12]. The data includes both residential (number of people per household) and business workforce data (number of employees per company).
In order to compare between data sets, the coefficient of determination R2 is used. It is a number that indicates how well the statistical regression model fits the data, or in other words: the percentage of variance explained by the model. For a data vectory= [y1, y2, ...yK](with meany) and a predicted data vector using the regression model yˆ, the residue vector is defined ase=y−yˆ. The coefficient of determination R2
is defined as R2 ≡1− Pke2k
P
k(yk−y)2. Adjusted R
2 is used in
this paper to take into account of additional fit parameters P, where adjustedR2= 1−(1−R2)KK−−P1−1.
B. Correlations for Existing Data
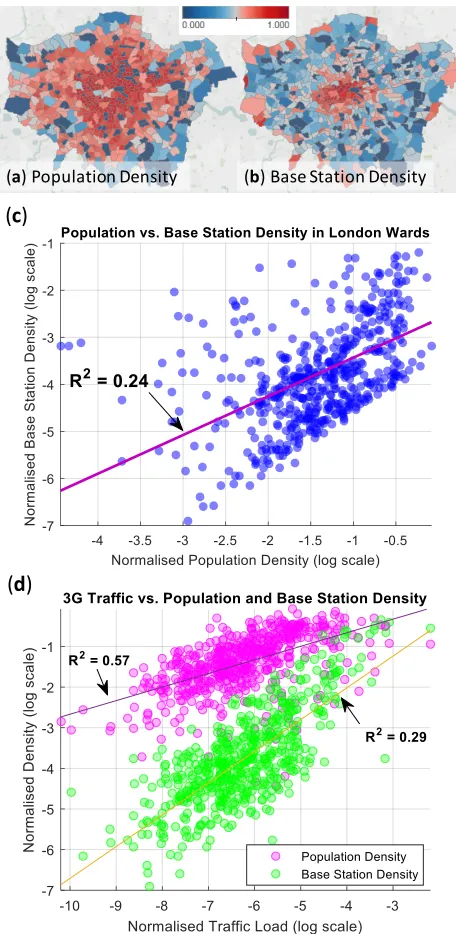
The population data of residents and businesses (see Fig. 2a) is widely used in traditional cell planning and spectrum pur-chases to both gauge the number of potential subscribers and estimate the long-term traffic demand. The data is an important input to deciding where BSs are deployed (see Fig. 2b). The paper first examines the correlation between macro BSs with existing registered population data from the UK census in order to establish a baseline. Fig. 2c shows a scatter plot of the spatial correlation of population density versus BS density in all the London wards. The regression result shows that there is a weak spatial correlation (adjusted coefficient of determi-nation, R2 = 0.24), indicating that other factors such as the number of commuters/tourists, historical mobile usage levels, and the local signal propagation account for the remaining 76% of the variance in BS deployment densities. Using the 3G traffic data, Fig. 2d shows a scatter plot of the spatial correla-tion between 3G traffic load (demand) versus both populacorrela-tion and BS density in London wards. The results show that there is weak spatial correlation (adjusted R2= 0.29) between the density of BSs and the 3G traffic demand, and an adequate spatial correlation (adjusted R2 = 0.57) between the census population data and the 3G traffic demand. We compare outlier wards to gain better understanding on why the traffic data
(a) Population Density (b) Base Station Density
(
c
)
[image:3.612.319.547.53.526.2](
d
)
Fig. 2: Normalised density in London Wards of (a) population density, (b) Base Station (BS) density, and scatter plots of: (c) population and BS density, and (d) 3G traffic load (Demand) vs. population and BS density.
-1.8 -1.6 -1.4 -1.2 -1 -0.8 -0.6 -0.4 -0.2 0 0.2 Number of Tweets/s (base 10 log scale)
0.5 1 1.5 2 2.5 3
3G Data Load, kb/s (base 10 log scale)
3G Traffic Load vs. Number of Tweets
3G Uplink 3G Downlink
R2 = 0.79
[image:4.612.324.544.58.243.2]R2 = 0.71
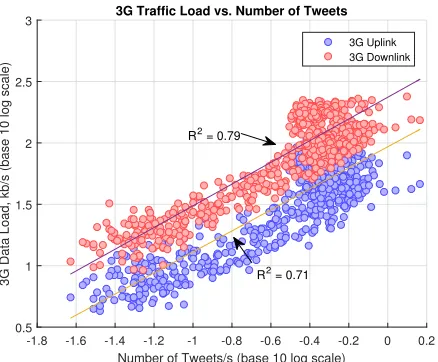
Fig. 3: Spatial Correlation of average 3G Traffic Load (De-mand) vs. Number of Tweets.
patterns, and static population census data alone cannot act as an accurate predictor for both the long-term traffic demand or the short-term traffic temporal patterns. In the following sections, the authors will examine how Twitter data can be used to provide a better estimate for long- and short-term traffic demand.
III. TRAFFICDEMANDESTIMATION USINGTWITTER
A. Long-Term Spatial Traffic Demand Estimation
One of the key metrics that drive small cell deployment is the expected traffic load (demand) in its small coverage area. For deployment of small cells, the short-term temporal variation of the traffic demand is of less interest than the long-term spatial variation. In order to obtain high spatial resolution data, the authors plot the spatial traffic demand pattern against the Twitter activity intensity over the Greater London area. Thehypothesisis that Twitter activity level can be used as a proxy for estimating the real wireless traffic demand in both the UL and DL channels. There has already been studies which show that the number of Tweets is highly correlated with the number of people in confined spaces (i.e., a stadium or an airport) [13]. Therefore, the authors in this paper go a step further and infer the traffic demand directly. The data available for analysis from Twitter records only UL Tweets, which consumes negligible bandwidth. Therefore, it is not immediately obvious on why small volumes of UL data should be representative of overall UL and DL data demand, especially given the variety of multimedia and social media applications. Yet, the authors hypothesize that Twitter activity is closely related to other multimedia activities, simply because average human behaviour associates Twitter uplink with all other mobile activities. In fact, in this section the authors show that Twitter activity level is highly correlated with both the UL and DL traffic demand.
In Fig. 3, the ward average 3G data load (UL and DL) is plotted against the number of Tweets per second. Each data point represents a ward, which approximately equals the
101 102 103 104 105 Lag (min)
0 0.1 0.2 0.3 0.4 0.5 0.6 0.7 0.8 0.9 1
Normalised Correlation Value
3G Traffic Load vs. Number of Tweets (Temporal)
3G Uplink 3G Downlink
2 hours
1 day
2 days
3 days
[image:4.612.63.282.60.241.2]6 days
Fig. 4: Temporal Correlation of average 3G Traffic Load (Demand) vs. Number of Tweets over 7 Days.
coverage area of a BS. The results show that a log-linear relationship exists between estimated traffic loadrˆ(kbps) and the Twitter activity leveln(Tweets/s):
log10(ˆri) =ailog10(n) +bi, (1)
where [aUL = 0.86 kb/Tweet bUL = 1.97 kbps], and [aDL =
0.88 kb/Tweet, bDL = 2.37 kbps]. Alternatively, this can be expressed as a power law: ˆri = 10bi(n)ai. A polynomial least-squares regression is used with the minimum number of parameters P that maximizes the adjusted R2 value, as increasing the parametersP will trade-off improved accuracy vs. a decreased adjusted R2 value. The correlation achieved is high: R2 = 0.71 for UL and R2 = 0.79 for DL. In other words, the regression model on Twitter data explains 71-79% of the variations in the 3G traffic data. The supports our initial hypothesis that OSN data can be used as a more reliable predictor for traffic demand than the census data. Furthermore, OSN data is operator neutral and radio-access-technology (RAT) neutral, potentially giving insight on all mobile customers. In general, it is also worth noting that the data rate in UL and DL is fairly low, showing that whilst the aggregate demand is increasing rapidly, the average demand per second remains below the capacity of current BSs. The outlier wards are ones with high average traffic loads and correspond to tourism hotspots in the wards situated in the Westminster and City of London boroughs.
-3 -2 -1 0 1 2 3 Average × Variance of Traffic (base 10 log scale)
0.6 0.8 1 1.2 1.4 1.6 1.8 2
Peak Traffic Demand, kbps (base 10 log scale)
Predicting Peak Traffic Demand with Long Term Average Data
[image:5.612.63.277.57.212.2]R2 = 0.68
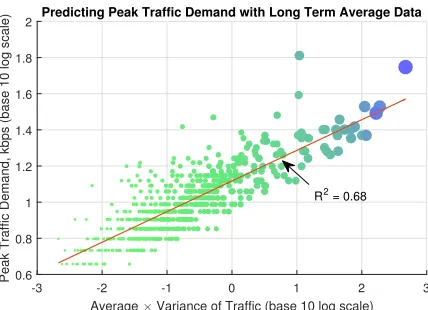
Fig. 5: Predicting Short Term Peak Traffic Demand with Long-Term Statistics.
law relationship between existing geo-tagged Tweets and data demand. However, how accurately can this data be used to predict short-term traffic demand is less clear.
B. Short-Term Temporal Traffic Demand Estimation
As mentioned previously, another challenge is whether the current Twitter data can be used to accurately predict upcoming short-term traffic demand (i.e., either in a few hours time or the same time a few days later). This has strong applications in self-organising-network (SON) operations [14], such as load balancing. In all of these cases, the upcoming short-term temporal patterns in the traffic demand are of interest. By using cross-correlation between Twitter intensity
n[k](complex conjugate n∗[k]) and the 3G traffic loadr[k]
defined as P+N
m=−Nn∗[m]r[m+k] with lag m (minutes), the authors examined the normalised correlation value. Fig. 4 shows the normalised cross-correlation value against the lag value. The results show that for a lag of approximately 120 minutes, the correlation is strong (> 0.9), meaning that the traffic can be accurately predicted for the next 2 hours using current Twitter activity level. At the same time the next day, the correlation remains strong (> 0.85), but this value falls on the third day to 0.7 and on the fourth day to 0.5. The correlation trend is very similar for UL and DL traffic. That is to say, current Twitter data can be used to predict the UL and DL traffic for the next 2 hours and for the same time on the next day. However, future traffic prediction will need continuous monitoring of geo-tagged Twitter data, which can be expensive to obtain.
C. Predicting Short-Term Peak Demand
Previously, the authors have shown that a constant stream of OSN data is needed to obtain up to date high temporal resolution traffic statistics. Nonetheless, there are short-term traffic attributes (i.e., peak demand) that are of interest and can be predicted by using long-term statistics (i.e., the mean and variance). The authors are motivated to use OSN Twitter data to estimate peak demand in order to be operator- and RAT-neutral. In Fig. 5, the authors attempt to predict the peak
Twitter activity level for a particular time period t (npeak,t), by showing that the peak demand is log-linearrelated to the product of the meann and variance σ2
n of the OSN activity level, such that a least-squares linear regression would yield:
log10(npeak,t) =clog 10
n×σn2
+d, (2)
where c = 0.17 and d = 1.11 with a strong correlation (adjusted R2 = 0.68). Using the relationship in Eq. (1) developed between social media activity level nand the real traffic demand r, one can predict the peak traffic demand:
rpeak,t = 10bi[10d(nσ2n)c]ai. The estimated peak traffic de-mand can be used to avoid service outages by offloading users ahead of time to small cells and neighbouring macro BSs.
IV. CONCLUSIONS
Social media data presents service providers with an un-precedented opportunity to better understand end user con-sumption patterns and design better systems. In this paper, the authors have shown that the large volumes of real time Twitter data allows for a scalable way to create accurate maps of mobile data demand. In particular, an empirical relationship between the number of Tweets and the data demand is found for uplink and downlink channels, which enables accurate forward traffic prediction up to 2 hours on the same day and for the same time period over the following 1-2 days.
REFERENCES
[1] X. Chu, D. Lopez-Perez, Y. Yang, and F. Gunnarsson,Heterogeneous Cellular Networks. Cambridge, UK: Cambridge University Press, 2013. [2] D. Lee, S. Zhou, X. Zhong, Z. Niu, X. Zhou, and H. Zhang, “Spatial modeling of the traffic density in cellular networks,” IEEE Wireless Communications, vol. 21, no. 1, pp. 80–88, Mar. 2014.
[3] S. Zhou, D. Lee, B. Leung, X. Zhong, H. Zhang, and Z. Niu, “On the spatial distribution of base stations and its relation to the traffic density in cellular networks,”IEEE Access, vol. 3, pp. 998–1010, Mar. 2015. [4] M. Laner, P. Svoboda, S. Schwarz, and M. Rupp, “Users in Cells: a Data
Traffic Analysis,” in IEEE Wireless Communications and Networking Conference (WCNC), 2012.
[5] W. Guo and S. Wang, “Interference-aware self-deploying femto-cell,” IEEE Wireless Communications Letters, vol. 1, pp. 609–612, Nov. 2012. [6] W. Guo, S. Wang, X. Chu, Y. Chen, H. Song, and J. Zhang, “Automated Small-Cell Deployment for Heterogeneous Cellular Networks,” IEEE Communications Magazine, vol. 51, pp. 46–53, may 2013.
[7] Q. Yu, J. Erman, A. Gerber, Z. Mao, J. Pang, and S. Venkataraman, “Identifying diverse usage behaviors of smartphone Apps,” in ACM SIGCOMM, 2011.
[8] I. Barcia, “Radio Challenges and Opportunities for Large Scale Small Cell Deployments,” KEIMA, Technical Presentation, 2012.
[9] K. Kotobi, P. Mainwaring, C. Tucker, and S. Bilen, “Data-Throughput Enhancement Using Data Mining-Informed Cognitive Radio,” Electron-ics, vol. 4, pp. 221–238, 2015.
[10] T. Qiu, J. Feng, Z. Ge, J. Wang, J. Xu, and J. Yates, “Listen to Me if You can: Tracking User Experience of Mobile Network on Social Media,” inACM Internet Measurement Conference (IMC), 2010.
[11] K. Takeshita, M. Yokota, and K. Nishimatsu, “Early network failure detection system by analyzing Twitter data,” in IEEE International Symposium on Integrated Network Management (IM), 2015.
[12] ONS. (2011) Uk census data 2011. [Online]. Available: http://www. ons.gov.uk/ons/guide-method/census/2011/census-data/index.html [13] F. Botta, H. S. Moat, and T. Preis, “Quantifying crowd size with mobile
phone and Twitter data,”Royal Society Open Science, May 2015. [14] A. Sathiaseelan, M. S. Seddiki, S. Stoyanov, and D. Trossen, “Social