RESEARCH ARTICLE
Section-specific H
+
flux in renal tubules of fasted and fed goldfish
Sandra Fehsenfeld1,2,*, Dennis Kolosov3, Chris M. Wood2,3and Michael J. O’Donnell3
ABSTRACT
A recent study demonstrated that in response to a feeding-induced metabolic acidosis, goldfish (Carassius auratus) adjust epithelial protein and/or mRNA expression in their kidney tubules for multiple transporters known to be relevant for acid–base regulation. These include Na+/H+exchanger (NHE), V-type H+-ATPase (V-ATPase), cytoplasmic carbonic anhydrase, HCO3− transporters and Rhesus proteins. Consequently, renal acid output in the form of protons and NH4+ increases. However, little is known about the mechanistic details of renal acid–base regulation inC. auratusand teleost fishes in general. The present study applied the scanning ion-selective electrode technique (SIET) to measure proton flux in proximal, distal and connecting tubules of goldfish. We detected increased H+ efflux into the extracellular fluid from the tubule in fed animals, resulting from paracellular back-flux of H+through the tight junction. By applying inhibitors for selected acid–base regulatory epithelial transporters, we found that cytosolic carbonic anhydrase and HCO3− transporters were important in mediating H+flux in all three tubule segments of fed goldfish. Contrastingly, V-ATPase seemed to play a role in H+flux only in proximal and distal tubules, and NHE in proximal and connecting tubules. We developed working models for transport of acid–base relevant equivalents (H+, HCO
3−, NH3/NH4+) for each tubule segment in C. auratus kidney. While the proximal tubule appears to play a major role in both H+ secretion and HCO
3− reabsorption, the distal and connecting tubules seem to mainly serve for HCO3−reabsorption and NH3/NH4+secretion.
KEY WORDS: Freshwater teleost, Renal epithelium, Acidosis, SIET
INTRODUCTION
The maintenance of acid–base homeostasis is one of the most important physiological processes in all organisms as it ensures proper enzyme and protein function (Somero, 1986; Riggs, 1988). The kidney has the predominant function of generating and transporting HCO3−and ammonia (here referred to as the sum of NH3 and NH4+) in mammals, and thus ultimately regulates any metabolic acid–base disturbance by adjusting net acid (both titratable acid and NH4+) and base (HCO3−) excretion (Hamm et al., 2015). In teleost fishes, by contrast, the predominant organ involved in regulating acid–base disturbances is the gill (Perry and Gilmour, 2006), while the kidney seems to play only a small but significant role in acid–base balance. For instance, the kidney of the freshwater rainbow trout, Oncorhynchus mykiss, is known to
compensate for environmental disturbances that induce acidosis, such as exposure to low environmental pH (McDonald and Wood, 1981), hyperoxia (Wheatly et al., 1984), hypercapnia (Perry and Fryer, 1997) and exhaustive exercise (Wood, 1988), as well as for a feeding-induced alkaline tide (Bucking et al., 2010). The mechanisms of renal ammonia and acid–base regulation in teleosts, however, remain poorly studied to date. This difficulty stems, in part, from the structural heterogeneity and architectural complexity of the teleost kidney, which contains multiple tissue types and a convoluted tubule (Sakai, 1985). Consequently, most physiological studies have only investigated acid–base regulation by the kidney as a whole (e.g. Wood et al., 1999; Lawrence et al., 2015; Wright et al., 2014). However, recently, we (Fehsenfeld and Wood, 2018) micro-dissected the kidney of the goldfish,Carassius auratus, enabling us to profile mRNA and protein expression of renal epithelial transporters involved in acid–base homeostasis along the renal tubule and its different segments.
In general, renal ionoregulation in freshwater teleosts involves epithelial transporters that are important for the re-absorption of ions to minimize solute loss into the dilute external medium (Wheatly et al., 1984; Curtis and Wood, 1992; Perry et al., 2003b). Transport of primary ions and electrolytes is coupled to the transport of acid– base equivalents, hence linking ionoregulation and acid–base balance in the teleost kidney (Perry et al., 2003b; Wheatly et al., 1984; Dantzler, 2016). Many of the same transporters, including V-type H+-ATPase (V-ATPase), Na+/H+ exchanger (NHE), Na+/ HCO3− co-transporter and HCO3−/Cl−-exchanger, can also be found in the teleost gill epithelium (Perry et al., 2003b). Similarly, these transporters are involved in acid–base regulation in the mammalian kidney (Weiner and Verlander, 2013).
In fasting C. auratus, the kidney produces alkaline urine, resulting in net renal base excretion. Exposure of animals to a low pH environment, however, results in net renal acid excretion (Lawrence et al., 2015). In contrast to the rainbow trout, the goldfish is agastric, like the freshwater killifishFundulus heteroclitus(Wood et al., 2010), having an alkaline digestive tract, and therefore exhibits a systemic acidic tide after feeding. We (Fehsenfeld and Wood, 2018) were able to show that a systemic acid-load (metabolic acidosis) caused by feeding resulted in increased acid excretion by the goldfish kidney, as indicated by a decrease in urine pH and an increase in urine inorganic phosphate and ammonia concentrations. This process was in part accomplished by differentially adjusting expression levels of both mRNA and protein of a variety of transporters in the proximal, distal and connecting tubule of the goldfish nephron (Fehsenfeld and Wood, 2018).
The present study aimed to further investigate the mechanism of renal acid–base regulation in response to feeding in C. auratus. Micro-dissection of intact kidney tubules in combination with the scanning ion-selective electrode technique (SIET) (Smith et al., 1994; Piñeros et al., 1998) allowed direct measurement of H+flux at the basolateral surface of distinct segments of the renal tubule. Measurements from fasted and fed goldfish were used to demonstrate the effects of feeding on the acid–base transport
Received 31 January 2019; Accepted 21 May 2019
1Département de Biologie, Chimie et Géographie, Universitédu Québec à Rimouski, Rimouski, QC, G5L 3A1, Canada.2Department of Zoology, University of British Columbia, Vancouver, BC, V6T 1Z4, Canada.3Department of Biology, McMaster University, Hamilton, ON, L8S 4K1, Canada.
*Author for correspondence (Sandra.Fehsenfeld@uqar.ca)
S.F., 0000-0003-4495-8715; C.M.W., 0000-0002-9542-2219
Journal
of
Experimental
physiology of the proximal, distal and connecting tubule. Furthermore, with the application of specific inhibitors, we were able to identify epithelial transporters involved in renal acid–base regulation by promoting and/or inhibiting H+flux in the various renal tubule segments. We hypothesized that V-ATPase, NHE, HCO3− transporters (Na+/HCO3− co-transporter and/or HCO3−/ Cl−-exchanger) and carbonic anhydrase (the enzyme converting CO2to H+and HCO3−and vice versa) contribute to the H+flux through the renal epithelium. Furthermore, we hypothesized that (i) H+flux would differ among the segments of the renal tubule and (ii) would be differentially affected by the inhibitors, as a result of the differential expression of transporters (at the mRNA and protein level) in each tubule segment, as shown in our previous study (Fehsenfeld and Wood, 2018).
MATERIALS AND METHODS Animal care
Goldfish (∼5 cm, 2.5–3.0 g) were obtained from commercial suppliers and were held in 20 l aquaria at room temperature at a maximum density of 1 fish per 2 l for a minimum of 7 days before the experiments began. The recirculating and filtered tap water composition was (in mequiv l−1): 0.6 Na+, 0.8 Cl−, 1.8 Ca2+, 0.3 Mg2+, 0.05 K+; titration alkalinity 2.1; hardness ∼140 mg l−1 as CaCO3equivalents. Water parameters ( pH 7.4, ammonia, nitrate and nitrite) were closely monitored and water changes were performed 2–3 times a week as necessary. Fish were fed to satiation 2–3 times a week with commercial flaked food (Nutrafin Max, Hagen, Montreal, QC, Canada). For experiments, fish were either fasted for 96 h (‘fasted’) or fasted for 93 h, then fed to satiation and used 3 h after feeding (‘fed’). Each animal was killed by cephalic concussion. All procedures were conducted under the approval of the University of British Columbia Animal Care Committee (licence no. A14-0251) and the guidelines of the Canadian Council on Animal Care.
Preparation of renal tubules for measurements
Immediately following the experimental procedures described above, kidneys were removed and transferred into control goldfish Ringer solution containing (in mmol l−1): 100.0 NaCl, 2.5 KCl, 1.5
CaCl2·2H2O, 1.0 MgCl2·6H2O, 5.0 NaHCO3, 0.7 NaH2PO4·H2O, 10 glucose, pH 7.3 (modified after Hoar and Hickman, 1975). First, larger clusters of tubules were pulled from the Wolffian duct as it runs through each half of the kidney. Subsequently, minuten pins glued to needles and screwed into syringes for better handling were used to carefully isolate single tubules including the glomerulus, proximal tubule, distal tubule and connecting tubule out of these clusters, as described in Fehsenfeld and Wood (2018). One intact tubule was transferred into the lid of a 5 cm Nunc cell culture dish and pinched down onto the dish at both ends using the needles. Lids, rather than the bottom part of the dishes, were used because tubules would stick to them due to apparent adhesive forces holding them in place that did not seem to be present in the bottom dish. The preparation was then transferred into the scanning ion-selective electrode technique (SIET) set-up and measurements were started immediately in control goldfish Ringer solution.
Measurement of renal H+flux by SIET
SIET hardware was obtained from Applicable Electronics (New Haven, CT, USA) and Automated Scanning Electrode Technique version 2 (ASET2) software from Science Wares (Falmouth, MA, USA). Hardware, software and methodology for acquiring SIET data and calculating ion flux have been described in detail in previous publications (Donini and O’Donnell, 2005; Pacey and O’Donnell, 2014; D’Silva et al., 2017). Briefly, ion-selective microelectrodes were pulled to a∼5 µm tip diameter using a programmable P-97 micropipette puller (Sutter Instruments, Novato, CA, USA). Silanized microelectrodes were back-filled with 100 mmol l−1 NaCl/100 mmol l−1 sodium citrate ( pH 6.0). Electrodes were then tip-filled with∼200 µm column length of H+Ionophore I Cocktail B (Millipore Sigma, Burlington, MA, USA). Slopes of microelectrodes calibrated in pH 6.5 and pH 7.5 solutions were 59.5±0.4 mV per 10-fold change in H+concentration. Voltage gradients obtained using SIET readings were converted into concentration gradients (ΔC) and subsequently into flux (J) using Fick’s law by applying the following equations from Donini and O’Donnell (2005):
DC¼CB10DV=SCB; ð1Þ
JI¼DIðDCÞ=Dx; ð2Þ where ΔC is the concentration gradient in mol cm−3; C
B is the background ion concentration (calculated as the average of the concentration at each point) inμmol l–1;ΔVis the voltage gradient obtained from the software ASET2 inμV; S is the slope of the electrode;Jis the flux in mol cm−2s−1;Dis the diffusion coefficient in cm2s−1; andΔxis the distance between the two points in cm. Buffering capacity (xi) for H2O, HCO3−and H2PO4−, their diffusion coefficients (DB) (H2O, DB=9.31E−05/HCO3−, DB=1.20E−05/ H2PO4−,DB=8.30E−06) and acid dissociation constants (Ka) were taken into account to adjust H+flux values (J
H+
total) for the buffering
capacity of the measuring media as follows (Messerli et al., 2006):
xi¼Ka=ðKaþ ½HþÞ2DB=DHþ ½buffer; ð3Þ
JHþtotal ¼JHþmeasuredð1þxHCO3 þxH2PO4 þxH2OÞ: ð4Þ
To determine control H+ flux in fasted and fed animals, renal tubules were scanned in control goldfish Ringer solution in 100 µm increments starting at the glomerulus and ending at the connecting tubule. To test for potential effects of time on tissue viability, the goldfish Ringer solution was renewed after the first scan, the tubules incubated for 10 min (to mimic addition of inhibitors as described List of symbols and abbreviations
AE anion exchanger (Cl−/HCO3−)
xi buffering capacity (SIET) CA carbonic anhydrase
CB background ion concentration (μmol l–1) (SIET)
ΔC concentration gradient (mol cm−3) (SIET)
ΔV voltage gradient obtained from the software ASET2 (μV) (SIET)
Δx distance between the two measuring points of an electrode (cm) (SIET)
D diffusion coefficient (cm2s−1) (SIET)
DIDS 4,4’-diisothiocyanatostilbene-2,2’-disulfonate ECF extracellular fluid
EIPA 5-(N-ethyl-N-isopropyl)amiloride V-ATPase V-type H+-ATPase
J flux (mol cm−2s−1)
Ka acid dissociation constant (SIET)
NBC Na+/HCO
3−co-transporter
NHE Na+/H+exchanger
PNA+/− peanut lectin agglutinin cell S slope of the SIET-electrode
SIET scanning ion-selective electrode technique TAP 2,4,6-triaminopyrimidine
Journal
of
Experimental
below), and then rescanned at the same positions. For investigation of the effects of inhibitors on H+flux, the tubules of fed goldfish were incubated with the respective inhibitor for 10 min after the control scan, and then rescanned at the same locations as for the control Ringer solution. Inhibitors and their concentrations (and targets) were: 10 mmol l−12,4,6-triaminopyrimidine (TAP; paracellular pathway), 100 µmol l−1 5-(N-ethyl-N-isopropyl)amiloride (EIPA; NHE), 100 µmol l−1 4,4’-diisothiocyanatostilbene-2,2’-disulfonate (DIDS; HCO3−/Cl−-exchanger and/or Na+/HCO3−co-transporter), 5 µmol l−1 bafilomycin (V-ATPase) and 1 µmol l−1 acetazolamide (carbonic anhydrase). There was no effect of the inhibitors at the indicated concentrations on the slope/responsiveness of the H+microelectrodes.
Statistical analysis
Data are expressed as means±s.e.m. (N), where N represents the number of animals. All statistical analyses were performed with PAST3 (Hammer et al., 2001) or Minitab®Statistical Software (State College, PA, USA). Data were checked for normal distribution with the Shapiro–Wilks test and homogeneity of variances with theF-test. If data did not meet these criteria for parametric testing, they were log transformed.
To investigate the effect of feeding (Fig. 1) and/or time (Fig. 2) on tubular H+flux, the mean H+flux for each segment (as indicated by horizontal lines in Figs 1 and 2 for proximal, distal and connecting tubule) was calculated for fasted and fed animals, respectively. Data were then analyzed by two-way ANOVA using a general linear model as implemented in Minitab 18 (Fig. 1: factor 1=fasted versus fed, factor 2=tubule segment; Fig. 2: repeated measures two-way ANOVA, factor 1=1st run versus 2nd run, factor 2=tubule segment). Subsequently, pairwise comparisons were conducted using Tukey’s
post hoctest.
For the inhibitor experiments (Figs 3–6), Student’s pairedt-tests were applied for each inhibitor in each section. Data were considered significantly different at P≤0.05. All graphs were generated with Inkscape 0.92.0 r15299 (https://www.inkscape.org).
RESULTS
In fasted goldfish, H+efflux was observed from the tubule lumen and/or the epithelial cells over the basolateral epithelium to the
external solution (Fig. 1B). Mean H+ flux rates did not differ significantly between the different segments of fasted animals (Fig. 1A). Two-way ANOVA revealed a significant effect of both tubule segment and feeding status on H+ flux, but not their interaction. Tukey’spost hocanalysis identified H+flux in the distal tubule of fed animals to be significantly lower (−57%) than that in the proximal and connecting tubule of fed animals. Mean H+flux increased significantly in fed animals compared with fasted animals in all three tubule segments (Tukey’s post hocanalysis), and the difference was most pronounced in the proximal tubule (3.5-fold versus 2.4- and 2.2-fold increases in the distal and connecting tubule, respectively) (Fig. 1).
H+ flux during two consecutive runs with control saline in tubules of fed animals did not decrease significantly over time (Fig. 2; repeated measures two-way ANOVA). There was, however, a significant effect of tubule segment according to findings in fed tubules as mentioned above, with the distal tubule having significantly lower H+ flux compared with both the proximal and connecting tubule (Tukey’spost hocanalysis). There was no significant interaction of time and tubule segment (P=0.7).
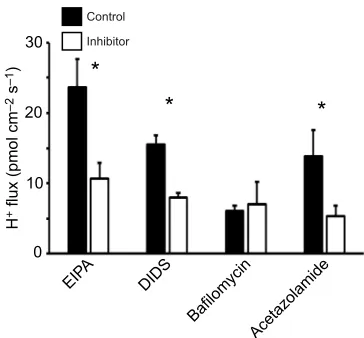
Consequently, tubules from fed animals were used in testing the effects of inhibitors. The application of 2,4,6-triaminopyrimidine (TAP; 10 mmol l−1) (Fig. 3) to inhibit the paracellular pathway resulted in a dramatic ∼90% decrease of H+ flux in all three segments. Targeting epithelial transporters and enzymes with specific inhibitors differentially affected H+flux along the tubule. Fig. 4 shows results for the proximal tubule, Fig. 5 shows results for the distal tubule and Fig. 6 shows those for the connecting tubule. Inhibiting NHE with EIPA decreased H+ flux by ∼55% in the proximal and connecting tubule, but did not affect H+flux in the distal tubule. Applying DIDS to inhibit HCO3−transporters resulted in a decrease of H+ flux by 70% in the proximal tubule, and approximately 50% in the distal and connecting tubule. When V-ATPase was blocked by bafilomycin, H+flux decreased by 67% in the proximal tubule and 45% in the distal tubule, while no effect was observed in the connecting tubule. Targeting carbonic anhydrase with acetazolamide decreased H+flux by roughly 60% in all three segments.
Proximal tubule Distal tubule
G Connectingtubule
Fasted
Fed
100 µm 1000 µV
A
B
4030
20
10
0
a,*
H
+ flux (pmol cm
–2
s
–1
)
b,*
[image:3.612.50.322.512.735.2]a,*
Fig. 1. Proton flux along the nephron of fasted and fed goldfish
(Carassius auratus). (A) Scanning ion micro-electrode
measurements of H+flux in renal proximal, distal and connecting
tubules in fasted and fed goldfish. G, glomerulus. Lowercase letters indicate significant differences among mean flux rates for each tubule segment in fed animals, while asterisks denote significant differences in the mean flux in the respective tubule segment between fed and fasted animals (two-way ANOVA and Tukey’spost hocanalysis,P<0.05). Data are represented as means±s.e.m. (N=5). (B) Representative visualization of calculated H+flux in the
nephron of a fed goldfish as depicted by ASET2 software (arrow length indicates magnitude, arrowheads indicate direction of the flux). H+flux was directed from the tubule lumen towards the external
medium. Because of the length of the tissue, the figure was generated by combining two screenshots; these have been overlaid as much as possible and the right image was then cropped to match the transition from the left (indicated by black line between the screenshots).
Journal
of
Experimental
DISCUSSION
General observations
Goldfish,C. auratus, produce an alkaline urine ( pH 7.8–8.5) under fasted conditions (Lawrence et al., 2015; Fehsenfeld and Wood, 2018). This indicates renal reabsorption of H+ from the tubule lumen into the extracellular fluid/plasma and, indeed, this is what we measured in the present study by applying SIET to the proximal, distal and connecting tubule (Fig. 1). In response to the acidic tide caused by feeding, however, urine pH was observed to drop by up to 0.6 units (Fehsenfeld and Wood, 2018); under these conditions the kidney reversed this flux to net H+secretion. Surprisingly, the results here appear to show the opposite effect, suggesting a pronounced increase in H+reabsorption in response to feeding that was highest in the proximal tubule (3.5-fold versus ∼2.3-fold in distal and connecting tubule with reference to fasted conditions; Fig. 1). When the paracellular pathway was blocked with TAP, however, the observed H+reabsorption was reduced to 10% of the control values for fed animals in all segments (Fig. 3). The teleost kidney has been reported to express a multitude of tight junction proteins: cytosolic scaffolding proteins cingulin and ZO-1 (Kolosov
et al., 2014), as well as transmembrane proteins like occludin (Chasiotis and Kelly, 2008; Kolosov et al., 2017) and over 35 claudins (Kolosov et al., 2013), and the tricellular proteins ILDR2 and tricellulin (Kolosov and Kelly, 2013, 2018; Kolosov et al., 2017). Despite the fact that many tight junction proteins have been detected in the kidney, their individual role and distribution in the different regions of the fish nephron are unknown. Chasiotis and Kelly, however, showed that occludin was expressed in the distal and not the proximal tubule of goldfish (Chasiotis and Kelly, 2008) and the African clawed frogXenopus laevis(Chasiotis and Kelly, 2009). Accordingly, rather than indicating a direct reabsorption of protons, the observed H+flux probably represents H+back-flux via
H
+ flux (pmol cm
–2
s
–1)
Proximal tubule Distal tubule
G Connectingtubule
First run
Second run
40
30
20
10
0
a,A
a,A
[image:4.612.344.530.56.217.2]b,B
Fig. 2. Effect of time on H+flux along the renal tubules of fed goldfish.
Data were obtained by re-scanning the same tubule to exclude changes in tissue viability for inhibitor experiments. After a first scan in 100 µm increments, Ringer solution was exchanged and left for 10 min before a second scan of the same tubule was performed. Letters indicate significant differences among mean flux rates for each tubule segment in fed animals (lowercase, first run; uppercase, second run); no difference was found between the first and second run (repeated measures two-way ANOVA with Tukey’spost hocanalysis,N=3). Data are represented as means±s.e.m.
Distal tubule
H
+ flux (pmol cm
–2
s
–1
) 40
30
20
10
0 50
TAP Control
*
*
*
Connecting tubule Proximal
[image:4.612.56.295.57.193.2]tubule
Fig. 3. Effects of inhibition of the paracellular pathway on renal tubule H+
back-flux in preparations from fed goldfish.Data are represented as means ±s.e.m. Asterisks denote significant differences between H+flux with control
saline and the application of 10 mmol l−12,4,6-triaminopyrimidine (TAP;
Student’s pairedt-test withP<0.05 andN=4).
*
*
*
*
Control
Inhibitor
30
20
10
0
H
+ flux (pmol cm
–2
s
–1
)
Acetazolamide Bafilomycin
DIDS EIP
A
Fig. 4. Effects of inhibitors of acid–base relevant epithelial transporters on H+back-flux in the proximal tubule in preparations from fed goldfish.
H+flux was directed from the lumen into the extracellular fluid and decreased
with the application of all inhibitors: 100 µmol l−1EIPA for Na+/H+exchanger
(NHE), 100 µmol l−1DIDS for HCO
3−transporters, 5 µmol l−1bafilomycin for
V-type H+-ATPase (V-ATPase) and 1 µmol l−1acetazolamide for carbonic
anhydrase. Asterisks denote significant differences between H+back-flux with
control saline and following application of inhibitor for the respective transporters (Student’s pairedt-test withP<0.05 andN=6–8). Data are represented as means±s.e.m.
*
*
*
Control
Inhibitor
15
10
5
0
H
+ flux (pmol cm
–2
s
–1
)
Acetazolamide Bafilomycin
DIDS EIP
A
Fig. 5. Effects of inhibitors of acid–base relevant epithelial transporters on H+back-flux in the distal tubule in preparations from fed goldfish.H+
flux was directed from the lumen into the extracellular fluid and decreased with the application of most inhibitors: 100 µmol l−1EIPA for NHE; 100 µmol l−1
DIDS for HCO3−transporters; 5 µmol l−1bafilomycin for V-ATPase and
1 µmol l−1acetazolamide for carbonic anhydrase. Asterisks denote significant
differences between H+back-flux with control saline and following
application of inhibitor for the respective transporters (Student’s pairedt-test withP<0.05 andN=6–8). Data are represented as means±s.e.m.
Journal
of
Experimental
[image:4.612.346.528.485.645.2] [image:4.612.96.257.538.683.2]the paracellular pathway down the concentration gradient established by active H+secretion into the small closed tubular lumen.
We are confident that the tissue was intact and that this H+back-flux was not due to tissue deterioration, because we took particular care to avoid touching the tubules themselves during the microdissection (i.e. they were not pulled on or squeezed). Rather, needles were mainly used to carefully tease apart the connective tissue. Additionally, we carefully inspected every tubule visually during and after the microdissection for any potential rips. Measurements were highly reproducible, and tubules of fasted animals generally had very low H+flux.
As it was not possible to directly measure apical H+ flux, the observed H+back-flux through the tight junction can be interpreted as a proxy for apical H+secretion. Consequently, a proton gradient directed from the lumen to the plasma, resulting in the observed H+ back-flux, can be explained by the following: (1) active apical ion transport resulting in higher [H+] in the tubular lumen compared with extracellular [H+] and/or (2)‘trapped’urine of fed animals having increased [H+] in the lumen ( pH 7.2) compared with the extracellular fluid ( pH 7.85 of fasted animals; Fehsenfeld and Wood, 2018). Differences in the magnitude of H+back-flux in the different segments of the tubule isolated from fed animals (Fig. 1A) can be attributed to a combination of regional alterations in (i) paracellular permeability, i.e. the tight junctions, and (ii) active ion transporter (epithelial channels and pumps) expression. In the intact kidney of fed freshwater fishes, such back-flux of H+through the paracellular cleft would be minimized by continuous production and flow of copious amounts of dilute urine that would probably increase in the face of a systemic acidosis (Lawrence et al., 2015).
Effects of ion transporter inhibitors targeting epithelial transporters on proton flux
While the recent study by Fehsenfeld and Wood (2018) established a general molecular basis for renal acid–base regulation in different tubule segments of the goldfish kidney, the SIET measurements of the present study allowed us to establish real-time H+ flux data. Furthermore, by application of specific inhibitors, our results allow us to compare the observed H+ flux to the presence of epithelial
transport proteins and further characterize their role in renal acid– base balance in the different tubule segments. Note that we elected to test the potential inhibitors only on preparations from fed animals, because H+flux rates were low in fasted animals, so we cannot eliminate the possibility that different response patterns would have been seen in the latter. Here, we suggest models for general mechanisms of transport of acid–base equivalents (i.e. H+, HCO
3− and NH4+) in the proximal (Fig. 7), distal (Fig. 8) and connecting tubule (Fig. 9). No inhibitors are currently available for Rhesus proteins, the major transporters for NH3/NH4+. They are, however, likely to play a role in acid–base regulation, so we have incorporated them into our proposed models where appropriate. The models take into account inhibitor results from the present study, protein and mRNA expression data from Fehsenfeld and Wood (2018), as well as aspects from the mammalian models for renal acid–base (Hamm et al., 2013) and ammonia transport (Weiner and Verlander, 2013, 2017). While depicted here as one cell, it is possible that certain processes are instead associated with multiple, rather specific cell types as in the mammalian system.
NHE
NHE is generally believed to promote apical H+secretion (and Na+ absorption) in the vertebrate kidney and specifically in the proximal tubule as the major site for renal acid excretion (Gilmour and Perry, Control
Inhibitor
*
*
*
30
20
10
0
H
+ flux (pmol cm
–2
s
–1
)
Acetazolamide Bafilomycin
DIDS EIP
[image:5.612.83.265.55.224.2]A
Fig. 6. Effects of inhibitors of acid–base relevant epithelial transporters on H+back-flux in the connecting tubule in preparations from fed
goldfish.H+flux was directed from the lumen into the extracellular fluid and
decreased with the application of most inhibitors: 100 µmol l−1EIPA for NHE,
100 µmol l−1DIDS for HCO
3−transporters, 5 µmol l−1bafilomycin for
V-ATPase and 1 µmol l−1acetazolamide for carbonic anhydrase. Asterisks
denote significant differences between H+back-flux with control saline and
following application of inhibitor for the respective transporters (Student’s pairedt-test withP<0.05 andN=6–8). Data are represented as means±s.e.m.
Lumen
Rhcg1b
ap bl
Rhbg ECF
2 K+
ATP
ATP
3 Na+
H+
(+NH3)
NH3(+H+) Na+
CAII -like
AMM
Na+ NH4+
NH3 NH3/NH4+
+
HCO
3–3 HCO
3
3–H
+−
Fig. 7. Proposed model for renal flux of H+and other acid–base equivalents
in the proximal tubule of the goldfish.Solid lines represent primary and secondary active ion transport, dashed lines are indicative of channels that allow bi-directional flow, and wavy lines (see Figs 8 and 9) represent vesicular transport. The negative electric potential of the cell towards both the plasma/ extracellular fluid (ECF) and the urine/lumen is indicated by the oval containing a minus sign. Major contributors to acid–base regulation are indicated by bold lines and text. We propose the proximal tubule to mainly contribute to HCO3−
reabsorption into the extracellular fluid, as well as H+secretion into the luminal
space, comparable to what has been observed in the mammalian kidney. H+is
suggested to mainly be generated by cytoplasmic carbonic anhydrase (CAII-like) and secreted by apical Na+/H+exchanger (NHE3). Apical Rhesus proteins
(Rhcg1b/Rhcg2) potentially titrate urine H+and trap it in the form of NH 4+in the
lumen. Apical Na+entry via NHE3 is energized by the basolateral Na+/K+
-ATPase. H+is also partly reabsorbed into the plasma via basolateral V-ATPase
(in contrast to apical V-ATPase in mammals) and might help to titrate plasma NH3reabsorbed via Rhesus protein Rhbg to‘trap’NH4+. The major source of
HCO3−in this tubule region is probably ammoniagenesis (AMM) as observed in
mammals. HCO3−is reabsorbed into the extracellular fluid via Na+/HCO3−
co-transport ( probably electrogenic 1:3 by NBC1). The processes depicted here indicate a proximal tubule cell in goldfish to resemble an intermediate between mammalian proximal tubule cells and B-intercalated cells of the collecting duct. ap, apical; bl, basolateral.
Journal
of
Experimental
[image:5.612.332.546.333.513.2]2009; Hamm et al., 2013; Ivanis et al. 2008; Teranishi et al. 2013). Furthermore, protein abundance of NHE (isoform 3) in the cortical brush-border apical membrane of the proximal tubule was reported
to increase following chronic metabolic acidosis in rats (Ambühl et al., 1996). Likewise, in goldfish renal tubules, NHE3 protein was located in the basolateral membrane of all tubule segments of fasted goldfish, but increased in abundance and relocated to the apical membrane in the proximal tubule when animals experienced a systemic acid load as a result of feeding (Fehsenfeld and Wood, 2018). This indicates a similar mechanism in the goldfish kidney to that in the mammalian kidney.
Blockade of NHE(s) with the EIPA in the present study resulted in a decrease of H+flux in the goldfish renal tubule, verifying its role in renal acid–base balance. Surprisingly, however, this was only observed in the proximal (Fig. 4) and connecting tubule (Fig. 6) of fed goldfish, and not in the distal segment (Fig. 5). It has to be kept in mind that the inhibitor may have acted not only on basolateral but also on apical NHE3 because of its permeability through the tight junctions (Van Itallie et al., 2008; Hou et al., 2013). Consequently, the decrease of H+flux in the proximal tubule when inhibited by EIPA is in line with NHE-mediated apical proton secretion. Alternatively or additionally, EIPA may have blocked a different isoform of NHE, for example NHE1 that appears to be expressed in the basolateral membrane of the proximal tubules in mammals (Hamm et al., 2013; Bobulescu et al., 2005). NHE may be present in the distal segment of goldfish renal tubule, but in accordance with our measurements is probably not involved in acid–base regulation in this region, as has also been suggested for the mammalian distal tubule (Hamm et al., 2013).
HCO3−transporters An electrogenic Na+/HCO
3− co-transporter (NBCe1A/NBC1) in basolateral membranes of the proximal tubule is crucial for the reabsorption of base in mammals (Hamm et al., 2013; Weiner and Verlander, 2013; Handlogten et al., 2015). NBC1 has also been identified in the trout kidney and was proposed to mediate increased basolateral reabsorption of HCO3− in response to a respiratory acidosis caused by hypercarbia (Perry et al., 2003a). Two anion exchangers have been identified in mammalian renal cells: AE1 (SLC4A1) is present in the basolateral membrane of A-type intercalated cells in the collecting duct, whereas pendrin (SLC26A4) is found in the apical membrane of the proximal tubule and B-type intercalated cells of the collecting duct (Hamm et al., 2013; Soleimani et al., 2001). Members of the SLC26 family of membrane transporters including pendrin have also been identified in zebrafish gills (Bayaa et al., 2009) and in V-ATPase-rich cells in the elasmobranch branchial epithelium (Piermarini and Evans, 2001; Tresguerres et al., 2005; Reilly et al., 2011). In response to a metabolic alkalosis (feeding-induced alkaline tide), elasmobranch gills translocated pendrin into the apical membrane with the help of cytoplasmic carbonic anhydrase (Tresguerres et al., 2007; Roa et al., 2014). NBC1 and AE1, in contrast, were expressed basolaterally not only in the proximal but also in the distal and connecting tubule in goldfish (Fehsenfeld and Wood, 2018).
Unfortunately, no specific inhibitor can distinguish between NBC(s), AE(s) and pendrin (Soleimani et al., 2001; Bayaa et al., 2009). The application of DIDS, as chosen here to block HCO3− transporters in general, resulted in a decrease of proton flux in all three segments but was most pronounced in the proximal segment (70% inhibition of H+ flu, versus 50% in distal and connecting tubules; Figs 4, 5 and 6). With basolateral AE1 protein abundance being decreased in all three segments upon feeding (and with the most pronounced decrease in the proximal tubule; Fehsenfeld and Wood, 2018), the effect observed with the application of the inhibitor DIDS basolaterally might mostly be due to targeting
Rhcg1a Rhcg1a Rhcg1a/
Rhcg1b
ap bl
ECF
2 K+
3 Na+
H+
ATP
ATP
Na+
NH4+
NH3/NH4+
H
+CAII -like
HCO3–
3 HCO
3–NH
3
/NH
4
+
Lumen
[image:6.612.70.280.53.227.2]−
Fig. 8. Proposed model for renal flux of H+and other acid–base
equivalents in the distal tubule of the goldfish.Please see Fig. 7 for formatting details and sources. The distal tubule may contribute substantially to NH3/NH4+secretion into the luminal space, as well as to HCO3−
reabsorption into the extracellular fluid. In contrast to mammals, it may play only a minor role in direct H+secretion into the lumen. As in the proximal tubule,
cytoplasmic carbonic anhydrase (CAII-like) may play the major role in the generation of H+. H+and HCO
3−are reabsorbed basolaterally by V-ATPase
and Na+/HCO
3−co-transport ( probably electrogenic 1:3 by NBC1).
NBC1-mediated reabsorption of HCO3−into the plasma would be driven by the
negative membrane potential generated by basolateral Na+/K+-ATPase. NH 3/
NH4+secretion via apical Rhcg1a and/or Rhcg1b, and basolateral Rhcg1a
may be supported by exocytosis of acidified vesicles as proposed for branchial epithelia in green crabs (Carcinus maenas; Fehsenfeld and Weihrauch, 2016) and rats experiencing a metabolic acidosis (Seshadri et al., 2006).
Rhcg1b
Rhcg1a Rhbg
ap bl
2 K+
3 Na+ H+
ATP
Na+ Na+
NH4+ NH3/NH4+
H
+CAII -like
HCO3–
3 HCO
3–
NH
3
/NH
4
+
Lumen
−
Fig. 9. Proposed model for renal flux of H+and other acid–base equivalents
in the connecting tubule of the goldfish.Please see Fig. 7 for formatting details and sources. Like the distal tubule, the connecting tubule is proposed to contribute mostly to NH3/NH4+secretion into the luminal space, as well as HCO3−
reabsorption into the extracellular fluid. In contrast to the distal tubule, however, (i) basolateral exit of H+into the extracellular fluid is probably promoted by
basolateral NHE and not basolateral V-ATPase, and (ii) NH3/NH4+secretion
might be accomplished instead via basolateral Rhesus protein Rhbg and apical Rhcg1b with less involvement of membrane-bound Rhcg1a. The presence of basolateral NHE and Na+/HCO
3−co-transporter (probably electrogenic 1:3
NBC1) suggests the connecting tubule is composed of cells comparable to mammalian principal cells of the connecting segment/collecting duct of the kidney
(Chaillet and Lopez, 1985; Wang and Kurtz, 1990; Weiner and Hamm, 1990).
Journal
of
Experimental
[image:6.612.73.280.438.608.2]NBC1. Blocking NBC1-promoted reabsorption of HCO3−into the extracellular fluid would result in an increase of extracellular H+and therefore diminish the H+gradient and the H+back-flux as observed here. This finding emphasizes the importance of renal reabsorption of HCO3− for acid–base balance during metabolic acidosis, especially in the proximal tubule.
V-ATPase
Apical V-ATPase is generally believed to promote H+secretion in branchial acid-secreting cells such as peanut lectin agglutinin negative (PNA−) mitochondria-rich cells of the trout gill epithelium and in proton pump-rich cells of zebrafish gills (Gilmour and Perry, 2009). In contrast, branchial base-secreting cells seem to possess a basolateral V-ATPase as proposed for trout PNA positive (PNA+) mitochondria-rich cells (Gilmour and Perry, 2009) and the branchial epithelium of stingrays (Piermarini and Evans, 2001). A similar distinction between cells can be made in the vertebrate kidney, with apical V-ATPase in A-type intercalated cells (PNA−; co-expressed with basolateral anion exchanger AE1) of the distal tubule, connecting segment and the collecting duct of the kidney cortex functioning as acid-secreting cells, whereas V-ATPase is more ubiquitously expressed in B-type intercalated cells (PNA+; co-expressed with apical pendrin) and is often localized in the basolateral membrane (Brown and Breton, 2000; Brown et al., 2009). In goldfish tubules, V-ATPase appeared to localize exclusively to the basolateral membrane of all three investigated segments of this study (Fehsenfeld and Wood, 2018). A basolateral V-ATPase could indeed be important for the alkalinization of the urine under control conditions (Lawrence et al., 2015).
Bafilomycin decreased H+flux in the proximal (Fig. 4) and distal tubule (Fig. 5), confirming a role for V-ATPase in acid–base regulation of these tubule regions. With a basolateral V-ATPase presumably pumping H+ into the plasma, inhibiting this pathway would accumulate intracellular protons and result in a shift of the equilibrium for the intracellular carbonate system. Consequently, the generation of intracellular CO2 would increase while diminishing both intracellular H+and HCO
3−. The observed decrease in net H+ flux upon blocking V-ATPase could then be explained by the general decrease of intracellular protons available for basolateral, and possibly apical, transport, while also less HCO3− could be reabsorbed basolaterally via Na+/HCO
3−co-transporter.
Carbonic anhydrase
Carbonic anhydrase is crucial for acid–base balance in virtually all systems (Gilmour and Perry, 2009). In addition to the predominant cytosolic isoform of the enzyme (CAII-like/CAc) (Esbaugh et al., 2005; Gilmour and Perry, 2009), the kidney of freshwater teleosts expresses at least one membrane-bound carbonic anhydrase (CAIV) (Georgalis et al., 2006). CAIV is located apically and available to the tubular lumen in both mammals (Hamm et al., 2013; Schwartz et al., 2000) and fishes (Perry et al., 2003b; Georgalis et al., 2006), where it is proposed to help titrate filtered HCO3−with secreted H+, thereby effecting HCO3− reabsorption from the urine. Intracellularly, carbonic anhydrase converts intracellular CO2into HCO3−and H+, which is then returned to the extracellular fluid or secreted into the urine, respectively.
Blocking carbonic anhydrase in the present study decreased H+ flux by 60% in all three investigated segments, indicating that the conversion of CO2contributes considerably to the secretion and/or reabsorption of acid–base equivalents, respectively. The inhibitor acetazolamide, however, is membrane permeable and does not distinguish between different isoforms of the enzyme. Consequently,
the present results confirm that carbonic anhydrase is critical for acid secretion and/or base reabsorption in all three parts of the goldfish tubule but do not reveal the site of action.
Acknowledgements
We thank Ryan Belowitz for help with fish maintenance. The authors would like to thank Dr Scott P. Kelly (York University, Toronto, ON, Canada) for donation of 2,4,6-triaminopyrimidine.
Competing interests
The authors declare no competing or financial interests.
Author contributions
Conceptualization: S.F., D.K., C.M.W., M.J.O.; Formal analysis: S.F., D.K., M.J.O.; Investigation: S.F., D.K.; Writing - original draft: S.F.; Writing - review & editing: S.F., D.K., C.M.W., M.J.O.; Visualization: S.F.; Supervision: M.J.O.; Funding acquisition: C.M.W., M.J.O.
Funding
Financial support was provided by Discovery Grants from the Natural Sciences and Engineering Research Council of Canada (NSERC) to M.J.O. (NSERC PIN-2015-14139) and C.M.W. (NSERC PIN-2017-03843).
References
Ambühl, P. M., Amemiya, M., Danczkay, M., Lötscher, M., Kaissling, B., Moe, O. W., Preisig, P. A. and Alpern, R. J.(1996). Chronic metabolic acidosis increases NHE3 protein abundance in rat kidney. AJP Ren. Physiol. 271, F917-F925. doi:10.1152/ajprenal.1996.271.4.F917
Bayaa, M., Vulesevic, B., Esbaugh, A., Braun, M., Ekker, M. E., Grosell, M. and Perry, S. F.(2009). The involvement of SLC26 anion transporters in chloride uptake in zebrafish (Danio rerio) larvae.J. Exp. Biol.212, 3283-3295. doi:10.1242/jeb.033910
Bobulescu, A., Di Sole, F. and Moe, O. W.(2005). Na+/H+exchangers: physiology and link to hypertension and organ ischemia.Curr. Opin. Nephrol. Hypertens.14, 485-494. doi:10.1097/01.mnh.0000174146.52915.5d
Brown, D. and Breton, S.(2000). H+V-ATPase-dependent luminal acidification in the kidney collecting duct and the epididymis/vas deferens: vesicle recycling and transcytotic pathways.J. Exp. Biol.203, 137-145.
Brown, D., Paunescu, T. G., Breton, S. and Marshansky, V.(2009). Regulation of the V-ATPase in kidney epithelial cells: dual role in acid–base homeostasis and vesicle trafficking.J. Exp. Biol.212, 1762-1772. doi:10.1242/jeb.028803
Bucking, C., Landman, M. J. and Wood, C. M.(2010). The role of the kidney in compensating the alkaline tide, electrolyte load, and fluid balance disturbance associated with feeding in the freshwater rainbow trout,Oncorhynchus mykiss. Comp. Biochem. Physiol. Part A.156, 74-83. doi:10.1016/j.cbpa.2009.12.021
Chaillet, J. R. and Lopes, A. G.(1985). Basolateral Na-H exchange in the rabbit cortical collecting tubule.J. Gen. Physiol.86, 798-812. doi:10.1085/jgp.86.6.795
Chasiotis, H. and Kelly, S. P.(2008). Occludin immunolocalization and protein expression in goldfish.J. Exp. Biol.211, 1524-1534. doi:10.1242/jeb.014894
Chasiotis, H. and Kelly, S. P. (2009). Occludin and hydromineral balance in Xenopus laevis.J. Exp. Biol.212, 287-296. doi:10.1242/jeb.022822
Curtis, B. J. and Wood, C. M.(1992). Kidney and urinary bladder responses of freshwater rainbow trout to isosmotic NaCl and NaHCO3infusion.J. Exp. Biol.
173, 181-203.
Dantzler, W. H.(2016).Comparative Physiology of the Vertebrate Kidney, 2nd edn. New York: Springer Science+Business Media LLC.
D’Silva, N. M., Donini, A. and O’Donnell, M. J.(2017). The roles of V-type H+ -ATPase and Na+/K+-ATPase in energizing K+ and H+ transport in larval Drosophilagut epithelia.J. Insect Physiol. Elsevier Ltd 98, 284-290. doi:10. 1016/j.jinsphys.2017.01.019
Donini, A. and O’Donnell, M. J.(2005). Analysis of Na+, Cl−, K+, H+and NH4+ concentration gradients adjacent to the surface of anal papillae of the mosquito Aedes aegypti: application of self-referencing ion-selective microelectrodes. J. Exp. Biol.208, 603-610. doi:10.1242/jeb.01422
Esbaugh, A. J., Perry, S. F., Bayaa, M., Georgalis, T., Nickerson, J., Tufts, B. L. and Gilmour, K. M. (2005). Cytoplasmic carbonic anhydrase isozymes in rainbow trout Oncorhynchus mykiss: comparative physiology and molecular evolution.J. Exp. Biol.208, 1951-1961. doi:10.1242/jeb.01551
Fehsenfeld, S. and Weihrauch, D.(2016). Mechanisms of acid–base regulation in seawater-acclimated green crabs (Carcinus maenas).Can. J. Zool.94, 95-107. doi:10.1139/cjz-2015-0132
Fehsenfeld, S. and Wood, C. M.(2018). Section-specific expression of acid-base and ammonia transporters in the kidney tubules of the goldfishCarassius auratus and their responses to feeding.AJP Ren. Physiol.315, F1565-F1582. doi:10. 1152/ajprenal.00510.2017
Georgalis, T., Gilmour, K. M., Yorston, J. and Perry, S. F.(2006). Roles of cytosolic and membrane-bound carbonic anhydrase in renal control of acid-base
Journal
of
Experimental
balance in rainbow trout, Oncorhynchus mykiss. AJP Ren. Physiol. 291, F407-F421. doi:10.1152/ajprenal.00328.2005
Gilmour, K. M. and Perry, S. F.(2009). Carbonic anhydrase and acid–base regulation in fish.J. Exp. Biol.212, 1647-1661. doi:10.1242/jeb.029181
Hamm, L. L., Alpern, R. J. and Preisig, P. A.(2013). Cellular mechanisms of renal tubular acidification. InSeldin and Giebisch’s The Kidney, 5th edn (ed. R. J. Alpern, O. W. Moe and M. Caplan), pp. 1917-1978. Elsevier Inc.
Hamm, L. L., Nakhoul, N. and Hering-Smith, K. S.(2015). Acid-base homeostasis. Clin. J. Am. Soc. Nephrol.10, 2232-2242. doi:10.2215/CJN.07400715
Hammer, Ø., Harper, D. A. T. and Ryan, P. D.(2001). PAST: Paleontological statistics software package for education and data analysis.Palaeontol. Electron.
4, 1-9.
Handlogten, M. E., Osis, G., Lee, H.-W., Romero, M. F., Verlander, J. W. and Weiner, I. D.(2015). NBCe1 expression is required for normal renal ammonia metabolism.AJP Ren. Physiol.309, 658-666. doi:10.1152/ajprenal.00219.2015
Hoar, W. S. and Hickman, C. P.(1975).A Laboratory Companion for General and Comparative Physiology, 2nd edn. Prentice Hall.
Hou, J., Rajagopal, M. and Yu, A. S. L.(2013). Claudins and the kidney.Annu. Rev. Physiol.75, 479-501. doi:10.1146/annurev-physiol-030212-183705
Ivanis, G., Braun, M. and Perry, S. F.(2008). Renal expression and localization of SLC9A3 sodium/hydrogen exchanger and its possible role in acid-base regulation in freshwater rainbow trout (Oncorhynchus mykiss).AJP Regul. Integr. Comp. Physiol.295, R971-R978. doi:10.1152/ajpregu.90328.2008
Kolosov, D. and Kelly, S. P.(2013). A role for tricellulin in the regulation of gill epithelium permeability.AJP Regul. Integr. Comp. Physiol.304, R1139-R1148. doi:10.1152/ajpregu.00086.2013
Kolosov, D. and Kelly, S. P.(2018). Tricellular tight junction-associated angulins in the gill epithelium of rainbow trout. AJP Regul. Integr. Comp. Physiol. 315, R312-R322. doi:10.1152/ajpregu.00431.2017
Kolosov, D., Bui, P., Chasiotis, H. and Kelly, S. P.(2013). Claudins in teleost fishes.Tissue Barriers1, e25391. doi:10.4161/tisb.25391
Kolosov, D., Chasiotis, H. and Kelly, S. P.(2014). Tight junction protein gene expression patterns and changes in transcript abundance during development of model fish gill epithelia.J. Exp. Biol.217, 1667-1681. doi:10.1242/jeb.098731
Kolosov, D., Bui, P., Donini, A., Wilkie, M. P. and Kelly, S. P.(2017). A role for tight junction-associated MARVEL proteins in larval sea lamprey (Petromyzon marinus) osmoregulation.J. Exp. Biol.220, 3657-3670. doi:10.1242/jeb.161562
Lawrence, M. J., Wright, P. A. and Wood, C. M. (2015). Physiological and molecular responses of the goldfish (Carassius auratus) kidney to metabolic acidosis, and potential mechanisms of renal ammonia transport.J. Exp. Biol.218, 2124-2135. doi:10.1242/jeb.117689
McDonald, D. G. and Wood, C. M.(1981). Branchial and renal acid and ion fluxes in the rainbow trout,Salmo gairdneri, at low environmental pH.J. Exp. Biol.93, 101-118.
McKinney, T. D. and Burg, M. B.(1977). Bicarbonate transport by rabbit cortical collecting tubules-Effect of acid and alkali loads in vivo on transport in vitro.J. Clin. Invest.60, 766-768. doi:10.1172/JCI108830
Messerli, M. A., Robinson, K. R. and Smith, P. J. S.(2006). Electrochemical sensor applications to the study of molecular physiology and analyte flux in plants. InPlant Physiology: Theory and Methods(ed. A. G. Volkov), pp. 73-107. Berlin Heidelberg: Springer Berlin Heidelberg.
Pacey, E. K. and O’Donnell, M. J.(2014). Transport of H+ , Na+
and K+ across the posterior midgut of blood-fed mosquitoes (Aedes aegypti). J. Insect Physiol. Elsevier Ltd,61, 42-50. doi:10.1016/j.jinsphys.2013.12.008
Perry, S. F. and Fryer, J. N.(1997). Proton pumps in the fish gill and kidney.Fish Physiol. Biochem.17, 363-369. doi:10.1023/A:1007746217349
Perry, S. F. and Gilmour, K. M.(2006). Acid-base balance and CO2excretion in fish: Unanswered questions and emerging models.Respir. Physiol. Neurobiol.
154, 199-215. doi:10.1016/j.resp.2006.04.010
Perry, S. F., Furimsky, M., Bayaa, M., Georgalis, T., Shahsavarani, A., Nickerson, J. G. and Moon, T. W. (2003a). Integrated responses of Na+/ HCO3−cotransporters and V-type H+-ATPases in the fish gill and kidney during respiratory acidosis. Biochim. Biophys. Acta. 1618, 175-184. doi:10.1016/j. bbamem.2003.09.015
Perry, S. F., Shahsavarani, A., Georgalis, T., Bayaa, M., Furimsky, M. and Thomas, S. L. Y.(2003b). Channels, pumps, and exchangers in the gill and kidney of freshwater fishes: their role in ionic and acid-base regulation.J. Exp. Zool.300A, 53-62. doi:10.1002/jez.a.10309
Piermarini, P. M. and Evans, D. H. (2001). Immunochemical analysis of the vacuolar proton-ATPase B-subunit in the gills of a euryhaline stingray (Dasyatis sabina): effects of salinity and relation to Na+
/K+
-ATPase.J. Exp. Biol. 204, 3251-3259.
Piñeros, M. A., Shaff, J. E. and Kochian, L. V. (1998). Development, characterization, and application of a cadmium-selective microelectrode for the
measurement of cadmium fluxes in roots ofThlaspispecies and wheat.Plant Physiol.116, 1393-1401. doi:10.1104/pp.116.4.1393
Reilly, B. D., Cramp, R. L., Wilson, J. M., Campbell, H. A. and Franklin, C. E.
(2011). Branchial osmoregulation in the euryhaline bull shark,Carcharhinus leucas: a molecular analysis of ion transporters.J. Exp. Biol.214, 2883-2895. doi:10.1242/jeb.058156
Riggs, A. F.(1988). The Bohr effect.Annu. Rev. Physiol.50, 181-204. doi:10.1146/ annurev.ph.50.030188.001145
Roa, J. N., Munévar, C. L. and Tresguerres, M. (2014). Feeding induces translocation of vacuolar proton ATPase and pendrin to the membrane of leopard shark (Triakis semifasciata) mitochondrion-rich gill cells. Comp. Biochem. Physiol. Part A.174, 29-37. doi:10.1016/j.cbpa.2014.04.003
Sakai, T.(1985). The structure of the kidney from the freshwater teleostCarassius auratus.Anat. Embryol. (Berl).171, 31-39. doi:10.1007/BF00319052
Schwartz, G. J., Kittelberger, A. M., Barnhart, D. A. and Vijayakumar, S.(2000). Carbonic anhydrase IV is expressed in H+
-secreting cells of rabbit kidney.AJP Ren. Physiol.278, F894-F904. doi:10.1152/ajprenal.2000.278.6.F894
Seshadri, R. M., Klein, J. D., Smith, T., Sands, J. M., Handlogten, M. E., Verlander, J. W. and Weiner, I. D.(2006). Changes in subcellular distribution of the ammonia transporter, Rhcg, in response to chronic metabolic acidosis.AJP Ren. Physiol.290, F1443-F1452. doi:10.1152/ajprenal.00459.2005
Smith, P. J. S., Sanger, R. H. and Jaffe, L. F.(1994). The vibrating Ca2+electrode: a new technique for detecting plasma membrane regions of Ca2+influx and efflux. Methods Cell Biol.40, 115-134. doi:10.1016/S0091-679X(08)61112-7
Soleimani, M., Greeley, T., Petrovic, S., Amlal, H., Kopp, P., Burnham, C. E., Greeley, T., Wang, Z., Amlal, H., Kopp, P. et al.(2001). Pendrin: an apical Cl−/ OH−/HCO3−exchanger in the kidney cortex.AJP Ren. Physiol.280, F356-F364. doi:10.1152/ajprenal.2001.280.2.F356
Somero, G. N.(1986). Protons, osmolytes, and fitness of internal milieu for protein function.Am. J. Physiol. Regul. Integr. Comp. Physiol.251, R197-R213. doi:10. 1152/ajpregu.1986.251.2.R197
Sussman, C. R., Zhao, J., Plata, C., Lu, J., Daly, C., Angle, N., Dipiero, J. A, Drummond, I..
Teranishi, K., Mekuchi, M. and Kaneko, T.(2013). Expression of sodium/hydrogen exchanger 3 and cation-chloride cotransporters in the kidney of Japanese eel acclimated to a wide range of salinities.Comp. Biochem. Physiol. A.164, 333-343. doi:10.1016/j.cbpa.2012.11.011
Tresguerres, M., Katoh, F., Fenton, H., Jasinska, E. and Goss, G. G.(2005). Regulation of branchial V-H+-ATPase, Na+/K+-ATPase and NHE2 in response to acid and base infusions in the Pacific spiny dogfish (Squalus acanthias).J. Exp. Biol.208, 345-354. doi:10.1242/jeb.01382
Tresguerres, M., Parks, S. K., Wood, C. M. and Goss, G. G.(2007). V-H+-ATPase translocation during blood alkalosis in dogfish gills: interaction with carbonic anhydrase and involvement in the postfeeding alkaline tide.Am. J. Physiol. Regul. Integr. Comp. Physiol.292, R2012-R2019. doi:10.1152/ajpregu.00814.2006
Van Itallie, C. M., Holmes, J., Bridges, A., Gookin, J. L., Coccaro, M. R., Proctor, W., Colegio, O. R. and Anderson, J. M.(2008). The density of small tight junction pores varies among cell types and is increased by expression of claudin-2.J. Cell Sci.121, 298-305. doi:10.1242/jcs.021485
Wang, X. and Kurtz, I.(1990). H+/base transport in principal cells characterized by confocal fluorescence imaging.Am. J. Physiol. Cell Physiol.259, C365-C373. doi:10.1152/ajpcell.1990.259.2.C365
Weiner, D. and Hamm, L. L.(1990). Regulation of intracellular pH in the rabbit cortical collecting tubule.J. Clin. Invest.85, 274-281. doi:10.1172/JCI114423
Weiner, I. D. and Verlander, J. W.(2013). Renal ammonia metabolism and transport.Compr. Physiol.3, 201-220. doi:10.1002/cphy.c120010
Weiner, I. D. and Verlander, J. W.(2017). Ammonia transporters and their role in acid-base balance.Physiol. Rev.97, 465-494. doi:10.1152/physrev.00011.2016
Wheatly, M. G., Hobe, H. and Wood, C. M.(1984). The mechanisms of acid-base and ionoregulation in the freshwater rainbow trout during environmental hyperoxia and subsequent normoxia. II. The role of the kidney.Respir. Physiol.55, 155-173. doi:10.1016/0034-5687(84)90020-3
Wood, C. M.(1988). Acid-base and ionic exchanges at gills and kidney after exhaustive exercise in the rainbow trout.J. Exp. Biol.136, 461-481.
Wood, C. M., Milligan, C. L. and Walsh, P. J.(1999). Renal responses of trout to chronic respiratory and metabolic acidoses and metabolic alkalosis.AJP Regul. Integr. Comp. Physiol.277, R482-R492. doi:10.1152/ajpregu.1999.277.2.R482
Wood, C. M., Bucking, C. and Grosell, M.(2010). Acid-base responses to feeding and intestinal Cl− uptake in freshwater- and seawater-acclimated killifish, Fundulus heteroclitus, an agastric euryhaline teleost. J. Exp. Biol. 213, 2681-2692. doi:10.1242/jeb.039164
Wright, P. A., Wood, C. M. and Wilson, J. M.(2014). Rh versus pH: the role of Rhesus glycoproteins in renal ammonia excretion during metabolic acidosis in a freshwater teleost fish.J. Exp. Biol.217, 2855-2865. doi:10.1242/jeb.098640