An Analysis of Crystallization Process in Amorphous Alloys
Using Time-Scaling Factor
Yoshihiro Takahara and Nobutaka Narita
Department of Materials Science and Engineering, Kyushu Institute of Technology, Kitakyushu 804-8550, Japan
We have investigated the time-scaling properties of the isothermal crystallization process for Cu66Ti34and Zr65Cu35amorphous alloys by
differential scanning calorimetry. Local atomic structures have also been studied by extended X-ray absorption fine structure (EXAFS) measurements. The results are discussed in comparison with the previous results obtained for metal-metalloid amorphous alloys. The time-scaling factor is defined as the time when the crystallization has reached half completion. By retime-scaling the time axis for each annealing temperatures, the crystallization curves measured at various temperatures for each alloy can be superimposed on a single curve in each case. The Williams-Landel-Ferry formula based on a free-volume consideration gives a universal function for the temperature dependence of the time-scaling factor for all the alloys. This suggests that we have to take into account the relaxation process occurring in the amorphous phase during the crystallization. The WLF analysis reveals that there exists a significant difference in the temperature dependence of the scaling factor between the metal-metal and metal-metalloid amorphous alloys. From the EXAFS study, such difference is considered to be due to the local structural differences between those two types of amorphous alloys.
(Received November 27, 2002; Accepted February 3, 2003)
Keywords: time-scaling, crystallization, amorphous alloy, Williams-Landel-Ferry formula, local atomic structure, extended X-ray absorption fine structure
1. Introduction
Since the unique properties of amorphous alloys deterio-rate drastically upon crystallization, it is quite important to understand the crystallization processes in amorphous alloys for their technical applications. The subject is also of scientific interest as it represents a phase transformation occurring under extreme conditions far from equilibrium. The mechanisms involved in the irreversible transformation from the metastable amorphous state to the stable crystalline state and their kinetics depend on composition, population of nucleation sites, diffusion parameters, thermal history of the sample, etc. However, a similarity is observed in the shape of crystallization curves, in spite of these differences.
Recently, scaling concepts have been applied to the description of the crystallization process of amorphous alloys that is a first-order phase transformation. So far, the success of scaling concepts in describing the crystallization kinetics has been reported in amorphous Fe–Ni–P,1)Fe–B–Si,2,3)Fe– B–Si–(Cr or C)4) alloys. In previous paper,5) we have reported the first systematic investigation on the time-scaling properties of the crystallization kinetics in four kinds of transition metal-metalloid amorphous alloys which exhibit a single crystallization stage and no supercooled liquid region before crystallization. We have revealed that the crystal-lization process in all the alloys studied obeys a time-scaling law and the temperature dependence of the time-scaling factor can be well described by the Williams-Landel-Ferry formula.6)The purpose of this study is to investigate the time-scaling properties of crystallization processes in the transition metal-transition metal amorphous alloys, namely, Cu–Ti and Zr–Cu alloys. The difference in the scaling properties between transition metal-transition metal amorphous alloys and transition metal-metalloid amorphous alloys are also disccussed. Differential scanning calorimetry (DSC) is used to study the crystallization processes.
2. Experimental Procedure
Amorphous ribbons of Cu66Ti34 and Zr65Cu35 were
prepared by a single roller melt-spinning technique in a purified argon atmosphere. The melt-spun ribbons were about 5 mm in width and 30 to 40mmin thickness. The amorphicity of the ribbons was examined by X-ray diffraction with Cu K radiation. Calorimetric measurements were performed using a Rigaku DSC-8230B with computerized data acquisition system. The temperature and energy axes of the instrument were calibrated from the melting endotherms of pure lead, zinc and tin. Linear heating and isothermal annealing DSC curves were measured. In the isothermal experiments, the amorphous ribbon was heated at a rate of 0.33 K/s from room temperature to the annealing temperature and then annealed. The annealing temperatures were in range from about 91 to 96% of the crystallization temperature for each ribbon. The DSC measurements were made in a purified argon (6N) flow. A powdery Al2O3 was used as a reference material. In order
to investigate local atomic structures, we also measured extended X-ray absorption fine structure (EXAFS) spectra at room temperature. The measurement was carried out in the transmission mode by the use of an EXAC-800 laboratory EXAFS system (Technos Corp.) which consists of rotating anode X-ray generator, curved-crystal monochromator and solid state detector. Johansson-type Ge(220) crystal (2d¼0:40000nm) was used as the monochromator.
3. Results and Discussion
The onset temperatures of crystallization measured by DSC at a heating rate of 0.33 K/s are 686 K for Cu66Ti34alloy
and 667 K for Zr65Cu35 alloy. A single exothermic peak was
observed on the isothermal DSC curves for both alloys, indicating that the crystallization of those alloys occurred in a single stage. The crystallization kinetics was characterized
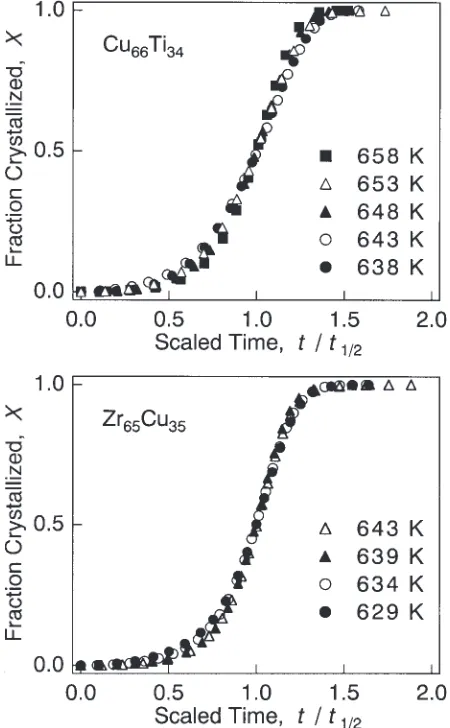
crystallization exotherm. This is the point where the DSC curve starts to deviate from the baseline. The extrapolation of the baseline under the peak was estimated using the assumption that the contributions of the amorphous and crystalline phases to the specific heat of the partially crystallized sample were in direct proportion to their volume fractions.7)The volume fraction crystallizedxðtÞat any timet was determined as the ratio A(t)/A(1), where A(t) is the area under the exothermic peak up to timetand A(1) is the total area. The xðtÞ versus t relationships for each annealing temperature in Cu66Ti34 and Zr65Cu35 alloys are shown in
Fig.1 and are of the familiar sigmoidal type. The crystal-lization process is accelerated with increasing temperature. The qualitative similarity in the shape of these isotherms strongly suggests that the data can be replotted on a scaled time axis. We can characterize the time scale of the crystallization by defining the timet1=2 at which the
crystal-lization is 50% complete. The value oft1=2can be regarded as
a measure of nucleation and growth parameters in the crystallization process. We experimentally determined the time t1=2 and redefined the time scale to be t=t1=2 for each
isotherm of both alloys. Figure 2illustrates the results of the
rescaling procedure for both alloys. Obviously, all the time-scaled isotherms of each alloy are superimposed on a single curve in each case, demonstrating that the crystallization kinetics obeys a time-scaling law. It is noteworthy that the annealing temperatures adopted here are in the range from 91 to 96% of the crystallization temperature for each alloy. Although scaling characteristics of some iron-based amor-phous alloys1–5)have been reported, to our knowledge, this is the first test on metal-metal amorphous alloys.
Figure3 shows the temperature dependence of the time-scaling factor t1=2. In both alloys, the time-scaling factor
increases rapidly with decreasing temperature. Roig et al.1)
have also reported similar behavior in an amorphous Fe–Ni– P alloy. They suggest that it is inappropriate to regard the very large temperature variation of the characteristic time as a simple activated process. The steep increase of the time-scaling factor with decreasing temperature means slowing down of the crystallization process. This is characteristic of relaxation phenomena in the amorphous state. Several empirical expressions so far have been proposed to describe the temperature dependence of relaxation processes in amorphous state. Among them we used the Williams-Landel-Ferry (WLF) formula6) to describe the temperature dependence of the scaling factor because the WLF formula involves only two parameters as shown in the equation,
Fig. 1 Volume fraction crystallized X as a function of time t for the Cu66Ti34and Zr65Cu35amorphous alloys at various temperatures.
Fig. 2 Time-scaled curves of volume fraction crystallized for the Cu66Ti34
[image:2.595.314.539.73.437.2] [image:2.595.54.281.388.758.2]t1=2¼t0exp
20:4ðTT0Þ
101:6þTT0
ð1Þ
whereT0 is the reference temperature andt0 is the value of
t1=2 atT0. This formula is based on free-volume
considera-tions and holds for a wide variety of polymers. As mentioned in the original paper,6) the universality of the formula suggests that the free volume at the glass transition temperature Tg and the rate of increase of the free volume
with temperature are the same for all polymers. The solid lines in Fig.3are fits to the WLF formula. Quite satisfactory fits are obtained for each alloy. The values of the fitting parameters t0 andT0 were 1:58106s and 600 K,
respec-tively for Cu66Ti34 and5:45105s and 585 K, respectively
for Zr65Cu35.
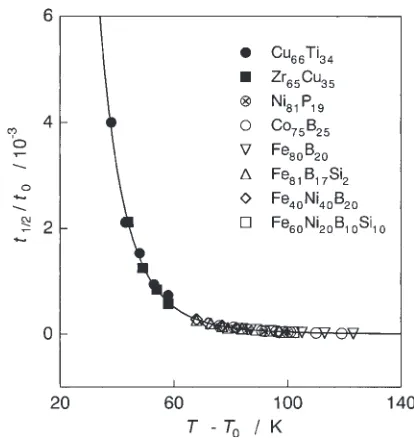
Dividing both sides of eq. (1) byt0we obtain a universal
function of TT0 for all samples. Figure4 shows the
universal plot oft1=2=t0 againstTT0 values. In the figure,
we also plot the data obtained for transition metal-metalloid amorphous alloys5)for comparison. Although values of two coefficients (20:4and 101.6) in eq. (1) are determined from the composite curves calculated for polymers, all the data points fall on the universal curve in the range covered. This demonstrates that the temperature dependence of the time-scaling factor for the crystallization process in these amorphous alloys can be described by the WLF formula.
Fundamentally, the WLF formula is an expression which represents the temperature dependence of free volume. Therefore, The result of Fig.4suggests that the rate-limiting steps in crystallization process involve relaxation processes accompanied with free volume changes in the amorphous phase. In Fig.4, it is noteworthy that a distinct difference is observed on the temperature dependence of the scaling factor between the metal-metal and metal-metalloid amorphous alloys. The metal-metal amorphous alloys locate at the region ofTT0<60K, and the metal-metalloid amorphous alloys
locate at the region ofTT0>60K.
In order to investigate the origin of this difference, we measured the Cu K-edge EXAFS spectra for Cu66Ti34 and
Zr65Cu35 amorphous alloys. The EXAFS signals were
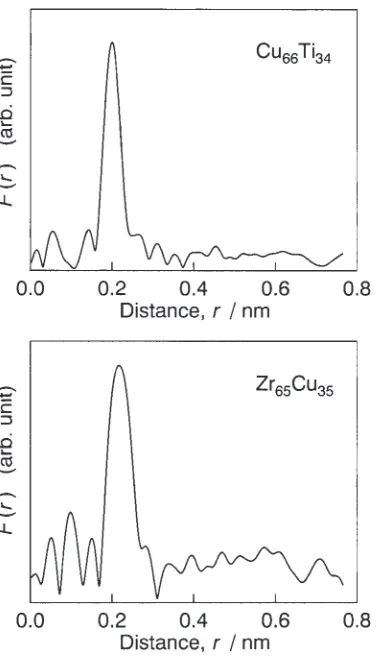
extracted from the raw data using a standard procedure.8) The absorption background below the K-edge was extra-polated to the EXAFS region by a Victoreen fit, and the atomic absorption was approximated by a polynomial expression. Figure5 indicates the radial structure functions FðrÞobtained for Cu66Ti34 and Zr65Cu35 amorphous alloys.
Each radial structure function represents a single peak well isolated in the vicinity of 0.20 nm for Cu66Ti34 and of
0.22 nm for Zr65Cu35. The inverse Fourier transformation of
FðrÞ was employed to the isolated first peak to obtain a filtered EXAFS function in k space. The obtained filtered EXAFS functions are shown in Fig.6 (solid circles). The nearest neighbor distance and coordination number around Cu atom were determined from the filtered EXAFS function by a curve-fitting method. The two-shell approximation was employed for curve-fitting. The phase shift and backscatter-ing amplitude calculated from curved-wave theory9) were used in the curve-fitting procedure. The results of the fitting are illustrated by solid lines in Fig. 6. The structural parameters obtained by the curve-fitting are summarized in Table1. The values obtained here agree with those reported by Raouxet al.10)for Cu66Ti34 and by Chen and Waseda11)
for Zr65Cu35. It is evident from the result that local atomic
structures of Cu66Ti34and Zr65Cu35 amorphous alloys differ Fig. 3 Temperature dependence of the scaling factort1=2for the Cu66Ti34
and Zr65Cu35 amorphous alloys. The solid lines are fits to the WLF
formula as described in the text.
Fig. 4 Plot of the ratiot1=2=t0versus temperatureTT0. Solid line is the
[image:3.595.321.528.69.288.2] [image:3.595.67.274.69.413.2]from those of the metal-metalloid amorphous alloys. It is known that the local atomic structure of the metal-metalloid amorphous alloys is well described by trigonal prismatic structural units in which six metal atoms surround a central metalloid atom.12–14)Local atomic structures of amorphous materials significantly influence relaxation processes. Con-sequently, such structural differences are considered to be responsible for the difference in temperature dependence of the scaling factor between the metal and metal-metalloid amorphous alloys as observed in Fig. 4.
4. Conclusion
The isothermal crystallization process was studied using time-scaling factor for Cu66Ti34 and Zr65Cu35 amorphous
alloys. The results were compared to the previous results obtained for metal-metalloid amorphous alloys. The follow-ing conclusions can be drawn:
(1) The isothermal crystallization curves measured at various temperatures for each alloy can be super-imposed on a single curve in each case when the time axis is rescaled by a characteristic time t1=2. This
demonstrates that the crystallization process of those alloys obeys a time-scaling law within the annealing temperatures used in this study.
(2) The temperature dependence of the characteristic time can be described by the Williams-Landel-Ferry formula based on a free-volume consideration. This strongly suggests that the rate-determining steps in the crystal-lization process involve relaxation processes in the amorphous phase. In the WLF analysis, a significant difference is observed in the temperature dependence of the characteristic time between the metal-metal and metal-metalloid amorphous alloys. This difference is considered to result from local structural differences between those two types of amorphous alloys.
REFERENCES
1) A. Roig, J. S. Munoz, M. B. Salamon and K. V. Rao: J. Appl. Phys.61 (1987) 3647–3649.
2) Y. Wolfus, Y. Yeshurun, I. Felner and J. Wolny: Solid State Comm.61 (1987) 519–521.
3) N. Kunitomi: J. Japan Inst. Metals56(1992) 487–493. Fig. 5 Radial structure functions for the Cu66Ti34and Zr65Cu35amorphous
alloys.
Fig. 6 Comparison between EXAFS experimental data (closed circle) and curve-fitting result (solid line) for the Cu66Ti34and Zr65Cu35amorphous
[image:4.595.77.266.69.397.2]alloys. Table 1 Interatomic distancesrand coordination numbersNof nearest
neighbors in the Cu66Ti34and Zr65Cu35amorphous alloys.
Alloy Terms r(nm) N
Cu66Ti34
Cu–Cu 0.241 3.4
Cu–Ti 0.261 5.5
Zr65Cu35
Cu–Cu 0.247 4.4
[image:4.595.322.530.71.421.2] [image:4.595.44.292.479.549.2]4) C. F. Conde, H. Miranda and A. Conde: J. Mater. Sci.24(1989) 1862– 1866.
5) Y. Takahara: Mater. Trans., JIM37(1996) 1453–1457.
6) M. L. Williams, R. F. Landel and J. D. Ferry: J. Am. Chem. Soc.77 (1955) 3701–3707.
7) M. G. Scott and P. Ramachandrarao: Mater. Sci. Eng.29(1977) 137– 144.
8) Y. Udagawa: (Ed.),Extended X-ray Absorption Fine Structure, Japan Scientific Societies Press, Tokyo, 1993.
9) A. D. MacKale, B. W. Veal, A. P. Paulikas, S. K. Cahn and G. S. Knapp: J. Am. Chem. Soc.110(1988) 3763–3768.
10) D. Raoux, J. F. Sadoc, P. Lagarde, A. Sadoc and A. Fontaine: J. de Phys.41(1980) C8-207-210.
11) H. S. Chen and Y. Waseda: Phys. Stat. Sol. (a)51(1979) 593–599. 12) P. H. Gaskell: J. Non-Cryst. Solids32(1979) 207–224.
13) E. V. Pustovalov, N. D. Zakharov and V. S. Plotnikov: Phys. Stat. Sol. (a)135(1993) K1-K4.