Soil properties are continuous variables; their values at various points differ according to changes in direction and distance from nearby samples (Burgess and Webster 1980). It is caused by a number of factors and processes acting at different spatial and temporal scales (Borůvka et al. 2002).
When dealing with site-specific management (nowadays mostly named as Precision Farming), soil variation in terms of space and time is a key element. If there were no variation, production through traditional practices with proper adjust-ment for actual field conditions would be sufficient (Goderya 1998). Castrignano et al. (1998) describe that spatial characterization of soil properties is necessary in order to locate homogenous areas to be carefully managed for agricultural sustainable development. Borůvka et al. (2002) remark that the task is to reveal at least some of the factors influencing soil variation and use this knowledge to design agricultural management practices that would be both environment friendly and highly productive.
Geostatistics provides us with the tools to explore the structure of spatial variation in soil (Oliver 1999). The variogram is a critical input to geosta-tistical studies (Gringarten and Deutsch 2001). It is a tool to investigate and quantify the spatial variation of the phenomenon under study. The variogram measures the spatial dependence of soil properties using semivariance. Computation of average semivariance between any pair of
sam-pling points is widely presented by many authors, e.g. Webster and Oliver (2000):
(1)
where the z(xi) and z(xi+h) represent actual values of Z (soil variable) at places separated by h (lag distance), m is the number of pairs of data points separated by h. Plotting average semivariance against the lag generates experimental variogram which can be fitted by a continuous model. The most common are exponential and spherical mod-els. The exponential model with nugget is given by the formula (Webster and Oliver 2000):
(2)
where Co is a nugget variance, C is the sill variance,
h is the scalar of h in equation (1) and r (rexp) is a distance parameter that defines the spatial extent of the model (effective range a is then about3rexp). The spherical model with nugget is given by the formula (Webster and Oliver 2000):
(3)
where a is the range (asph).
As many authors (e.g. McBratney and Pringle 1997, Cambardela and Karlen 1999) suggest, there is a need to develop a database identifying
spa-Consistency of spatial dependence of soil chemical
properties in two fields: a geostatistical study
L. Brodský, V. Vaněk, L. Borůvka, J. Száková
Czech University of Agriculture in Prague, Czech Republic
ABSTRACT
This study examined consistency of spatial variation of plant-available soil nutrients P, K, Mg and soil pH in two fields of an area of 54 and 67.5 ha (haplic Luvisol and luvic Chernozem) in the region of Český Brod (Central Bohe-mia). Computed variograms showed a spatial dependence extending to 150 m on an average with small fluctuations for most analysed data sets. These results of two different fields indicate that soil spatial variation is rather a general feature than specific to every field. However, soil available Mg in one field showed a shorter-range (89 m) and soil pH in the other showed considerably longer-range (375 m). Consistency of spatial variation features makes it possible to construct regional average and proportional variograms with great precision. This can bring further practical oppor-tunities.
Keywords: soil properties; spatial variation; geostatistics; variogram; spatial dependence
Supported by the Ministry of Education, Youth and Sports of the Czech Republic, Grant No. MSM 412100005.
�
�
�
� � � � ( ) 1 2 ) ( ) ( 2 1 )( mh x x h
i i i
z z m h �� � � � � � � � � �
� 1 exp( )
) ( r h C Co h � �� � � � �� � � � � � � � � � � � � 3 2 1 2 3 ) ( a h a h C Co h
� h�a
C
h)�
(
tial distributions of soil properties, there is also a need to implement management regimes in different regions. The cataloguing of the spatial variation of soil properties also needs a uniform set of methods to allow effective comparisons. McBratney and Pringle (1997) constructed aver-age and proportional variograms of soil properties based on a vast literature search. The variograms show fairly high fluctuation as they are gathered from many different studies.
In this paper we investigated soil spatial variation of two larger fields not far apart (~ 10 km) in the region of Český Brod (Central Bohemia). Variogram of regionalized variable theory as a principal tool was used to identify the magnitude of spatial vari-ation. As the two fields may be well representative of the region, we compared them for consistency or differences in spatial variation features.
MATERIAL AND METHODS
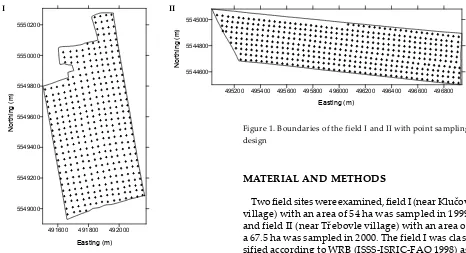
Two field sites were examined, field I (near Klučov village) with an area of 54 ha was sampled in 1999 and field II (near Třebovle village) with an area of a 67.5 ha was sampled in 2000. The field I was clas-sified according to WRB (ISSS-ISRIC-FAO 1998) as haplic Luvisol and the field II as luvic Chernozem with a contribution of haplic Chernozem in the central part.
Soil samples were collected from topsoil (0 to 30 cm) using the point sampling method with regular grid square pattern of 40 × 40 m across the whole fields. 14 individual core samples were taken from each point (sampling area) from a circle area with a radius of 3 m from the centre point. The total number of soil samples collected from field I was 368 and from field II 426 (Figure 1). The coordinate system is in UTM projection, WGS-84 datum. Mehlich III extraction procedure was ap-plied to release available P, K and Mg for their de-termination. Soil pH was determined in 0.2 M KCl extract. See details of the methodology in Brodský et al. (2001) and Brodský (2003). Geostatistics, using GS+ (Robertson 2000), was used to explore spatial variation of soil in the field.
491600 491800 492000 5549000
5549200 5549400 5549600 5549800 5550000 5550200
Easting (m)
N
or
th
in
g
(m
) 495200 495400 495600 495800 496000 496200 496400 496600 496800
5544600 5544800 5545000
Easting (m)
N
or
th
in
g
(m
[image:2.595.62.528.63.316.2])
Figure 1. Boundaries of the field I and II with point sampling design
I II
Table 1. Summary statistics of determined soil properties
Characteristic P K Mg pH
(mg/kg)
Field I
mean 25.6 211.4 141.4 7.2
variance 204.5 7375 448.2 0.13
min 4.0 101.2 89.9 5.7
max 105.0 953.4 258.1 7.6
Field II
mean 34.1 141.3 121.1 6.4
variance 181.5 1284 287.7 0.31
min 10.4 58.9 68.4 5.0
[image:2.595.62.531.592.767.2]RESULTS AND DISCUSSION
[image:3.595.95.455.432.742.2]Summary statistics
Table 1 gives the summary statistics of the deter-mined soil properties. According to classification of soil test levels for Mehlich III solution extrac-tion method average values of P show a very low level for both fields with values up to medium level. Average values of K show medium levels for field I and low levels for field II ranged from low to very high level. The average values of Mg show low levels for both fields, which range from very low to high level for field I and medium level for field II. Soil pHKCl average values show a neutral level for field I and a slightly acidic level for field II. The range in the data cover intervals of soil acidity from slightly acidic to alkaline for field I and from acidic to alkaline for field II.
Basic geostatistical analysis
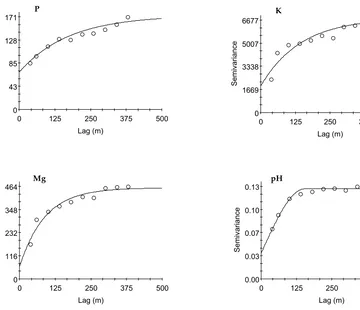
Experimental variograms were calculated from all available data from the examined fields and math-ematical models were applied to them (Figures 2 and 3). Exponential model with nugget (2) was used in most cases (for soil P, K, and Mg). However,
a spherical model with nugget (3) was used for soil pH data for both fields. Since the semivari-ance analysis in different axis orientation did not show any significant changes, all the presented variograms (Figures 2 and 3) are isotropic.
The parameters of the modelled variograms are presented in Tables 2 and 3. Based on the for-mula (1), the variogram gives an estimate of half the average squared difference between all pairs of observations separated by the lag. The sill for P data equals 170 (field I) and 174 (field II). This means that pairs of P values would be expected to differ on an average by ±18.4 and ±18.6 mg/kg at the separation distance greater than the range. The values of range parameter for P in the two fields are also very close (174 m for field I and 182 m for field II). The pairs of K values would be expected to differ at the separation distance greater than the range on average by ±116.8 and ±50.1 mg/kg, respectively. However, though there was found a substantial difference in the sill of K variogram between the two fields, the magnitude of the range parameter showed great consistency (144 for field I and 146 m for field II). The pairs of Mg values would be expected to differ at the sepa-ration distance greater than the range on average by ±30.2 and ±23.3 mg/kg, respectively. The range parameters were, however, slightly different: 89 m
0 43 85 128 171
0 125 250 375 500
Semivariance
Lag (m)
0 1669 3338 5007 6677
0 125 250 375 500
Semivariance
Lag (m)
0.00 0.03 0.07 0.10 0.13
0 125 250 375 500
Semivariance
Lag (m) 0
116 232 348 464
0 125 250 375 500
Semivariance
Lag (m)
P K
Mg pH
[image:3.595.86.275.434.740.2](field I) and 145 m (field II). For pH data sets and the separation distances greater than the range (155 m for field I and 375 m for field II), the pairs of pH values would be expected to differ on aver-age by ±0.5 and ±0.7 units, respectively.
The results show that variogram range param-eters fluctuate on average around 150 m for most of the determined soil properties in both fields. There is also a need to say that the results represent a sampling of similar domain size (54 and 67.5 ha) and the same field sampling methodology. These results of the two fields show that soil spatial vari-ation is rather a more general feature than only a specific to every field.
All the resulting ranges accord with the expect-ed results shown in Wollenthaupt et al. (1995). Cambardella et al. (1994), Frogbrook (1999), and Cambardella and Karlen (1999) also showed similar results. However, soil available Mg in the field I showed shorter range parameter (89 m) and soil pH in the field II showed considerably longer range (375 m). The long-range structure is an indica-tion of a trend in the data. When the exponential model was applied to the experimental variogram of soil pH in the field II, the resulting parameters (Co = 0.107, Co + C = 0.413, rexp = 457 m) showed even longer range of the variogram. This finding also justified the comparability between the range
parameters (rexp) of exponential variogram mod-els and the range (asph) of the spherical variogram models in this study.
Field variation in soil properties is caused by interaction of several independent soil forming processes, such as geology, relief, climate, etc., and also by agricultural management practices. The result of shorter range for Mg in the field I was associated with parent material rather than with management practices. The result of soil pH in the field II should be further investigated.
Not only the results of ranges, describing spatial dependence within the fields, but also the fluctua-tions of measured soil properties at the determined separation distances were found to show remark-able similarity. The exception in the results is the K data set for field I and II. The expected fluctuation of K in the field I was found to be more than two times higher than in the field II, at corresponding distances. The higher variance and semivariance values of K data in the field I might be explained by irregular fertilizer application on the field in the past. The field practitioners have revealed this, but no written evidence from that time (about 15 years ago) has been found yet.
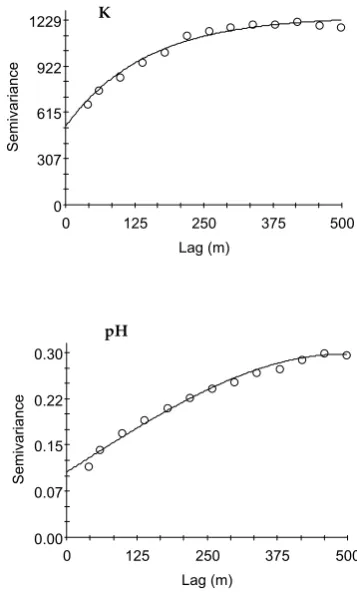
[image:4.595.322.501.65.366.2]The semivariances of some soil properties showed a further increase above calculated sill in the dis-tance much longer than the range. This increase
Figure 3. Variograms of determined soil P, K, Mg and pH (field II)
0 43 86 129 173
0 125 250 375 500
Semivariance
Lag (m)
0 307 615 922 1229
0 125 250 375 500
Semivariance
Lag (m)
0 69 137 206 274
0 125 250 375 500
Semivariance
Lag (m)
0.00 0.07 0.15 0.22 0.30
0 125 250 375 500
Semivariance
Lag (m)
P K
was considered as wide-range spatial dependence, on the separation distances of a bigger sampling area. Another spatial structure of the variogram could be modelled if there were more data in a broader region.
Relative value Co/(Co + C) was used to compare spatial dependence of the determined soil proper-ties. Cambardella et al. (1994), and Cambardella and Karlen (1999) presented the classification of spatial dependence in three categories (weak < 0.25, moderate 0.25–0.75, and strong > 0.75) according to the share of the nugget on the total sill. Most of the determined soil properties showed moder-ate spatial dependence. The only strong spatial dependence was classified for soil available Mg in the field I.
Spatially uncorrelated structure of the variogram (nugget Co) is usually associated with sampling and analytical errors, and variation on shorter distance than applied sampling grid. The statisti-cal results of the quality assurance of analytistatisti-cal data, shown in Brodský et al. (2001) and Brodský (2003), revealed very low deviation of repeated measures. Thus, the contribution of the analytical error in the nugget value must be small.
Geostatistical analysis of soil spatial variation proved to be an effective method to investigate spatial features, which are not analysed by tra-ditional basic summary statistics. Identification of spatially dependent component of variogram revealed that most determined soil properties have very consistent magnitude of spatial variation in
the two fields. The variogram ranges showed spatial dependence to 150 m on average. This indicates that the spatial processes worked at the same spatial level.
These results suggest that it is possible to calcu-late an average and proportional variograms for a region, which would exhibit only within region fluctuations. This variogram is potentially benefi-cial, for instance, in optimal sampling design for investigation of the other fields in the region. It is also possible to suggest that data with a consider-able trend should not be applied to the calculation of the average and proportional variograms.
REFERENCES
Borůvka L., Donátová H., Němeček K. (2002): Spatial distribution and correlation of soil properties in a field: a case study. Rostl. Výr., 48: 425–432.
Brodský L. (2003): Application of geostatistics for map-ping spatial variability of soil agrochemical properties. ČZU, Praha. (In Czech)
Brodský L., Vaněk V., Száková J., Štípek K. (2001): Spatial variability of soil properties. Rostl. Výr., 47: 521–528.
Burgess T.M., Webster R. (1980): Optimal interpolation and isarithmic mapping of soil properties. I. The semi-variogram and punctual kriging. J. Soil Sci., 31: 315 – 331.
Cambardella C.A., Karlen D.L. (1999): Spatial analysis of soil fertility parameters. Precis. Agr., 1: 5–14.
Characteristic P K Mg pH
Nugget Co 68.5 1 910 60.0 0.037
Sill Co + C 169.5 6 829 456.0 0.132 Range asph/rexp (m) 173.5 143.9 88.7 154.5
Co/(Co + C) 0.40 0.28 0.13 0.28
[image:5.595.64.533.84.190.2]Model exponential exponential exponential spherical
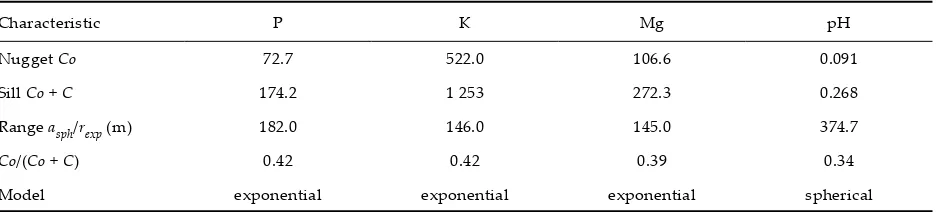
Table 3. Parameters of variogram models (field II)
Characteristic P K Mg pH
Nugget Co 72.7 522.0 106.6 0.091
Sill Co + C 174.2 1 253 272.3 0.268 Range asph/rexp (m) 182.0 146.0 145.0 374.7
Co/(Co + C) 0.42 0.42 0.39 0.34
[image:5.595.65.533.239.345.2]Cambardella C.A., Moorman T.B., Novak J.M., Parkin T.B., Karlen D.L., Turko R.F., Konopka A.E. (1994): Field-scale variability of soil properties in central Iowa soils. Soil Sci. Soc. Am. J., 58: 1501–1511.
Castrignano A., Mazzoncini M., Giugliarini L. (1998): Spatial characterization of soil properties. Adv. GeoEcol., 31: 105–111.
Frogbrook Z.L. (1999): The effect of sampling intensity on the reliability of predictions and maps of soil prop-erties. In: Stafford J.V. (ed.): Precision agriculture ’99, 2nd Eur. Conf., Denmark: 71–80.
Goderya F.S. (1998): Field scale variations in soil prop-erties for spatially variable control: A review. J. Soil Contam., 7: 243–264.
Gringarten E., Deutsch C.V. (2001). Variogram interpreta-tion and modelling. Mathem. Geol., 33: 507–534. ISSS-ISRIC-FAO (1998): World reference base for soil
resources. World Soil Res. Rep. FAO, Rome, 84.
McBratney A.B., Pringle M.J. (1997): Spatial variability in soil – implications for precision agriculture. In: Stafford J.V. (ed.): Precision agriculture. Oxford, England: 3–29.
Oliver M.A. (1999): Exploring soil spatial variation geostatistically. In: Stafford J.V. (ed.): Precision agri-culture ’99, 2nd Eur. Conf., Denmark: 3–17.
Robertson G.P. (2000): GS+: Geostatistics for the environ-mental sciences. Gamma Design Software, Plainwell, Michigan, USA.
Webster R., Oliver M.A. (2000): Geostatistics for envi-ronmental scientists. John Wiley, New York.
Wollenhaupt N.C., Mulla D.J., Gotway Crawford C.A. (1995): Soil sampling and interpolation techniques for mapping spatial variability of soil properties. In: Pierce F.J., Sadler E.J. (eds.): The state of site-specific management for agriculture. ASA, CSSA, SSSA, Madi-son, Wisconsin, USA: 677 (2): 19–53.
Received on May 3, 2004
ABSTRAKT
Shoda prostorových závislostí chemických vlastností půd na dvou pozemcích: geostatistická studie
Práce porovnává shodu prostorové variability půdních živin P, K, Mg a pH půdy na dvou pozemcích o rozloze 54 a 67,5 ha (hnědozem modální a černozem luvická) v oblasti Českého Brodu. Ukázalo se, že rozsah (range) sestro-jených variogramů zkoumaných dat vykazuje prostorovou závislost do hodnot okolo 150 m s vysokou shodou. Tyto výsledky dvou pozemků poukazují na fakt, že zákonitost půdní prostorové variability je obecnější záležitostí než jen vlastností specifickou pro každý pozemek. Přesto výsledky vykazují jisté odchylky: rozsah variogramu pro Mg na jednom pozemku byl kratší (89 m) a rozsah pro pH půdy na druhém pozemku byl podstatně delší (375 m). Jestliže existuje shoda vlastností prostorové variability, je možné sestrojit průměrný a proporcionální variogram pro daný region s vysokou přesností. Tento variogram přináší řadu možností praktického využití.
Klíčová slova: půdní vlastnosti; prostorová variabilita; geostatistika; variogram; prostorové závislosti
Corresponding author: