Agric. Econ. – czEch, 54, 2008 (10): 489–497 489 The support to farmers working in less favoured
areas has had a more than thirty-years tradition in Europe. This subsidy is not expected to be exclud-ed from the EU funding programmes in the future (Blandford, Berketey 2008). The EU representatives are aware of these subsidies’ importance; however, in the EU there is not a uniform view on defining the conditions for payments (Střeleček et al. 2007; Doucha, Foltýn 2008). The aim of the payments is to maintain agriculture and the use of land by the means of adequate but not excessive financial compensa-tions (Štolbová 2008). in the czech republic, 50.8% of the total agricultural land is currently defined as LFA, of which the mountain areas account for 15%
of agricultural land and “other LFA” for 28.8% of agricultural land and the areas affected by specific handicaps represent 6.6% of agricultural land. The minimum area of a holding was set at one hectare of grassland in the terms of the LFA support eligibility. The czech republic only provides payments for per-manent grassland acreage which lacks similarity with any other EU country. By contrast, the cr does not apply the payment reduction for large holdings which is typical for most of the EU countries (Štolbová 2007). Article 37 of the council regulation (Ec) 1698/2005 introduced the so-called “degressive or modulated payments” for all the EU countries. As of 2010, the payment rates differentiation based on the size of the
The impact of the LFA payments on the FADN farms
in the Czech Republic
Hodnocení dopadů plateb LFA na hospodářské výsledky podniků
FAND v ČR
M. Štolbová, T. Hlavsa
Institute of Agricultural Economics and Information, Prague, Czech Republic
Abstract: This paper analyses the impact of the LFA payments on farms economic results on the basis of the Farm Accoun-tancy Data network in the czech republic. Firstly, the approaches are compared to the structure of farms based on the LFA type. Secondly, the share of the LFA payments on economic results of farms is evaluated. The evaluation considers the LFA type, share of grassland, size of the eligible area of farms. Basic economic indicators are being monitored, such as gross Farm income, Farm net Value Added, Family Farm income, current subsidies, of which in particular the LFA payments. The share of the LFA payments in economic results of agricultural holdings is compared. As a result of the analysis, the winners and losers of the current system were defined.
Key words: less favoured areas (LFA), Farm Accountancy Data network (FADn), LFA payments, gross Farm income, Farm net Value Added, Family Farm income
Abstrakt: Autoři zkoumají dopady plateb LFA na hospodářské výsledky podniků na základě výsledků FADn v České repub-lice. Analýze předchází porovnání přístupů ke členění podniků podle typu LFA. následně je hodnocen podíl plateb LFA na výsledcích podniků FADn podle typů LFA, podílu travních porostů, velikosti oprávněné plochy. Jsou monitorovány základ-ní ekonomické ukazatele, jako je hrubá přidaná hodnota, čistá přidaná hodnota, důchod ze zemědělské činnosti, provozzáklad-ní dotace a z nich zejména platby LFA. Je porovnáván podíl kompenzačních plateb LFA na tvorbě ekonomických výsledků podniků. Jako výsledek analýz současného systému poskytování plateb LFA jsou vytipováni vítězové a prohrávající.
Klíčová slova: méně příznivé oblasti, zemědělská účetní datová síť FADn, platby LFA, hrubá přidaná hodnota, čistá přida-ná hodnota, důchod ze zemědělské činnosti
490 Agric. Econ. – czEch, 54, 2008 (10): 489–497 farm is expected to be implemented in those countries
where it has not been applied so far, that is also in the czech republic (Froněk et al. 2007).
This paper discusses the impact of LFA payments on the economic results of czech agricultural hold-ings from various points of view. An international comparison is offered on the basis of the standardised FADn outputs in the selected EU member states.
MATERIAL AND METHODS
The objective is to analyse the impact of the LFA payments on farm economic results on the basis of the FADn in the czech republic (Liaison Agency... 2004–2006). The specific aggregation of farms is used to assess the impact of the LFA payment on the economic results of agricultural activities of the FADn holdings. A methodical approach is proposed that classifies holdings with regard to monitoring the impact of the LFA payment impact (Štolbová et al. 2008). The holdings are classified by the LFA type, size of eligible land and the share of grassland in agricultural land and the production orientation. Based on analyses, the role of the LFA payments in farms economic results in individual types of the LFA is assessed. The subsequent analysis assesses the share of the LFA payments in the economic re-sults of the FADn holdings in the average of years 2004, 2005 and 2006. Basic economic indicators are monitored, such as gross Farm income (gFi), Farm net Value Added (FnVA), Family Farm income (FFi), the current subsidies, of which the LFA payments
as the mean value for groups of holdings. The share of the LFA payments in gFi or FnVA is compared. The different impact of the LFA payments in recal-culation on hectare of agricultural farm land and in recalculation on Annual Work Unit (AWU) is also pointed out. As a result of analysis, the winners and losers of the current system were defined.
Agricultural holding classification used in this paper: The approach to classifying holdings by LFA varies depending on the applied methodology and purpose. in identical cases, it is essential to respect the pre-scribed EU methodology.
The classification of holdings within the Farm Accountancy Data network (FADn) for classification by the LFA is based on the commission regulation, Dg Agri, no. 2253/2004 defined by the communities committee for the FADn (Table 1). An agricultural holding (in the czech republic) is allocated to one of three groups depending on the share of agricultural land in the particular LFA type in the total agricultural land of the holding. A special attention is paid to mountain areas (M) but “other LFA” (o) and “areas with specific handicap” (S) are not specified in detail. holdings representing areas not included in the LFA are those with less than 50% of agricultural land in the LFA, according to this classification.
[image:2.595.59.539.533.619.2]Within the structure survey in agriculture, the czech Statistical office allocates a particular LFA to each evaluated farm determined by the munici-pality (nUTS V level) where the farm headquarters are located. Methodological instructions come from the Eurostat where such allocation is carried out by international experts on the basis of micro data
Table 1. FADn farms classification by LFA according to the European commission
classification of FADn Farm condition
non LFA > 50% agricultural land is outside LFA Mountain areas > 50% agricultural land is in mountain LFA
other than mountain LFA > 50% agricultural land in M + o + S and at the same time M < 50% Unimportant LFA areas in the EU where no LFA exist (does not apply on the czech republic) Source: community committee for the Farm Accountancy Data network, Farm returns Data Definitions, Brussels, June 2006, p. 8. Based on the commission regulation no. 2253/2004
Table 2. Farm classification by LFA type
classification Designation condition
non-LFA n > 95% agricultural land outside LFA Mountain area M > 50% agricultural land in mountain areas “other” LFA o > 50% agricultural land in “other” LFA
[image:2.595.63.534.682.767.2]Agric. Econ. – czEch, 54, 2008 (10): 489–497 491 mandatorily submitted to the Eurostat by all member
states. The company headquarters, however, do not necessarily have to be found in the municipality that is allocated to the same type of the LFA as most of the company’s agricultural land. This classification method in the czech republic provides a draft image of the number and orientation of agricultural farms, workers, agricultural land and farm animals bred in the individual LFA types.
in other cases, more precise methods of the LFA type classification have to be employed for the sake of more detailed analyses (Table 2). The FADn holdings with zero agricultural land used, garden centres, specialised vine or fruit growing holdings were excluded from the file. representative of the mountainous areas are the holdings where more than 50% agricultural land is situated in the mountain LFA. “other” LFA are hold-ings with over 50% agricultural land in “other” LFA and areas with specific handicaps are holdings with over 50% agricultural land in this LFA type. holdings with more than 95% agricultural land outside the LFA were chosen as the representatives of favourable natural conditions in the czech republic. holdings the shares of which regarding agricultural land in the individual LFA types do not meet the criteria are excluded from further calculations, even though more than 50% of their operations take place in the LFA. They do represent the LFA for the purposes of other analyses in this paper.
For the analysis of the impact of the current subsidies and the LFA payments according to land use, another specific aggregation of the FADn holdings was applied. The LFA group comprises holdings with more than
50% agricultural land in the LFA. representatives of outside the LFA holdings are agricultural holdings where less than 50% of agricultural land is included in the LFA. in these basic two groups, holdings with grassland up to 50% and over 50% of agricultural land were observed.
For the analysis of the current subsidies and the LFA payments impact according to the farm size, the FAnD holdings was aggregated in size categories by hectares of the eligible area (grassland in LFA) in farms. The holdings over 500 ha of agricultural land were used for the analysis according to the production structure. They were subdivided into groups according to the LFA (more than 50% of agricultural land in the LFA and less than 50% of agricultural land in the LFA) and to groups with and without dairy cows
RESULTS AND DISCUSSION
LFA payments and results of farms by the EU member states
First, the information based on the standardised FADn outputs for 2004 obtained from the Dg Agri was calculated in the selected EU member states (Štolbová 2007). Figure 1 shows the gross Farm income (gFi) and the contribution of subsidies, of which the LFA payments, to its creation. For a better comparison, this information provided in EUr per company was converted per hectare of agricultural land.
[image:3.595.75.513.518.710.2]it may be observed that the LFA compensation payments reduce the difference between the gross
Figure 1. gross Farm income and the share of the LFA payments in its generation by the LFA in the selected EU member states (EUr per 1 ha of agricultural land)
Source: Dg Agri, 2006
0 200 400 600 800 1000 1200 1400 1600 1800 2000 no n L FA m ou nt , L FA ot he r L FA no n L FA ot he r L FA no n L FA m ou nt , L FA ot he r L FA no n L FA ot he r L FA no n L FA m ou nt , L FA ot he r L FA no n L FA ot he r L FA no n L FA ot he r L FA ot he r L FA no n L FA ot he r L FA no n L FA m ou nt , L FA ot he r L FA no n L FA m ou nt , L FA ot he r L FA no n L FA m ou nt , L FA ot he r L FA no n L FA m ou nt , L FA ot he r L FA m ou nt , L FA ot he r L FA no n L FA m ou nt , L FA ot he r L FA no n L FA m ou nt , L FA ot he r L FA no n L FA ot he r L FA
CZ DE ES EE FR IE LT LU LV AT PL PT SE FI SK SL UK LFA payments per ha
Subsidies per ha excl. LFA GFI minus subsidies per ha
492 Agric. Econ. – czEch, 54, 2008 (10): 489–497 farm income generated by companies in less favoured
areas and companies operating in better natural con-ditions but full compensation is not in place, like in the czech republic. According to the 2004 data, the exceptions were Austria and Finland where the gFi per hectare generated in mountain and other (non mountain) LFA was higher in average per hectare of agricultural land than that in areas with more fa-vourable farming conditions. The search for causes would probably require a more detailed analysis that is beyond the scope of this paper. on the contrary, in germany, France, UK and Spain, the averages per hectare of agricultural land companies in the LFA are far from reaching the gFi of companies outside the LFA, even if they received subsidies.
Figure 1 shows that in the context of the selected EU member states, the level of gFi per hectare of agricultural land in the EU 10 is generally lower than in the EU 15 states, which reflects the generally lower economic standard in the EU 10 states (most regions in these countries are included in the objective 1 regions within the EU Structural Policy).
Share of the LFA payments in the economic results of agricultural holdings by the LFA type in the Czech Republic
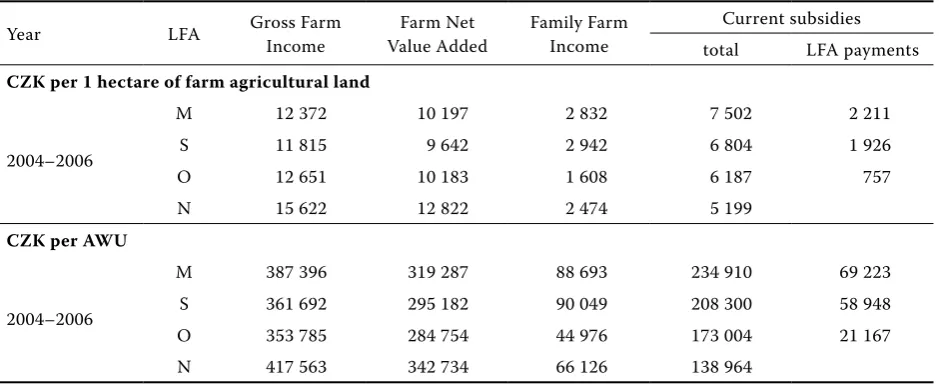
Table 3 compares the average values of the selected indicators of income from agricultural activities per 1hectare of agricultural land and also per 1 annual working unit for groups of agricultural holdings al-located to the individual LFA types and outside the LFA. The averagegFi per hectare of agricultural land in holdings operating in mountain areas and areas
with specific handicaps was only 79% (or 76%) of the performance of holdings operating in favourable conditions, while the average for farms in “other” LFA, this was 81%. A similar proportion can be seen in FnVA per hectare of agricultural land. Subsidies per hectare of agricultural land in mountain areas were by 44% higher than in holdings in favourable conditions, in areas with specific handicaps they were by 31% higher and in “other” LFA they were by 19% higher. The average LFA payments per hectare of agricultural land in mountain LFA and areas with specific handicaps exceeded those in “other” LFA. As a result, the average FFi from agricultural activi-ties per hectare of agricultural land was the lowest in “other” LFA and the highest in mountain LFA. The amount of FFi is influenced also by external factors, such as wages, rent of land and interest. These items were, in average, higher per hectare of agricultural land in holdings outside the LFA than in the LFA, in particular they were low in the mountain LFA and in the areas with specific handicaps.
[image:4.595.64.534.558.750.2]These indicators are influenced by a lower number of workers per 100 hectares of agricultural land espe-cially in mountain LFA (3.2) and areas with specific handicaps (3.3) while in “other” LFA 3.6 and outside the LFA, 3.7 workers per 100 hectares of agricultural land. As a result, the FFi per 1 AWU in mountain LFA and areas with specific handicaps exceeded this indicator in the non- LFA by 34% (36%). on the contrary, “other” LFA (which were designated as areas with an above-average share of agricultural employment in the economically active population) have achieved a very low FFi per 1AWU. The Farm net Value Added converted per 1 AWU and the share of the current subsidies, of which the LFA payments,
Table 3. Selected indicators of economic result according LFA types
Year LFA gross Farm income Value AddedFarm net Family Farm income current subsidies total LFA payments CZK per 1 hectare of farm agricultural land
2004–2006
M 12 372 10 197 2 832 7 502 2 211
S 11 815 9 642 2 942 6 804 1 926
o 12 651 10 183 1 608 6 187 757
n 15 622 12 822 2 474 5 199
CZK per AWU
2004–2006
M 387 396 319 287 88 693 234 910 69 223
S 361 692 295 182 90 049 208 300 58 948
o 353 785 284 754 44 976 173 004 21 167
n 417 563 342 734 66 126 138 964
Agric. Econ. – czEch, 54, 2008 (10): 489–497 493 in its formation in the individual LFA types for years
2004–2006 are shown in Figure 2.
Share of the LFA payments in the economic results of agricultural holdings according to the permanent grassland share in agricultural land and the LFA
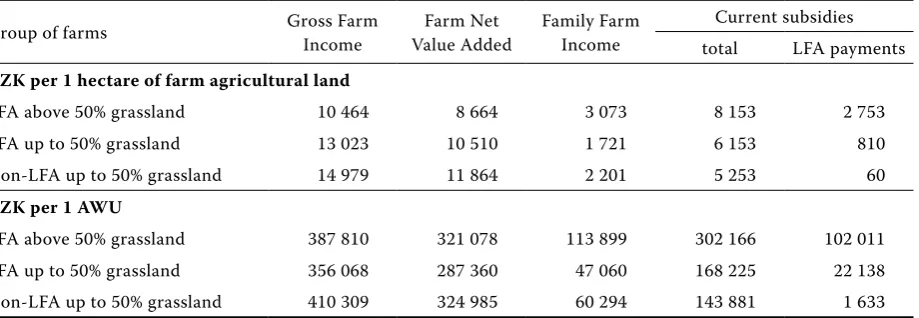
in compliance with the system of the LFA measure-ment in the czech republic, the eligible area for the LFA payments is the area of grassland only. holdings in the LFA and outside the LFA in 2004–2006 were sub-divided according to the proportion of grassland in agricultural land, so that the impact of agricul-tural land use on the size of gFi, FnVA, and the FFi formation and its structure has also been evaluated.
The LFA group comprises holdings with more than 50% agricultural land in the LFA. representatives of the group outside the LFA are agricultural holdings where less than 50% of agricultural land is included in the LFA. in these basic two groups, holdings with grassland up to 50% and over 50% of agricultural land were observed. As documented in Table 4, it is clear that the share of grassland significantly in-fluences the total amount of subsidies and the LFA payments per hectare of agricultural land as well as per 1 AWU. The information in the table indi-cates that even in holdings representing the group outside the LFA, these payments can contribute to the economic result because part of the land can be situated in the LFA.
[image:5.595.116.454.70.256.2]companies with high grassland shares employ less workers. The holdings with grassland making up Figure 2. Share of LFA payments in the FnVA by the LFA type – years 2004–2006
Source: FADn riAE 2004–2006 by the EU FADn standard results 0
50 000 100 000 150 000 200 000 250 000 300 000 350 000 400 000
M S O N M S O N M S O N
2 004 2 005 2 006
FNVA without subsidies Current subsidies without LFA payments LFA payments
c
z
K
/A
W
U
Table 4. Basic economic indicators of holdings by grassland share and LFA, average of years 2004–2006 in recalculation per 1 hectare of agricultural and 1 AWU
group of farms gross Farm income Value AddedFarm net Family Farm income current subsidies total LFA payments CZK per 1 hectare of farm agricultural land
LFA above 50% grassland 10 464 8 664 3 073 8 153 2 753
LFA up to 50% grassland 13 023 10 510 1 721 6 153 810
non-LFA up to 50% grassland 14 979 11 864 2 201 5 253 60
CZK per 1 AWU
LFA above 50% grassland 387 810 321 078 113 899 302 166 102 011
LFA up to 50% grassland 356 068 287 360 47 060 168 225 22 138
non-LFA up to 50% grassland 410 309 324 985 60 294 143 881 1 633
[image:5.595.74.534.588.747.2]494 Agric. Econ. – czEch, 54, 2008 (10): 489–497 more than 50% of agricultural land employ in average
2.7 AWU per 100 ha of agricultural land. The average number of 3.7 AWU per 100 ha of agricultural land was identified in both groups of holdings (LFA and non-LFA) with lower grassland shares. This factor together with czech payments system created big differences in FFi per hectare as well as per 1 AWU among the analyzed groups of holdings. The lowest
[image:6.595.101.505.67.291.2]gFi and FnVA per hectare of agricultural land were recorded by holdings with a large share of grassland. But due to subsidies, the farms with a large share of grassland in the LFA have even higher FFi per hectare than those of the farms outside LFA operating mainly on arable land. in the recalculation per 1 AWU, the lowest gFi, FnVA and FFi were recorded by the farms in the LFA with less than 50% of grassland. Figure 3. Share of subsidies and the LFA payments in FnVA per 1 AWU to the share of grassland in agricultural land and the LFA – years 2004–2006
Source: FADn riAE 2004–2006 by the EU FADn standard results
–100 000 0 100 000 200 000 300 000 400 000 LFA above 50% grassland
LFA up to 50% grassland non LFA up to 50% grassland LFA above 50% grassland LFA up to 50% grassland non LFA up to 50% grassland LFA above 50% grassland LFA up to 50% grassland non LFA up to 50% grassland
CZK per AWU
FNVA without subsidies Current subsidies witout LFA payments LFA payments
20
04
20
05
20
06
Figure 4. Family Farm income per 1 AWU and the contribution of the LFA payments – classification of holdings by the eligible area
Source: FADn riAE 2004–2006 by the EU FADn standard results
0 20 000 40 000 60 000 80 000 100 000 120 000 140 000 160 000 180 000
Family Farm Income in it LFA payments
0
to
5
0
50
–1
00
10
0–
20
0
20
0–
30
0
30
0–
40
0
40
0–
50
0
50
0–
60
0
60
0–
70
0
70
0–
80
0
80
0–
90
0
90
0–
1
00
0
1
00
0–
1
20
0
1
20
0–
1
40
0
1
40
0–
1
60
0
1
60
0–
2
00
0 ha
c
z
K
/A
W
[image:6.595.102.499.494.713.2]Agric. Econ. – czEch, 54, 2008 (10): 489–497 495 Figure 3 shows the average Farm net Value Added
converted per 1 AWU and the share of the current subsidies and in that of the LFA payments in its for-mation in these groups of holdings in the average of years 2004–2006.
Results of farms in the LFA by the size of eligible land
Another aspect used in the analysis of the LFA pay-ments on the economic results of agricultural holdings was the size of the farm eligible land. in 2004–2006, the eligible land for the LFA payments was the area of grassland in the cadastral areas classified as LFA. The minimum size of the holding eligible for the LFA payments was 5 hectares of agricultural land. This is why holdings with less than 5 ha agricultural land in the LFA were first excluded from the FADn LFA database in 2004–2006. other holdings were sub-divided into groups according to the grassland area in the LFA, i.e. the farm eligible land.
Depending on the increased size of the holdings eligible area, the FFi also is on the rise both converted per 1 hectare of agricultural land and per 1 AWU. While the analyses proved a dependence of economic results of the LFA holdings with high area of grassland on the LFA payments, those holdings form an exces-sive FFi thanks to the LFA payments, in particular when converted per 1 AWU, in comparison with the holdings outside the LFA (zero eligible area). The payment reduction by size of holdings eligible area would prevent an excessive compensation for some holdings, however, with respect to the current limita-tion of the eligible area only to permanent grassland,
it would not correspond to the size of holding, not reflecting the benefits of the holding size. Figure 4 shows the differences in the generated FFi per 1 AWU compared to the LFA payments per 1 AWU in the size groups of holdings.
Share of the LFA payments in the economic results of large holdings according to production structure and the LFA
A deep analysis of large agricultural holdings was carried out to evaluate the impact of production such as milk production and more extensive types of farming without dairy cows. The holdings larger than 500 ha of agricultural land were used for this analysis. The average gFi, FnVA and FFi generated by holdings in the individual groups and the contribu-tion of subsidies and the LFA payments in the average of years 2004–2006 per 1 hectare of agriculture land and per 1 AWU are provided in Table 5. it is evident that large farms in the LFA without milk production generated the lowest amount of gFi per hectare of agricultural land but, due to subsidies and very low external factors (wages, rent, interest per hectare), the highest FFi per hectare. The large farms with milk production employed in average 3.8 AWU per 100 ha of agricultural land in the LFA and 4.0 AWU per 100 ha of agricultural land in the group outside LFA. The large farms without milk production employed in average 1.4 AWU per 100 ha of agricultural land in the LFA and 2.8 AWU per 100 ha of agricultural land in the group outside the LFA.
[image:7.595.64.534.558.750.2]The LFA farms without milk production generated the gFi and FnVA per AWU by about 70% higher
Table 5. Basic economic indicators of large holdings to milk production and LFA average of years 2004–2006
group of farms gross Farm income Value AddedFarm net Family Farm income current subsidies total LFA payments CZK per 1 hectare of farm agricultural land
LFA with milk production 13 177 10 725 1 492 6 507 1 075
LFA without milk production 7 770 6 490 2 699 7 278 2 190
non-LFA with milk production 15 614 12 591 1 628 5 394 81
non-LFA without milk production 13 086 10 054 2 211 5 029 44
CZK per 1 AWU
LFA with milk production 346 424 281 956 39 218 171 086 28 263
LFA without milk production 573 720 479 208 199 284 537 365 161 674
non-LFA with milk production 389 998 314 482 40 651 134 715 2 015
non-LFA without milk production 465 877 357 933 78 700 179 035 1 567
496 Agric. Econ. – czEch, 54, 2008 (10): 489–497 than the LFA farms with milk production. FFi was
2.5 times higher and the current subsidies per 1 AWU were more than 3 times higher than average of the LFA farms with milk production. This big inequality in the LFA payments distribution is shown in Figure 5.
CONCLUSION
The EU countries do not apply a uniform meth-odology to determine the amounts of the LFA pay-ments. The payments and the differentiation of rates should be based on the effect of the adverse soil and climate conditions to contribute to the sustainable use of farmland in the LFA and, at the same time, to avoid overcompensation. The payments and list of crops to be subsidized fall within the competence of each country. Therefore, there are great differences between the EU countries in terms of the LFA pay-ments. comparison of the LFA payment rates cannot be made without the knowledge of the background of the LFA systems used in each country.
The analysis of the cr holdings shows the ever rising dependence of the holdings economic results on subsidies, and not only those for less-favoured areas, but even for the group of the FADn holdings operating outside the LFA. The impact analysis of the LFA payments provided for each LFA type proved the positive effect of the LFA payments to compensate the difference of economic results achieved by hold-ings in the LFA and outside the LFA. in particular,
the difference between holdings in mountain areas and outside the LFA has gradually lowered so that the Farm net Value Added converted per 1 Annual Work Unit (AWU) for an average representative of mountain areas reached the level of this indicator for the holdings outside the LFA in the period of 2005–2006. in the period of 2004–2006, the average Family Farm income (FFi) as the synthetic indica-tor of economic results converted per 1 hectare of agricultural land as well as per 1 AWU was higher for the representatives of mountain areas and areas affected by specific handicaps than that for holdings outside the LFA. The identified proportions indicate that some holdings in mountain areas or areas af-fected by specific handicaps may have been paid a higher level of the LFA payments than is relevant to compensate the existing handicaps.
[image:8.595.87.512.67.289.2]The permanent grassland share in agricultural land has a large importance in the impact of the LFA payment to gross Farm income (gFi) and Farm net Value Added (FnVA) rates as created by the LFA holdings. in particular, the differences between the LFA holdings with a high percentage of grassland and holdings outside the LFA have considerably reduced when converted per 1 AWU in 2006 vs. 2004, so that for 2006 both gFi and FnVA were higher than that in the outside LFA holdings. in the period 2004–2006, the family farm income average of LFA holdings with a high percentage of grassland exceeded consider-ably the FFi in the group of holdings outside the LFA both converted per 1 hectare of agricultural land (by Figure 5. Share of subsidies and the LFA payments in FnVA per AWU in holdings above 500 ha of agricultural land to milk production and the LFA – years 2004–2006
Source: FADn riAE 2004–2006 by the EU FADn standard results
–300 000 –200 000 –100 000 0 100 000 200 000 300 000 400 000 500 000 600 000 700 000 CZK per AWU
FNVA without subsidies Current subsidies without LFA payments LFA payments LFA without milk production
non LFA with milk production non LFA without milk production
LFA with milk production non LFA without milk production non LFA with milk production
LFA without milk production LFA with milk production non LFA without milk production non LFA with milk production LFA without milk production LFA with milk production
20
04
2
00
5
20
Agric. Econ. – czEch, 54, 2008 (10): 489–497 497 40%) and per 1 AWU (by 89%). The LFA payment
contribution to FFi of the LFA holdings with a high percentage of grassland averaged at 90% in the pe-riod of 2004–2006 while it even exceeded 100% for 2005. By contrast, the FFi converted per 1 hectare and 1 AWU showed by the LFA holdings with a lower percentage of grassland was by 22% lower than that of the holdings outside the LFA. These dispropor-tions evidence the existing unequal distribution of the LFA payments across the LFA holdings due to the current system of the LFA payments, i.e. only for the grassland areas.
Depending on the increase size of holdings eligi-bility area, the FFi also is on the rise both converted per 1 hectare of agricultural land and 1 AWU. While the analyses proved the dependence of economic results of the LFA holdings with a high percentage of grassland on the LFA payments, those holdings form an excessive FFi thanks to the LFA payments, in particular when converted per 1 AWU, in comparison with holdings outside the LFA. The payment reduc-tion by the size of the holdings eligible area would prevent the excessive compensation for some hold-ings, however, with respect to the current limitation of the eligible area only to permanent grassland, it would not correspond to the size of the holding, not reflecting the benefits of the holding size.
Very differentiated effects of the current subsidies and in them the LFA payments were experienced within large holdings (acreage above 500 ha of agricul-tural land) depending on the production orientation. The LFA holdings exceeding the acreage of 500 ha of agricultural land with milk production, as the repre-sentatives of a more labour intensive production line, realise, even if ranked amongst large holdings, a very low gFi, FnVA, and in particular FFi per 1 AWU. By contrast, the FFi per 1 hectare in the group of the LFA holdings with the acreage above 500 ha of agricultural land, but without milk production, exceeded the level of this indicator implemented by large LFA holdings with milk production by 81% and when converted per 1 AWU, it was more than five times higher. These achievements were mainly due to subsidies that in average exceeded the amount of 537 thousand czK per 1 AWU in the period of 2004–2006. The
cur-rent system of the LFA payments prefers low labour requirement systems of management.
it is evident that an evaluation of the payment level and its impact on economic results of agricultural holdings has to be put into a broader context and the proposals have to take into account the potential impact on the holdings in the LFA as well as the rural countryside and community in the broader context. The whole system is desirable to be re-evaluated and the LFA scheme redesigned after 2010.
REFERENCES
Blandford D., Berketey h. (2008): Direction in rural Development Policy – Lesson from Both Sides of the Atlantic. Eurochoices, 7 (1): 6–11
Doucha T., Foltýn i. (2008): czech agriculture after the accession to the European Union – impacts on the development of its multifunctionality. Agricul-tural Economics – czech, 54 (4):150–157. Economic results of the czech Farms (2004, 2005,
2006). Liaison Agency of the Farm Accountancy Data network (FADn), VÚzE, Praha.
Froněk P., Jelínek L., Medonos T. (2007): The multic-riterial evaluation of agricultural enterprises. Ag-ricultural Economics – czech, 53 (3): 123–131. Štolbová M. (2007): comparative analysis of
less-fa-voured areas payments in the EU states. Agricul-tural Economics – czech, 53 (10): 455–465. Štolbová M. (2008): Eligibility criteria for
less-fa-voured areas payments in the EU countries and the position of the czech republic. Agricultural Economics – czech, 54 (4): 166–175.
Štolbová M., hlavsa T., Maur P. (2008): Dopady plateb LFA na ekonomické výsledky zemědělských podniků a návrhy na diferenciaci sazeb (impact of LFA payments on economics results of farms and proposal on rates differentiation). VÚzE Study no. 89; iSBn 978-80-86671-50-5.
Střeleček F., Lososová J., zdeněk r. (2007): Economic results of Agricultural Enterprises in 2005. Agri-cultural Economics – czech, 53 (5): 201–216.
Arrived on 10th January 2008
Contact address:
Tomáš hlavsa, Marie Štolbová, institute of Agricultural Economics and information in Prague, Mánesova 75, 120 58 Prague 2, czech republic