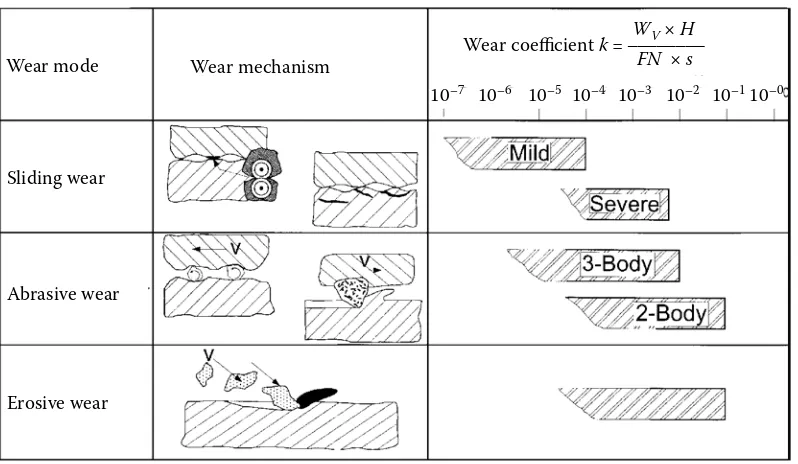
Wear by hard particles occurs in many different situations such as with earth-moving equipment, slurry pumps or pipelines, rock drilling, rock or ore crushers, pneumatic transport of powders, dies in power metallurgy, extruders, or chutes. According to Figure 1, the wear processes may be classified by different modes depending on the kinematics and by mechanisms depending on the physical and chemical interactions between the elements of the tribosystem which result in detaching the material from the solid surfaces. Compared with the unlubricated sliding wear, the value of the wear coefficient k, i.e. the dimensionless quotient of the amount of volumetric wear WV times the hardness of the wearing material H divided by the normal load FN and the sliding distances, as estimated from practical experience, can be substantially greater in abrasive or erosive wear (Zum Gahr 1998). Figure 1
can only represent a very rough estimation of the wear coefficient because of the wide variation of the wear mechanisms occurring in an actual tri-bosystem as a function of the operating conditions and properties of the triboelements involved, which can result in changes of the k value by some orders of magnitude.
In abrasive wear, the material is displaced or de-tached from the solid surface by hard particles or hard particles between or embedded in one or both of the two solid surfaces in relative motion, or by the presence of hard protuberances on the counterface sliding with the velocity v relatively along the surface. Two-body abrasion is caused by hard protuberances or embedded hard particles while in three-body abrasion the hard particles can move freely (roll or slide) between the contacting surfaces. According to Suchánek et al. (2007), the rate of the material
Supported by the Internal Grant Agency of the Czech University of Life Sciences in Prague, Faculty of Engineering, Project No. 31140/1312/313113.
Effect of abrasive particle size on abrasive wear
of hardfacing alloys
R. Chotěborský
1, P. Hrabě
1, M. Müller
1, J. Savková
2, M. Jirka
1,
M. Navrátilová
11
Department of Material Science and Manufacturing Technology, Faculty of Engineering,
Czech University of Life Sciences Prague, Prague, Czech Republic
2
New Technologies Research Centre in Westbohemian Region – NTC,
University of West Bohemia, Pilsen, Czech Republic
Abstract: Hardfacing is one of the most useful and economical ways to improve the performance of components submit-ted to severe wear conditions. This study has been made for the comparison of microstructure and abrasion resistance of hardfacing alloys reinforced with chromium carbides or complex carbides. The hardfacing alloys were deposited onto ČNS EN S235JR low carbon steel plates by the gas metal arc welding (GMAW) method. Different commercial hardfacing electrodes were applied to investigate the effect of abrasive particle size on abrasive wear resistance. The abrasion tests were made using the two-body abrasion test according to ČSN 01 5084 standard, abrasive cloths were of grits 80, 120, 240, and 400. Microstructure characterisation and surface analysis were made using optical and scanning electron microscopy. The results show the different influence of abrasive particles size on the wear rate for different structures of Fe-Cr-C system. The structures without primary carbides are of high abrasive wear rate, which increases nonlinearly with the increasing abrasive particle size. On the contrary, the structures containing primary carbides are of low abrasive rates and theses rates increase linearly with the increasing abrasive particle size.
removal in three-body abrasion can be one order of magnitude lower than that for two-body abrasion, because the loose abrasive particles abrade the solid surfaces between which they are situated only about 10% of the time, while they spend about 90% of the time rolling. Hard particles striking a solid surface carried either by a gas or a liquid stream can cause erosive wear whereby the wear mechanism depends strongly on the angle of incidence of the impacting particles. The interaction between hard particles and the solid surface can be generally accompanied by the events of adhesion, abrasion, deformation, heating, surface fatigue, and fracture. Figure 2 shows schematically some general trends of the wear loss of
materials depending on the properties of the abra-sive particles and the wearing materials as well as the operating conditions. With increasing hardness of the abrasive particles, the wear loss can increase by about one to two orders of magnitude from a low to a high level (Figure 2).
[image:2.595.97.496.54.286.2]Models for two-body abrasion have been devel-oped to a substantially greater depth than those for three-body abrasion. Penetration of a sliding abrasive particle into a metallic surface results in microploughing or microcutting depending on the attack angle. Below a critical attack angle, the metallic material is mainly elastically-plastically deformed and flows around and beneath the sliding Figure 1. Values of wear coefficient k as a function of wear mechanism without lubricating media (Zum Gahr 1998)
Figure 2. Schematic representation of wear loss by hard particles as a function of material properties such as hardness of abrasive particle (Zum Gahr 1998) Wear mode
Sliding wear
Abrasive wear
Erosive wear
WV × H
Wear coefficient k = ––––––––
FN × s
10–7 10–6 10–5 10–4 10–3 10–2 10–1 10–0 Wear mechanism
Soft ste el (200 H
V)
W
ea
r l
os
s
W
Hardness of abrasive particle
Glass Flint Garnet Al2O3 SiC
500 1 000 1 500 2 000 2 500
Cement ed carb
ides (W C-Co)
Hard
stee
l (70
0 H
V)
Britt le cer
amic (Al2O
[image:2.595.70.362.539.743.2]particle but no material is removed from the surface. Increasing the attack angle leads to a transition from microploughing to microcutting, i.e. material flows up the front face of the abrasive particle and is de-tached from the wearing surface in the form of a chip (Zum Gahr 1998; Colaco & Vilar 2003a).
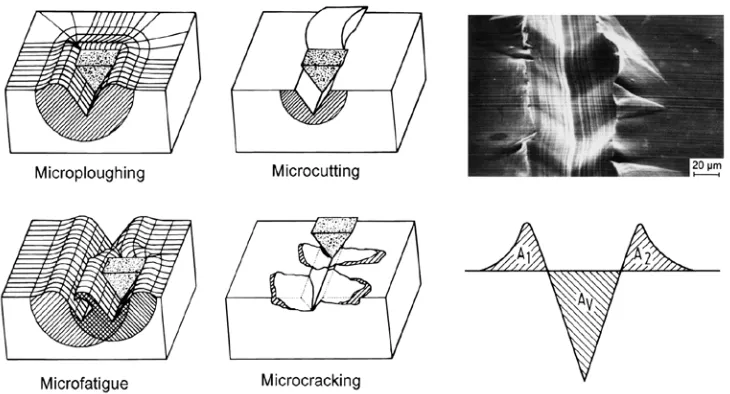
Hence, a more general model was developed which describes abrasive wear by distinguishing four types of interaction between the abrasive particles and wearing material (Figure 3), namely microplough-ing, microcuttmicroplough-ing, microfatigue, and microcracking. In the ideal case, microploughing, due to a single pass of one abrasive particle, does not result in any detachment of material from the wearing surface. A prow is formed ahead of the abrading particle and the material is continuously displaced sideways to form ridges adjacent to the groove produced. The volume loss can, however, occur owing to the action
of many abrasive particles or the repeated action of a single particle. The material may be ploughed aside repeatedly by passing particles and may break off by low cycle fatigue, i.e. microfatigue. Pure microcut-ting results in a volume loss by chips equal to the volume of the wear grooves. Microcracking occurs when highly concentrated stresses are imposed by abrasive particles, particularly on the surface of brittle materials. In this case, large wear debris is detached from the wearing surface owing to the crack formation and propagation. Microplough-ing and microcuttMicroplough-ing are the dominant processes on ductile materials while microcracking becomes important on brittle materials (Zum Gahr 1998; Sevim & Eryurek 2006; Suchánek et al. 2007).
Composites can offer the answer for achieving high hardness and sufficient fracture toughness to avoid brittle fracture. Second phases, e.g. hard
[image:3.595.63.428.55.252.2]ce-Figure 3. Schematic rep-resentation of different interactions between slid-ing abrasive particles and the surface of materials (Zum Gahr 1998)
[image:3.595.74.377.545.751.2]ramic particles or fibers, can be incorporated into a softer and more ductile matrix. The abrasive wear resistance of such composites depends on different microstructural parameters such as the hardness, shape, size, volume fraction, and distribution of the embedded phases, the properties of the matrix and the interfacial bonding between the second phase and the matrix. Figure 4 shows different interactions between abrasive particles and a reinforcing phase. Hard and soft abrasive particles, i.e. harder or softer than the reinforcing phase, and also small and large sizes of the reinforcing phase are distinguished. Hard abrasive particles can easily dig out small phases and cut or crack larger ones. Soft abrasive particles are able to dig out small phases or produce large pits. The indentation depth of soft abrasive particles is substantially reduced by hard reinforcing phases if the mean free path between them is smaller than the size of the abrasive particles. Large phases deficiently bonded to the matrix can be pulled out. However, large phases strongly bonded to the matrix can blunt or fracture soft abrasive particles (Colaco & Vilar 2003b; Buchely et al. 2005).
Hardfacing made using flame, electric arc, or plasma, are used in industry. Hardfacing makes a strong metallurgical point between the deposit and substrate. Filler materials in the form of coated elec-trodes, cored elecelec-trodes, welding rods and powder represent a wide assortment of metal and composi-tion materials of various properties. The choice of filler material and hardfacing technology depends on the part forms and dimensions, chemical composi-tion of the substrate, mode of stress, wear type, and total cost for hardfacing. Tribological properties depend on the filler material chemical composition and on the hardfacing technology. In the first layer
of the deposit, the mixing of the filler material and substrate occurs. Therefore, the required properties are reached mostly in the second layer of multilayers (Gülenc & Kahraman 2003; Yilmaz 2006; Cor-rea et al. 2007a,b).
Hardfacing materials of major volume of carbidic phase in the deposit are of a very good abrasion resistance. For usual temperatures, hardfacing materials on the basis of Fe-Cr-C are used, above all for their relatively low price. Complex deposit Fe-Cr-C-M (where M means Nb, W, Ti, Mo and their combination) are of higher abrasion resistance. The commercially produced hardfacing materials are usually of 3–5.5% carbon content (Atamert & Bhadeshia 1990; Asensio et al. 2003). By the use of these electrodes on the low carbon steel as substrate and one layer deposit, the hypoeutectic or eutectic structure is reached. In the case of complex alloyed deposit, the hypoeutectic structure with primary carbides of MC type (e.g. NbC, WC) oc-curs. The carbides M7C3 with high Cr contents can be reached only in the second and next layers (Ping Lu et al. 2004; Chotěborský 2008; Jankauskas et al. 2008).
ExPERiMENtAl PRoCEduRE
Materials and welding conditions
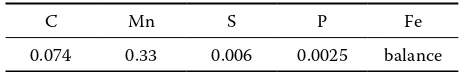
Steel according to ČSN EN S235JR was used as the substrate. Its composition, determined using the GDOES method, is presented in Table 1. The substrate plate used for surfacing was of dimensions 100 × 25 × 300 mm.
On this substrate plate, the filler materials were de-posited. Their nominal chemical composition is pre-sented in Table 2, welding conditions in Table 3.
Hardness measurement
[image:4.595.61.292.563.599.2]The bulk hardness of the hardfacing deposits was measured by the Vickers hardness method, while a Table 1. Chemical composition of substrate plate (weight %)
C Mn S P Fe
0.074 0.33 0.006 0.0025 balance
Table 2. Chemical composition of electrodes (weight %)
C Cr Nb Mo W V Si Mn Fe
Hardfacing 1 (H1) 3.2 29 – – – – 1.0 – balance
Hardfacing 2 (H2) 3.5 35 – – – – 1.0 – balance
Hardfacing 3 (H3) 4.4 23.5 5.5 6.5 2.2 1.5 – – balance
Hardfacing 4 (H4) 3.8 33 – 0.5 – – 1.2 – balance
Hardfacing 5 (H5) 4.5 17.5 5 1.0 1.0 1.0 0.5 0.5 balance
[image:4.595.67.533.635.756.2]microhardness tester allowed measuring the hard-ness of the phases in the microstructure by using a Vickers indenter with a load of 0.1 kg.
Microstructure analysis
Optical and scanning electron microscopes were used to analyse the microstructure of the specimens. Secondary electron imaging allowed morphologic description of the worn surfaces, while backscat-tered electron imaging and EDX compositional were used to describe qualitatively the chemical composi-tion of the phases in the microstructure.
Abrasive wear
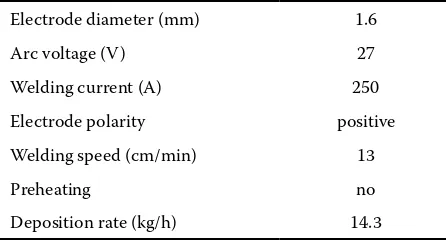
[image:5.595.315.521.58.172.2]The abrasive wear resistance was tested using the tester with bonded abrasive according to ČSN 01 5084 (1974). For the test, the abrasive cloth of 80, 120, 240, and 400 grits and the load of 2.35 kg were chosen. The mass lost was determined using the analytic balance of 0.0001 accuracy. The pin-on-disk testing machine (Figure 5) consists of a uniformly rotating disk whereon the abrasive cloth is fixed. The tested specimen is fixed in the holder and pressed Table 3. Welding conditions
Electrode diameter (mm) 1.6
Arc voltage (V) 27
Welding current (A) 250
Electrode polarity positive
Welding speed (cm/min) 13
Preheating no
[image:5.595.64.287.73.193.2]Deposition rate (kg/h) 14.3 Figure 5. Diagrammatic representation of the pin-on-disk testing machine: 1 – abrasive cloth, 2 – specimen, 3 – holder, 4 – weight, 5 – screw, 6 – nut with cogs, 7 – limit switch, 8 – pin, 9 – horizontal plate
Table 4. Chemical composition of weld deposit layers (weight %)
C Cr Nb Mo W V Si Mn Fe
First layer
Hardfacing 1 (H1) 2.93 26.31 – 0.6 – 0.19 1.06 1.0 balance
Hardfacing 2 (H2) 2.04 30.3 – – – 0.1 0.76 0.13 balance
Hardfacing 3 (H3) 4.27 19.1 4.64 4.44 0.75 1.35 1.08 0.21 balance
Hardfacing 4 (H4) 2.28 20.86 – 0.27 – 0.1 0.45 0.1 balance
Hardfacing 5 (H5) 3.5 12.42 2.45 0.59 0.31 0.63 0.38 0.55 balance
Hardfacing 6 (H6) 3.7 17.21 – 2.7 – 0.5 0.34 0.85 balance
Second layer
Hardfacing 1 (H1) 3.03 32.27 – 0.64 – 0.20 1.07 1.03 balance
Hardfacing 2 (H2) 2.93 31.16 – – – 0.18 0.80 0.15 balance
Hardfacing 3 (H3) 4.43 21.51 5.26 4.65 0.95 1.52 1.13 0.24 balance
Hardfacing 4 (H4) 3.03 31.98 0.36 0.15 0.64 0.15 balance
Hardfacing 5 (H5) 5.01 16.79 7.74 0.67 0.53 0.81 0.49 0.49 balance
Hardfacing 6 (H6) 3.9 18.65 – 2.9 – 0.55 0.33 0.84 balance
Third layer
Hardfacing 1 (H1) 3.1 33.36 – 0.66 – 0.20 1.17 1.07 balance
Hardfacing 2 (H2) 2.94 32.83 – – – 0.20 0.88 0.21 balance
Hardfacing 4 (H4) 3.41 32.78 – 0.42 – 0.17 0.68 0.17 balance
1 32
4 5 6 7
[image:5.595.67.531.433.759.2]a) H1 – first layer
b) H1 – second layer
c) H1 – third layer
d) H2 – first layer
e) H2 – second layer
f) H2 – third layer
g) H3 – first layer
h) H3 – second layer
a) H1 – first layer
b) H1 – second layer
c) H1 – third layer
d) H2 – first layer
e) H2 – second layer
f) H2 – third layer
g) H3 – first layer
h) H3 – second layer
a) H1 – first layer
b) H1 – second layer
c) H1 – third layer
d) H2 – first layer
e) H2 – second layer
f) H2 – third layer
g) H3 – first layer
h) H3 – second layer
a) H1 – first layer b) H1 – second layer
c) H1 – third layer d) H2 – first layer
e) H2 – second layer f) H2 – third layer
g) H3 – first layer h) H3 – second layer
(a) H1 – first layer
(c) H1 – third layer
(e) H2 – second layer
(d) H2 – first layer
(f) H2 – third layer (b) H1 – second layer
[image:6.595.129.291.51.630.2](g) H3 – first layer (h) H3 – second layer
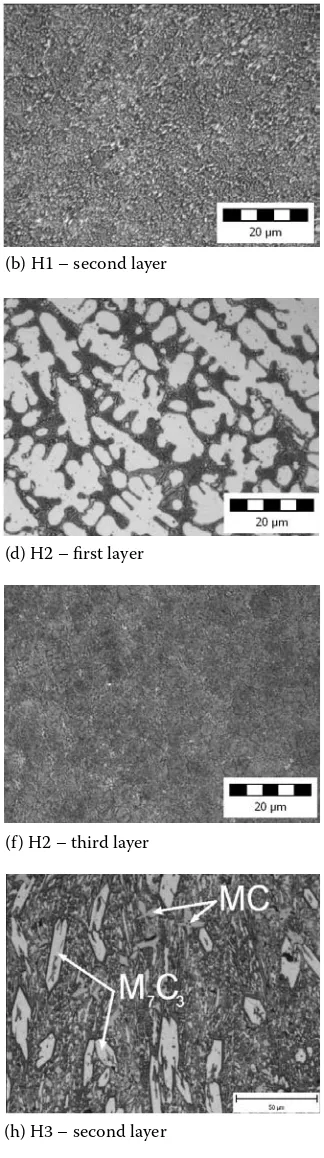
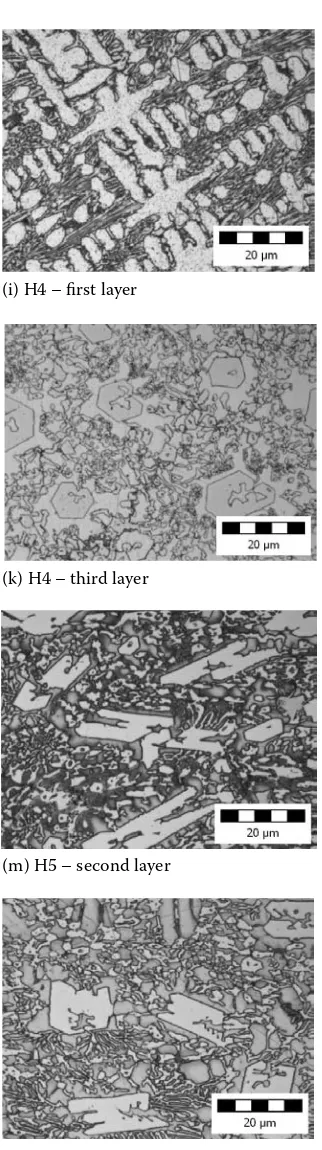
Figure 6. Structures of deposit using the optical microscopy
against the abrasive cloth by the weight of 2.35 kg. A screw makes possible the radial feed of the speci-men. The limit switch stops the test. During the test the specimen moves from the outer edge to the cen-tre of the abrasive cloth and a part of the specimen comes in contact with the unused abrasive cloth.
RESultS ANd diSCuSSioN
[image:6.595.308.470.55.634.2]Chemical composition and microstructure
i) H4 – first layer
j) H4 – second layer
k) H4 – third layer
l) H5 – first layer
m) H5 – second layer
n) H6 – first layer
o) H6 – second layer
(i) H4 – first layer(k) H4 – third layer
(m) H5 – second layer
(l) H5 – first layer
(n) H6 – first layer (j) H4 – second layer
(o) H6 – first layer
i) H4 – first layer j) H4 – second layer
k) H4 – third layer l) H5 – first layer
m) H5 – second layer n) H6 – first layer
o) H6 – second layer
i) H4 – first layer j) H4 – second layer
k) H4 – third layer l) H5 – first layer
m) H5 – second layer n) H6 – first layer
o) H6 – second layer
i) H4 – first layer j) H4 – second layer
k) H4 – third layer l) H5 – first layer
m) H5 – second layer n) H6 – first layer
o) H6 – second layer
i) H4 – first layer
j) H4 – second layer
k) H4 – third layer
l) H5 – first layer
m) H5 – second layer
n) H6 – first layer
o) H6 – second layer
i) H4 – first layer
j) H4 – second layer
k) H4 – third layer
l) H5 – first layer
m) H5 – second layer
n) H6 – first layer
o) H6 – second layer
i) H4 – first layer j) H4 – second layer
k) H4 – third layer l) H5 – first layer
m) H5 – second layer n) H6 – first layer
[image:7.595.130.291.42.617.2]o) H6 – second layer Figure 6. continued
composition approximately equal to the filler wire composition is reached in the second and further layers. The difference between the second and third layers is not so much expressive and the layers struc-tures are the same. The lower content of carbon and alloying elements in the first layer is caused by
a)
b)
c)
d)
[image:8.595.306.521.56.253.2]e)
f)
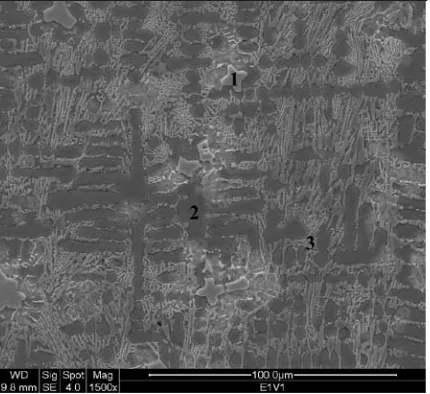
Figure 7. Structures of the some deposit using SEM (c) E4V2, WD–10.3 mm, Sig–SE, Spot –3.5, Mag–5 000 x, 20.0 µm
(a) E4V1, WD–10.0 mm, Sig–SE, Spot –4.5, Mag–1 500 x, 1 000.0 µm
(b) E1V1, WD–9.8 mm, Sig–SE, Spot –4.0, Mag–1 500 x, 100.0 µm
(d) E4V2, WD–10.3 mm, Sig–BSE, Spot –4.5, Mag–1 500 x, 100.0 µm
(f) E1V2, WD–9.8 mm, Sig–SE, Spot –4.0, Mag–6 000 x, 20.0 µm
powder of high carbon ferrochromium mixed with welding flux for SAW surfacing method. The results can be found e.g. in works of Wang (Wang et al. 2007, 2008a,b,c).
Figure 6 shows the deposit structures corre-sponding to the chemical compositions presented in Table 4. The structures of one layer deposits (H1, H2, H4, H6) are created by carbidic eutectic and austenite. The morphology of carbidic eutectic consisting of carbide (Fe, Cr)7C3 and austenite is showed in Figure 7a. The deposits without primary carbides contain this type of carbidic eutectic. The structures of complex alloyed deposit materials (H3, H5) are created by carbidic eutectic on the basis of M7C3, austenite, and primary carbides of MC type (Figure 7b for H5).
The structure of two layers deposit is created by primary carbides, carbidic eutectic (Figure 7c), and austenite. The primary carbides of M7C3 (Figure 7d) are in the weld deposits of H1, H2, H4, and H6. The neighbourhood of these carbides is austenitic. The second layer of the complex alloyed deposit is created by primary carbides MC a M7C3, carbidic
eutectic, and austenite (Figure 7e). The eutectic morphology is shown in Figure 7f.
Hardness
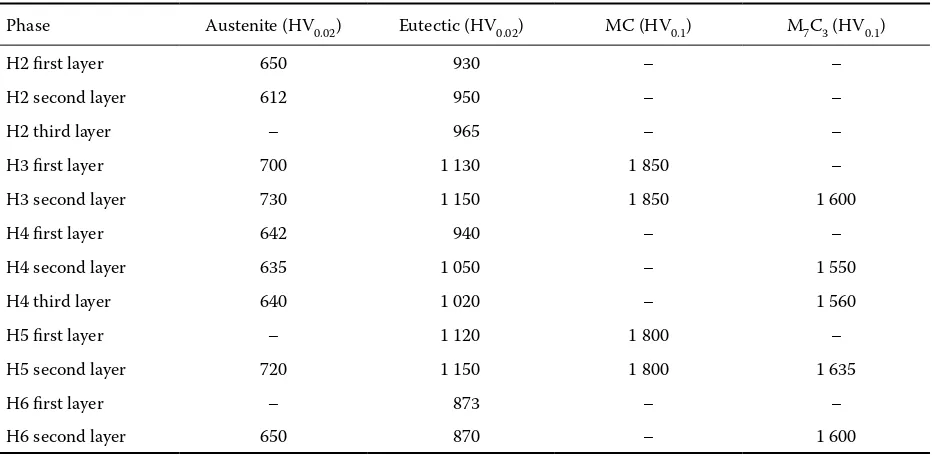
[image:9.595.64.536.73.142.2]The Vickers hardness (HV) values are presented in Table 5 for one-layer, two-layer, and three-layer deposits. The hardness of the deposit corresponds to the structure. The lowest hardness values were determined in one-layer deposit materials alloyed only with chromium. The hardness of these deposits is influenced by the proportion of phases. The de-posit containing the highest amount of austenite is of the lowest hardness. The hardness increases with the carbidic eutectic quantity. The complex alloyed deposits in the second or third layers with primary carbides contents are of the highest hardness values. The hardness values of these deposits increase with the carbidic phase amount and size. Except the de-posit bulk hardness, the hardness of single phases is also determined (if the phase size is sufficient for HV0.01 measuring). Table 6 shows the hardness of single microstructure phases of deposits.
Table 5. Hardness of hardfacing layers (HV30)
Hardfacing 1 Hardfacing 2 Hardfacing 3 Hardfacing 4 Hardfacing 5 Hardfacing 6
First layer 617 492 714 465 612 606
Second layer 680 564 812 560 778 646
Third layer 696 638 – 595 – –
Table 6. Hardness of phases in the hardfacing
Phase Austenite (HV0.02) Eutectic (HV0.02) MC (HV0.1) M7C3 (HV0.1)
H2 first layer 650 930 – –
H2 second layer 612 950 – –
H2 third layer – 965 – –
H3 first layer 700 1 130 1 850 –
H3 second layer 730 1 150 1 850 1 600
H4 first layer 642 940 – –
H4 second layer 635 1 050 – 1 550
H4 third layer 640 1 020 – 1 560
H5 first layer – 1 120 1 800 –
H5 second layer 720 1 150 1 800 1 635
H6 first layer – 873 – –
[image:9.595.66.532.530.758.2]Abrasive wear and roughness
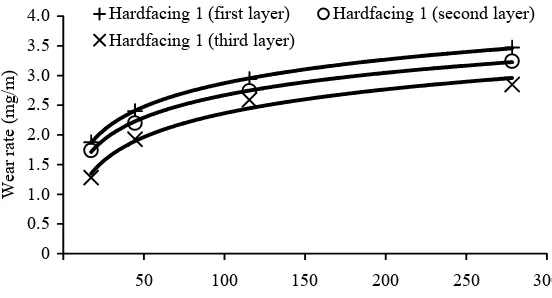
Figures 8–13 show the abrasive wear resistance results of the hardfacings tested. From the results it follows that the structure is of a significant
influ-ence on the wear resistance. With the hardfacing of eutectic or hypoeutectic structures, the dependence between the wear rate and abrasive particles mean diameter is linear. The wear rate of these hardfacings depends significantly on the proportions of carbidic 0.0
0.5 1.0 1.5 2.0 2.5 3.0 3.5 4.0
0 50 100 150 200 250 300
Mean diameter of abrasive particles (mm)
W
ea
r r
at
e
(m
g/
m
)
Hardfacing 1 (first layer) Hardfacing 1 (second layer) Hardfacing 1 (third layer)
0.0 0.5 1.0 1.5 2.0 2.5 3.0 3.5 4.0
0 50 100 150 200 250 300
Mean diameter of abrasive particles (mm)
W
ea
r r
at
e
(m
g/
m
)
Hardfacing 2 (first layer) Hardfacing 2 (second layer) Hardfacing 2 (third layer)
0.0 0.2 0.4 0.6 0.8 1.0 1.2 1.4 1.6 1.8 2.0
0 50 100 150 200 250 300
Mean diameter of abrasive particles (mm)
W
ea
r r
at
e
(m
g/
m
)
Hardfacing 3 (first layer) Hardfacing 3 (second layer)
Figure 10. Hardfacing 3 – rela-tion between wear rate and abrasive particles size
[image:10.595.66.342.56.205.2]Figure 8. Hardfacing 1 – relation be-tween wear rate and abrasive particles size
Figure 9. Hardfacing 2 – rela-tion between wear rate and abrasive particles size
(µm)
(µm)
[image:10.595.68.541.359.757.2]RES. AGR. ENG., 55, 2009 (3): 101–113 111 eutectic and austenite. The higher the carbidic
eu-tectic content in the hardfacing structure, the lower the wear rate.
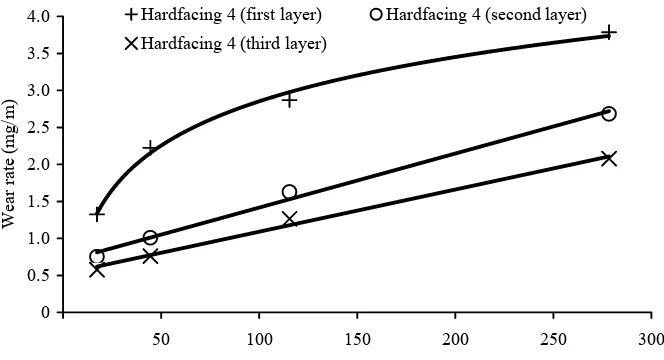
With the occurrence of primary carbides in the structure, the wear rate increases linearly with the
abrasive particle size. The wear rate decreases with the carbidic phase amount. In the first layer, the hardfacing 3 contains a higher quantity of primary carbides MC than the hardfacing 5 and the carbidic eutectic and austenite matrix shows a higher repre-0.0 0.5 1.0 1.5 2.0 2.5 3.0 3.5 4.0
0 50 100 150 200 250 300
Mean diameter of abrasive particles (mm)
W ea r r at e (m g/ m )
Hardfacing 4 (first layer) Hardfacing 4 (second layer) Hardfacing 4 (third layer)
0.0 0.2 0.4 0.6 0.8 1.0 1.2 1.4 1.6 1.8 2.0
0 50 100 150 200 250 300
Mean diameter of abrasive particles (mm)
W ea r r at e (m g/ m )
[image:11.595.66.398.56.236.2]Hardfacing 5 (first layer) Hardfacing 5 (second layer)
[image:11.595.66.532.358.760.2]Figure 11. Hardfacing 4 – rela-tion between wear rate and abrasive particles size
Figure 12. Hardfacing 5 – rela-tion between wear rate and abrasive particles size
0.0 0.5 1.0 1.5 2.0 2.5 3.0
0 50 100 150 200 250 300
Mean diameter of abrasive particles (mm)
W ea r r at e (m g/ m )
Hardfacing 6 (first layer) Hardfacing 6 (second layer)
Figure 13. Hardfacing 6 – rela-tion between wear rate and abrasive particles size
(µm) (µm) (µm) 0.0 0.5 1.0 1.5 2.0 2.5 3.0
0 50 100 150 200 250 300
W ea r r at e (m g/ m )
sentation of austenite. The works of Suchánek pres-ent that this austenite, if deformed, transforms into martensite. In the second layer of hardfacings 3 and 5, the carbides MC and M7C3 occur. The quantities of M7C3 and its sizes is almost identical and therefore the wear rate is of the same value. A slightly lower wear rate is found in the hardfacing 3, evidently because of the higher content of MC phase.
E.g. in the first layer of hardfacings 4 and 6 no primary carbides occur and the structure consists of carbidic eutectic and austenite. In the third layer of hardfacing 4 and in the second layer of hardfac-ing 6 primary carbides M7C3 already occur and the wear rate decreases significantly. The character of the wear rate dependence on the abrasive particles size changes to linear.
CoNCluSioN
The knowledge obtained can be summarised in the ollowing points:
The hardness of hypoeutectic hardfacings in-creases with the carbidic eutectic part and type. The hardness of hypereutectic hardfacing increases with the increasing proportions of carbidic phases MC and M7C3.
The abrasive wear rate of hypoeutectic hardfacing depends on the structural components portions. A higher part of alloyed eutectic reduces the wear rate.
The dependence of hypoeutectic deposit abrasive wear rate on the abrasive particles size is not linear. This fact can be caused by the abrasive particle criti-cal size, which erodes the carbidic eutectic softer phase and in this way uncovers the carbidic phase which can crumble away. This dependence of the abrasive wear rate increase on the increase of the abrasive particle size is almost constant.
The abrasive wear rate of hypereutectic hardfacing decreases with the increasing proportions of carbidic phases MC and M7C3. In this decrease, the MC phase participates more because it is harder. This is shown in comparing the hardfacings 3, 4, 5, and 6.
The dependence between the hypereutectic hardfac-ings wear rate and the abrasive particle size is linear.
References
Asensio J., Pero-Sanz J.A., Verdeja J. I. (2003): Micro-structure selection criteria for cast irons with more than 10 wt.% chromium for wear applications. Materials Cha-racterization, 49: 83–93.
Atamert S., Bhadeshia H.K.D.H. (1990): Microstructure and stability of Fe-Cr-C hardfacing alloys. Materials Sci-ence and Engineering A, 130: 101–111.
Buchely M.F., Gutierrez J.C., León L.M., Toro A. (2005): The effect of microstructure on abrasive wear of hardfacing alloys. Wear, 259: 52–61.
Chotěborský R., Hrabě P., Müller M., Savková J., Jirka M. (2008): Abrasive wear of high chromium Fe-Cr-C hardfacing alloys. Research Agriculture Engineering, 54: 192–198.
Colaco R., Vilar R.A. (2003a): Model for the abrasive wear of metallic matrix particle-reinforced materials. Wear,
254: 625–634.
Colaco R., Vilar R.A. (2003b): Abrasive wear of metallix matrix reinforced materials. Wear, 255: 643–650. Correa E.O., Alcantara N.G., Tecco D.G.,.kumar R.V
(2007a): Development of an iron-based hardfacing material reinforced with Fe-(TiW)C composite powder. Metallurgi-cal and Materials Transactions A, 38: 937–945.
Correa E.O., Alcântara, N.G., Tecco, D.G., Kumar, R.V. (2007b): The relationship between the microstructure and abrasive resistance of a hardfacing alloy in the Fe-Cr-C-Nb-V system. Metallurgical and Materials Transaction A,
38: 1671–1680.
Gülenc B., Kahraman N. (2003): Wear behaviour of bulldozer rollers welded using a submerged arc welding process. Materials and Design, 24: 537–542.
Jankauskas V., Kreivaitis R., Milčius D., Baltušnikas A. (2008): Analysis of abrasive wear performance of arc welded hard layers. Wear, doi:10.1016/j.wear.2008.03.022. Ping Lu Shan, Oh-Yang Kwon, Tae-Bum Kim, Kwon-Hu
Kim (2004): Microstructure and wear property of Fe-Mn-Cr-Mo-V alloy cladding by submerged arc welding. Journal of Material Processing Technology, 147: 191–196. Sevim I., Eryurek B.I. (2006): Effect of abrasive particle
size on wear resistance in steels. Materials and Design,
27: 173–181.
Suchánek J., Kuklík V., Zdravecká E. (2007): Abrasive wear of materials. CTU Prague, Praha, 162. (in Czech) Wang X.H., Song S.L., Zou Z.D., Qu S.Y. (2006):
Fabricat-ing TiC particles reinforced Fe-based composite coatFabricat-ings produced by GTAW multi-layers melting process. Materi-als Science and Engineering A, 441: 60–67.
Wang X.H., Song S.L., Qu S.Y., Zou Z.D. (2007): Charac-terization of in situ synthesized TiC particle reinforced Fe-based composite coatings produced by multi-pass overlapping GTAW melting process. Surface and Coatings Technology, 201: 5899–5905.
Wang X.H., Han F., Qu S.Y., Zou Z.D. (2008a): Micro-structure of the Fe-based hardfacing layers reinforced by TiC-VC-Mo2C particles. Surface and Coatings Technology,
202: 1502–1509.
Wang X.H., Han F., Liu X.M., Qu S.Y., Zou Z.D. (2008b): Microstructure and wear properties of the Fe-Ti-V-Mo-C hardfacing alloy. Wear, 256: 583–589.
resistance of Fe-based hardfacing coatings. Materials Sci-ence and Engineering A, 489: 193–200.
Yilmaz S.O. (2006): Wear behavior of gas tungsten arc de-posited FeCr, FeCrC, and WC coatings on AISI 1018 steel. Surface and Coatings Technology, 201: 1568–1575.
Zum Gahr K.H. (1998): Wear by hard particles. Tribology International, 31: 587–596.
Received for publication October 10, 2008 Accepted after corrections May 6, 2009
Corresponding author:
Ing. Rostislav Chotěborský, Ph.D., Česká zemědělská univerzita v Praze, Technická fakulta, katedra materiálu a strojírenské technologie, Kamýcká 129, 165 21 Praha 6-Suchdol, Česká Republika tel.: + 420 224 383 274, fax: + 420 234 381 828, e-mail: choteborsky@tf.czu.cz
Abstrakt
Chotěborský R., Hrabě P., Müller M., Savková J., Jirka M., Navrátilová M. (2008): Vliv velikosti abra-zivní částice na abraabra-zivní opotřebení návarových materiálů. Res. Agr. Eng., 55: 101–113.
Návarové vrstvy jsou jednou z cest ke zvýšení odolnosti proti opotřebení a zároveň jsou i ekonomickou cestou. Studie porovnává mikrostrukturní charakteristiky návarových materiálů a odolnost vůči abrazivnímu opotřebení. Studium bylo prováděno na návarových materiálech, kde ve struktuře byly chromové karbidy a karbidy komplexní. Návarový materiál byl nanesen na nízkouhlíkovou ocel S235JR metodou odtavující se elektrody v ochranné atmosféře. Různé komerční návarové materiály byly studovány z hlediska efektu velikosti abrazivní částice na abrazivní opotřebení. Test abrazivního opotřebení byl prováděn na brusném plátně o zrnitosti 80, 120, 240 a 400 podle ČSN 01 5084. Cha-rakteristika mikrostruktury a analýza povrchu byla prováděna postupy optické a elektronové mikroskopie. Výsledky ukazují rozdílný vliv velikosti abrazivní částice na rychlost opotřebení pro různé struktury systému Fe-Cr-C. Struktu-ry bez primárních karbidů mají vysokou Struktu-rychlost abrazivního opotřebení; tato Struktu-rychlost roste nelineárně se zvětšující se velikostí abrazivní částice. Naopak struktury s primárními karbidy mají nízkou rychlost abrazívního opotřebení a tato rychlost roste lineárně se zvětšující se abrazivní částicí.