JOURNAL OF FOREST SCIENCE, 52, 2006 (4): 172–180
Yield tables have been an object of the interest of forest science and practice for several centuries. At present they have a broad application as well. As stated by Eckmüllner (1992), we must take them into consideration despite all their shortcom-ings and positive and negative sides. Our domestic yield tables are not an exception. Their history dates back to 1965 when in Czechoslovakia a long-term research programme was launched for the construc-tion of domestic yield tables for main tree species. Its aim was to construct national uniform yield tables for spruce, fir, pine, oak and beech from domestic experimental material with the use of available sci-entific knowledge and simultaneously to meet the basic requirements of forest management practice. The programme was carried out step by step. In
1975 the 1st edition of yield tables was published
fol-lowed by the 2nd edition in 1980, and the third one
in 1990. In 1992 yield tables started to be applied in practice but only in the territory of Slovakia. Until 2002, it means for the period of 10 years, the state of all forests in Slovakia was evaluated on the basis of these tables. The most important application of yield tables was in the management of forests, especially
in monitoring and evaluating the forest condition in a ten-year cycle of renewals of forest management plans. Based on production models of yield tables, maturity of tree species Halaj et al. (1990) and their decennial thinning percents Halaj et al. (1986) were objectified. According to the above-mentioned sur-vey we can state that the application of yield tables in Slovakia is very broad with significant economic consequences.
For the construction of yield tables an empirical material from a high number of research plots loca-ted in the whole of Czechoslovakia was used but the number of repeated measurements on these plots was small. In total it was about 8,000 measurements on 4,000 plots, which was on average only 2 measure-ments per plot. Only 13% of all research plots were permanent research plots and the remaining plots were temporary research plots established for the construction of yield tables. The number of research plots varied as concerns tree species, but spruce had the highest proportion both in the Czech Republic and in the Slovak Republic. The number of repeated measurements on plots was relatively low, mostly 3 and very scarcely 4 repeated measurements. There
Development of the primary values of yield tables
of spruce in comparison with their development
on permanent research plots
R. Petráš
1, L. Brezina
2, J. Mecko
11
National Forest Centre – Forest Research Institute, Zvolen, Slovak Republic
2Faculty of Forestry, Technical University, Zvolen, Slovak Republic
ABSTRACT: Development of yield curves of mean and top height and development of mean diameter of the yield tables of spruce is compared with their development on 28 permanent research plots with 156 repeated measurements. The time gap of repeated measurements on research plots is in the range of 10–38 years. The agreement and differences in the development of model and empirical curves were examined by means of mathematical and statistical charac-teristics. The development of mean and top heights in the yield tables of spruce is consistent with their development on permanent research plots. Mean diameters of yield tables are systematically smaller by about 4%. Methodology of processing the concrete results is also presented.
was only a short time period of 15 or maximally 20 years with 5-year interval of repeated measure-ments. This fact influenced the methodology of the construction of yield tables significantly. According to this methodology only three mean parameters, i.e. mean height, top height and mean diameter of coppice-with-standards, were derived directly from the empirical material. Mean height of the stand in dependence on its age is the most important pa-rameter as it represents height yield curves of yield tables. It would be optimal in the construction of yield tables if lifetime measurements on permanent research plots were available. Repeated measure-ments carried out in short time periods forced the authors of yield tables to modify the methodology, mainly the derivation of height yield curves. In place of unfeasible methodology of fitting lifetime height curves or unsuitable methodology of fitting aver-age curves from the set of single measurements as justified by Cantiani and Baroni (1975) the
meth-odology of fitting envelopecurves from these sets
was accepted. A more detailed description and a procedure of deriving height yield curves accord-ing to this methodology were presented by Halaj et al. (1987). In connection with the model of yield curves based on mean heights a model was derived for the determination of yield classes of stands from top heights by means of differences between mean and top height. The model of the trend of mean di-ameters was derived in dependence on the age and yield class of stand that was determined from height curves for each measurement. Halaj et al. (1981) presented a similar construction of the whole model of yield tables.
Yield tables were already verified during their construction and application in practice and their accuracy was evaluated, especially as concerns the determination of stand parameters. Convincing results in the evaluation of the accuracy of determin-ing the standdetermin-ing volume of stands were published by Šmelko (1988). In the Czech Republic Sequens (1994) and Křepela et al. (2000) dealt with the issues of height growth on the basis of age height curves from yield tables. Despite the fact that the construc-tion and verificaconstruc-tion of yield tables did not continue
after their 3rd edition in 1990 permanent research
plots were repeatedly measured as these plots were established by Forest Research Institute in Zvolen for the construction of yield tables.
The aim of this paper is to evaluate the develop-ment of primary growth parameters for spruce, such as curves of mean and top height and curves of mean diameter, on an example of Czechoslovak yield tables. Model curves are compared with empirical
data of repeated measurements of the stands on permanent research plots.
MATeRiAL AnD MeThoDS
The experimental material consists of tree data from 156 repeated measurements on 21 production permanent research plots that were established for the construction of yield tables and on 7 permanent research plots established at about the same time for the research on thinnings (Saniga 1985; Moravčík et al. 1999). Low thinnings in 3–5 year intervals after repeated measurements were also carried out on all research plots. Mean diameters and heights of stands were calculated from repeated measurements of diameters and heights of stands, particularly for
coppice-with standards mean diameter dv, mean
height hv and top height hv10%. All variables were
calculated from the volume of mean stem in volume unit stem with bark. According to mean height and
age absolute height yield class q at the standard age of
100 years was determined with every repeated mea-surement, interpolated with the accuracy of 2 deci-mal points. Empirical development of mean height, top height and mean diameter on research plots was compared with model development according to yield tables. The differences in the development of empirical and model values were evaluated graphi-cally as well as statistigraphi-cally. For each research plot average yield class was calculated as the arithmetic average of yield classes from its repeated measure-ments. Standard deviation was also calculated for the average yield class. According to the average yield class on the plot and age of stand with concrete repeated measurement model values were calculated for all three studied parameters from mathematical models of yield tables. The parameters are namely mean height, top height and mean diameter. The dif-ferences between their actual (empirical) and model values can be expressed as relative errors of yield
tables e according to the formula:
xa – xYT
e = × 100 (1)
xYT
where: xa – the actual value of the studied parameter,
xYT – the model value of the studied parameter
ac-cording to YT.
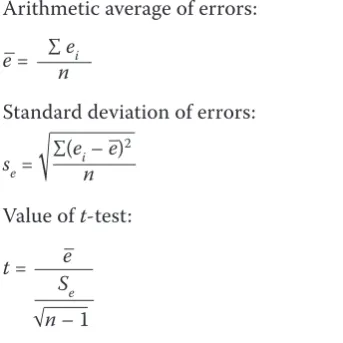
To evaluate relative errors of yield tables in more detail the following statistical characteristics were calculated:
Mean square error:
∑ e2
i
me =
√
(2)Arithmetic average of errors:
∑ ei
e = (3)
n
Standard deviation of errors: ∑(e
i – e)2
se =
√
(4)n
Value of t-test:
e
t = (5)
Se
√n – 1
where: n – the number of measurements.
Statistical characteristics according to formulas (2)–(5) were calculated for each studied stand pa-rameter on research plot as well as altogether for all research plots.
The experimental material from repeated meas-urements of research plots was arranged into age development series of mean heights, top heights and mean diameters. The length of these series was 10 to 38 years of their continual observations. The lowest age of stand was 28 and the highest 153 years. Re-search plots had the average yield class in the range 25–41. At the end we must say that the presented empirical material included all measurements, also those used for the construction of yield tables in 1980. Of the total number 156 repeated measure-ments 44% were new measuremeasure-ments, it means they were not used for the construction of yield tables.
ReSuLTS AnD DiSCuSSion
The development of the three primary growth pa-rameters, namely mean height, top height and mean diameter, was evaluated by a simple graphical compa-rison of the development of the studied parameter on research plot with model parameter according to yield tables and by means of numerical evaluation of relative errors calculated according to formulas (1)–(5).
Mean height development
The development of mean heights according to research plots and models of yield tables is illus-trated in Fig. 1. Thick line illustrates height yield curves of yield tables for yield classes 12, 26 and 40, and thin lines height curves of research plots. We can see in Fig. 1 that almost all measurements of research plots are distributed only in the up-per half of the yield range and at the age of about 30–120 years. Most of the research plots have very
similar trends of the development of mean heights like model ones.
The principle of yield classification of repeated measurements on research plots was used for a more detailed quantification of differences in the develop-ment of mean heights. If it holds good that the actual height growth of the stand on a research plot is the same as the development of the respective yield curve, then the same yield class is determined by its repeated measurements. In the case of different height growth the yield class of the stand will increase or decrease with repeated measurements. After determining the exact yield class for each repeated measurement an average
change in yield class ∆q was calculated from the pairs of
successive measurements, separately for each research plot and together for all research plots of spruce. To exclude the effect of different intervals of repeated measurements, the difference in yield classes of two successive measurements was calculated per constant 5-year interval. According to Table 1 average changes in yield classes on research plots were in the range of –0.38 to +1.10 m. The average change for all research plots had the value +0.22 m. Thus the yield class of repeated measurements on all research plots increased on average by 0.22 m in 5-year intervals. When
calcu-0 5 10 15 20 25 30 35 40 45 50
0 20 40 60 80 100 120 140 160
Age (years)
M
ea
n
he
ig
ht
(m
)
[image:3.595.71.243.57.229.2]production research plots thinning research plots
Fig. 1. Development of mean heights according to repeated measurements on research plots and yield tables of the abso-lute height yield classes 12, 26 and 40
Ta
ble 1. S
ta tistic al c harac ter istic
s of er
rors of r
ep ea te d me asur emen
ts on r
es ear ch plot s f or y ie ld c la ss ( q ), me an di ame ter ( dv
) and t
op heig
ht (
hv10%
) S.n. 1 N ame of r es ear ch plot N umb er of r ep ea te d me asur emen ts Yie ld c la ss M ean di ame ter ( dv ) Top heig ht (
hv10%
lated for a longer time period, we can expect that for example after 25 years the yield class would increase on a research plot by 1.10 m. An increase in the yield class by one yield class, it means by 2.00 m, would occur only after nine 5-year intervals, i.e. after 45 years.
In connection with the change in yield classes it is also important to know the variability of repeated measurements. Therefore not only the average yield class but also its standard deviation was calculated from repeated measurements for each research plot. According to the data in Table 1 we can state that the values of standard deviation in the range of ± 0.20 to ± 1.67 m indicate relatively different variability of yield classes on respective research plots. We must stress that for more than 80% of cases the deviations are smaller than ± 1.00 m.
At the end of this chapter we can conclude that the development of mean heights of spruce stands in yield tables is very similar to the development on research plots. We can consider the average 5-year change in yield class +0.22 m negligible. The variability of yield classes for repeated measurements on research plots is also very low, around the average yield class, when the standard deviation is mostly smaller than ± 1.00 m.
Top height development
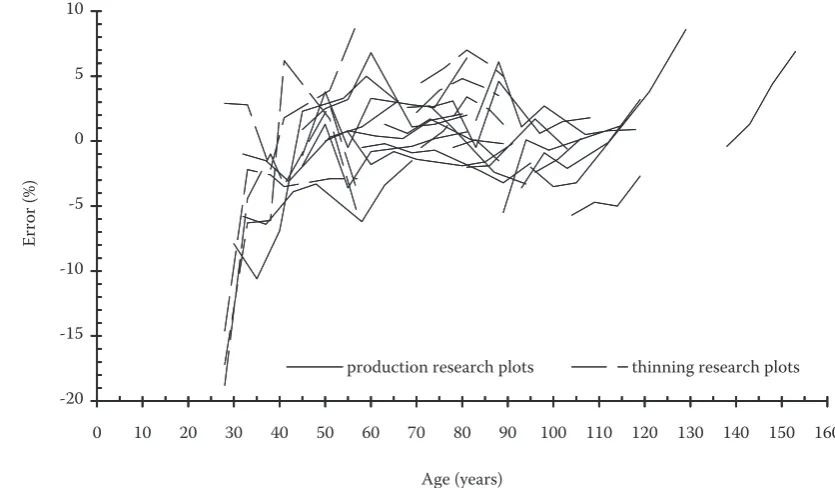
The development of top height was evaluated by means of relative errors of yield tables according to formula (1), where model heights for the average yield class are calculated on a research plot from its repeated measurements. Their values are represented for all research plots and all repeated measurements
in dependence on the age of the stand in Fig. 2. It is obvious that at the age above 40 years most devia-tions are small, in the range of about ± 5%. Even the distribution of deviations around zero is important. From these deviations also statistical characteristics were calculated according to formulas (2)–(5), namely arithmetic mean, standard deviation, mean square
er-ror and t-value as they are given in Table 1. Their
nu-merical values confirm the statement from Fig. 2. The
t-values calculated for 10 research plots document that
their average deviations are significantly different from zero at a 95% probability level. The average deviation – 0.15% for all research plots is very small and it is not significantly different from zero. The mean square er-ror of all research plots is ± 4.11%. It is relatively higher as top heights in yield tables were derived from mean heights and differences between the mean and top height. This error thus includes not only the error of mean height but also the error of a difference between the upper and mean height.
Thus similarly like in mean height we can state that the yield tables do not have a systematic error in the development of top height despite the fact that the systematic error was confirmed for some research plots by means of statistical test.
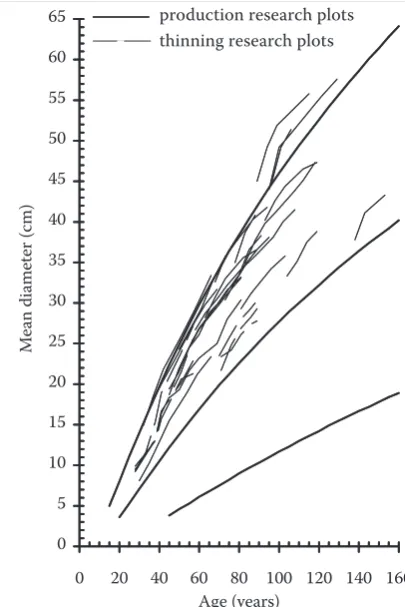
Mean diameter development
Graphical comparison of the development of mean diameters in dependence on the age of the stand is presented in Fig. 3. Based on it we can state that development trends of actual diameters from research plots and model plots according to yield tables are very -20
-15 -10 -5 0 5 10
0 10 20 30 40 50 60 70 80 90 100 110 120 130 140 150 160
Age (years)
Erro
r (%)
[image:5.595.69.487.60.304.2]production research plots thinning research plots
similar with some few exceptions. The errors of yield tables in the determination of mean diameter calcu-lated according to formula (1) are in the range of –10 to +20% and indicate their higher as well as asymmetric distribution around zero. Their statistical characteris-tics according to individual research plots are given in Table 1, documenting that their mean deviations are significantly different from zero in almost 17 cases at a 95% probability level. The average deviation +4.09% for all research plots is statistically significantly different from zero. The mean square error of all research plots is ± 8.44%. It is higher than in top height as it includes mainly a higher systematic error.
This finding is important and it confirms acknowl-edged expectations that the yield tables of spruce give slightly lower mean diameters for Slovakian conditions than are the actual ones. The differences are explained by the composition of empirical ma-terial, which was used for the construction of yield tables. The empirical material was mostly from the Czech Republic.
ConCLuSion
In addition to correct methodology of their con-struction the empirical material that was used for the
construction of the tables is crucial for the high value and reliability of all yield tables. Lower reliability or lack of trust in yield tables that were constructed from a single measurement or repeated measure-ments of research plots in shorter time periods could be eliminated by verification of further repeated measurements on the same research plots. A good example can be Assmann (1959), who compared the development of top heights of yield tables by Wie-demann and Zimmerle with their development on permanent research plots in Bavaria. The methodo-logy we used for the verification of the development of three basic growth parameters, namely mean height, top height and mean diameter, is based on the quantification of their differences between the values from repeated measurements on permanent research plots and according to the models of yield tables. It is based on the conviction of Assmann (1961) that correctly expressing the growth and production of stands in yield tables depends mainly on the fact how their height development corresponds to the growth of the mean or top height of actual stands. Assmann also reported that the development of mean heights was also affected by thinnings significantly.
The results of our research are as follows:
– The development of mean heights of spruce stands on permanent research plots is very similar to that in the model from yield tables. An average increase in the yield class of the stand for 5 years by 0.22 m is minimal. An increase in the yield class by one yield class, i.e. by 2.00 m, can be expected only after nine 5-year intervals, it means after 45 years. – The mean square error of the development of top
heights is ± 4.11%. The average error –0.15% is not statistically significant.
– The development of mean diameters of spruce stands is different from the model development of yield tables. The mean square error is ± 8.44%. The average error +4.09% is statistically significantly different from zero and it indicates that mean diameters are greater on research plots than in yield tables. These differences can be explained by the empirical material used for the construction of yield tables which is prevalent in the Czech Republic, where spruce stands of the same yield class have slightly smaller diameters than in Slo-vak Republic.
References
ASSMANN E., 1959. Höhenbonität und wirkliche Er-tragsleistung. Forstwissenschaftliches Centralblatt, 78: 1–20.
0 5 10 15 20 25 30 35 40 45 50 55 60 65
0 20 40 60 80 100 120 140 160 Age (years)
M
ea
n
di
am
et
er
(c
m
)
[image:6.595.65.268.56.360.2]production research plots thinning research plots
Fig. 3. Development of mean diameters according to repeated measurements on research plots and yield tables of the abso-lute height yield classes 12, 26 and 40
ASSMANN E., 1961. Waldertragskunde. Organische Produk-tion, Struktur, Zuwachs und Ertrag von Waldbeständen. München, Bon, Wien, BLV: 490.
CANTIANI M., BARONI A., 1975. Il pino marittimo in Toscana. Ricerche sperimentali di dendrometria e di
auxo-metria. FascicoloVI, Universita di Firenze: 42.
ECKMÜLLNER O., 1992. Problematik der Anwendung
von Ertragstafeln. österrreichische Forstzeitung, 103:
54–55.
HALAJ J., PáNEK F., PETRአR., 1981. Matematický model druhého vydania rastových tabuliek pre smrek, jedľu, dub a buk. Lesnictví, 27: 867–878.
HALAJ J., PETRአR., SEqUENS J., 1986. Percentá prebierok pre hlavné dreviny. Lesnícke štúdie, 40: 98.
HALAJ J., PáNEK F., PETRአR., 1987. Výškový rast smreka na podklade nových rastových tabuliek (1980). Lesnictví, 33: 905–918.
HALAJ J., BORTEL J., GRéK J., MECKO J., MIDRIAK R., PETRአR., SOBOCKý E., TUTKA J., VALTýNI J., 1990. Rubná zrelosť drevín. Lesnícke štúdie, 48: 117.
KřEPELA M., SEqUENS J., ZAHRADNíK D., 2000. Height growth trends in spruce and pine as the function of age and calendar year of forest management plan in the University Forest Enterprise Kostelec nad Černými lesy. Scientia Ag-riculturae Bohemica, 31: 131–138.
MORAVČíK M., ČARNOGURSKý J., PAJTíK J., 1999. Vplyv clonných rubov odstupňovaných podľa sily ťažbového zásahu na prírastok zostávajúcich stromov. Lesnícky časopis – Forestry Journal, 45: 359–369.
SANIGA M., 1985. Vplyv druhu a stupňa prebierky na sta-bilitu smrekových porastov proti vetru. Lesnícky časopis, 31: 35–48.
SEqUENS J., 1994. Bonitní vějíř a trendy výškového růstu borovice. Lesnictví-Forestry, 40: 550–556.
ŠMELKO Š., 1988. Presnosť nových rastových tabuliek ČSSR pri zisťovaní zásob porastov. Acta Facultatis Forestalis, Zvolen, XXX: 143–158.
Received for publication November 8, 2005 Accepted after corrections November 30, 2005
Vývoj primárnych veličín rastových tabuliek smreka v porovnaní
s ich vývojom na trvalých výskumných plochách
R. Petráš1, L. Brezina2, J. Mecko1
1Národné lesnícke centrum – Lesnícky výskumný ústav, Zvolen, Slovenská republika
2Lesnícka fakulta, Technická univerzita vo Zvolene, Zvolen, Slovenská republika
ABSTRAKT: Porovnal sa vývoj bonitných kriviek strednej a hornej výšky a vývoj strednej hrúbky rastových tabu-liek smreka s ich vývojom na 28 trvalých výskumných plochách so 156 opakovanými meraniami. Dĺžka intervalu opakovaných meraní na výskumných plochách je v rozsahu 10 až 38 rokov. Zhoda a rozdiely vo vývoji modelových a empirických kriviek sa preskúmali prostredníctvom matematicko-štatistických charakteristík. Rastové tabuľky smreka majú vývoj stredných a horných výšok zhodný s ich vývojom na trvalých výskumných plochách. Stredné hrúbky rastových tabuliek sú systematicky približne o 4 % menšie. Okrem konkrétnych výsledkov sa prezentuje aj metodika ich spracovania.
Kľúčové slová: smrek; rastové tabuľky; bonitné krivky; stredná výška; horná výška; stredná hrúbka
Rastové tabuľky sú v lesníckej vede a praxi predme-tom dlhodobého záujmu už niekoľko storočí a ma- jú i v súčasnosti veľmi široké uplatnenie. Ako uvádza aj Eckmüllner (1992), je potrebné s nimi i napriek všetkým obmedzeniam a kladným alebo aj zápor-ným stránkam aj naďalej uvažovať. Výnimkou nie sú ani naše domáce rastové tabuľky. Ich história sa
území Slovenska. Do roku 2002 (teda za 10 rokov) sa podľa ich podkladov zhodnotil stav všetkých lesov Slovenska.
Pre konštrukciu rastových tabuliek sa použil em-pirický materiál síce s veľkým počtom výskumných plôch, rozmiestnených po celom bývalom Českoslo-vensku, avšak s malým počtom opakovaných mera-ní na týchto plochách. Počet výskumných plôch bol podľa drevín rozdielny, ale najvyššie zastúpenie mal smrek, a to rovnako v Českej i Slovenskej republi-ke. Počet opakovaných meraní bol na plochách re-latívne malý, najviac tri a len veľmi zriedkavo štyri opakované merania, čo je pri päťročnom intervale opakovaných meraní len krátky časový úsek 15 ale-bo maximálne 20 rokov. Táto skutočnosť výrazne ovplyvňovala metodiku konštrukcie rastových ta-buliek. Opakované merania realizované v krátkych časových úsekoch prinútili konštruktérov rastových tabuliek modifikovať metodiku – hlavne odvodenie výškových bonitných kriviek. Namiesto nemožnej metodiky vyrovnávania celoživotných výškových kriviek alebo nevhodnej metodiky vyrovnávania priemerných kriviek zo súboru jednorázových me-raní, ako to zdôvodňujú Cantiani a Baroni (1975), sa prijala metodika vyrovnávania obalových kriviek z týchto súborov. Podrobnejší popis a postup od-vodenia výškových bonitných kriviek podľa tejto metodiky uvádzajú Halaj et al. (1987) a podrob-nú konštrukciu celého modelu rastových tabuliek uvádzajú Halaj et al. (1981). I keď sa po treťom vy-daní rastových tabuliek v roku 1990 v ich konštruk-cii a overovaní nepokračovalo, opakovane sa merali trvalé výskumné plochy, ktoré pre ich konštrukciu zakladal Lesnícky výskumný ústav vo Zvolene.
Cieľom práce je na príklade československých rastových tabuliek pre smrek zhodnotiť vývoj ich primárnych rastových veličín, ktorými sú krivky strednej a hornej výšky a krivky strednej hrúbky. Modelové krivky sa porovnajú s empirickými údaj- mi opakovaných meraní porastov na trvalých vý-skumných plochách zo Slovenska. Experimentálny materiál tvoria stromové údaje zo 156 opakovaných meraní na 21 produkčných trvalých výskumných plochách, ktoré sa zakladali pre konštrukciu rasto-vých tabuliek, ale aj na siedmich trvalých výskum-ných plochách, ktoré sa zakladali približne v tom istom období pre výskum prebierok. Údaje z opako-vaných meraní výskumných plôch sa usporiadali do vekových vývojových radov stredných výšok, hor-ných výšok a stredhor-ných hrúbok. Dĺžka týchto radov bola v rozsahu 10–38 rokov ich kontinuálneho sle-dovania. Najnižší vek porastu je 28 a najvyšší 153 ro- kov. Výskumné plochy majú priemerné bonity v roz- sahu 25–41. Vývoj všetkých troch primárnych
ras-tových veličín, a to strednej výšky, hornej výšky a strednej hrúbky, sa zhodnotil jednoduchým gra-fickým porovnaním vývoja sledovanej veličiny na výskumnej ploche s modelovou veličinou podľa ras-tových tabuliek a číselne zhodnotením relatívnych chýb vypočítaných podľa vzorcov (1)–(5).
Vývoj stredných výšok podľa výskumných plôch a modelov rastových tabuliek je znázornený na obr. 1. Hrubou čiarou sú zakreslené výškové bonitné krivky rastových tabuliek pre bonitné stupne 12, 26 a 40 a tenkými čiarami výškové krivky výskumných plôch. Z obr. 1 je vidieť, že takmer všetky merania vý-skumných plôch majú zastúpenie len v hornej polovi-ci bonitného rozpätia a vo veku približne 30–120 ro- kov. Väčšina výskumných plôch má veľmi podobné trendy vývoja stredných výšok s modelovými. Na presnejšiu kvantifikáciu rozdielov vo vývoji stred-ných výšok sa využil princíp bonitácie opakovastred-ných meraní na výskumných plochách. Ak totiž platí, že skutočný výškový rast porastu na výskumnej ploche sa zhoduje s vývojom príslušnej bonitnej krivky, po-tom sa pri jej opakovaných meraniach určí rovnaká bonita. V prípade rozdielneho výškového rastu sa bude bonita porastu pri opakovaných meraniach zvyšovať alebo znižovať. Po určení presnej bonity pre každé opakované meranie sa z dvojíc po sebe idúcich susedných meraní vypočítala priemerná
zmena bonity Δq samostatne na každej výskumnej
ploche a spolu za všetky výskumné plochy smreka. Aby sa vylúčil vplyv rozdielneho intervalu opakova-ných meraní, rozdiel bonít dvoch susedopakova-ných meraní sa prepočítal na konštantný päťročný interval. Podľa tab. 1 sú priemerné zmeny bonít na výskumných plochách v rozsahu –0,38 až +1,10 m. Priemerná zmena zo všetkých výskumných plôch má hodnotu +0,22 m. Teda bonita opakovaných meraní na všet-kých výskumných plochách stúpa v päťročných in-tervaloch priemerne o 0,22 m. V prepočte na dlhšie časové obdobie môžeme očakávať, že napr. po 25 ro- koch by sa bonita na výskumnej ploche zvýšila o 1,10 m. Zvýšenie bonity o jeden celý bonitný stu-peň, teda 2,00 m, by nastalo až po deviatich päťroč-ných intervaloch, teda po 45 rokoch.
a t-hodnota; sú uvedené v tab. 1. Ich číselné hod-noty len potvrdzujú konštatovanie z obr. 2.
Vypo-čítané t-hodnoty dokumentujú pri 10 výskumných
plochách, že ich priemerné odchýlky sú s 95% prav-depodobnosťou významne rozdielne od nuly. Prie-merná odchýlka – 0,15 % za všetky výskumné plo-chy – je veľmi malá a nie je významne rozdielna od nuly.
Grafické porovnanie vývoja stredných hrúbok v zá- vislosti od veku porastu je na obr. 3, podľa ktorého môžeme konštatovať, že vývojové trendy skutočných hrúbok z výskumných plôch a modelových plôch podľa rastových tabuliek sú až na niektoré výnim-ky veľmi podobné. Chyby rastových tabuliek v ur-čovaní strednej hrúbky vypočítané podľa vzorca (1) sú v rozsahu približne –10 až +20 % a poukazujú na ich vyššie, ale aj asymetrické rozloženie okolo nuly. Ich štatistické charakteristiky podľa jednotli-vých výskumných plôch sú uvedené v tab. 1 a doku-mentujú, že ich priemerné odchýlky sú až v 17 prí- padoch s 95% pravdepodobnosťou význame rozdiel- ne od nuly. Priemerná odchýlka +4,09 % za všetky výskumné plochy je rovnako štatisticky význam-ne rozdielna od nuly. Tento poznatok je významný a len potvrdzuje doteraz uznávané očakávania, že rastové tabuľky smreka udávajú pre slovenské po-mery o niečo nižšie stredné hrúbky, ako sú v sku-točnosti. Rozdiely sa zdôvodňujú najmä skladbou empirického materiálu, z ktorého sa skonštruova-li rastové tabuľky, a ten mal pri smreku prevahu z Českej republiky.
Základom vysokej hodnoty a spoľahlivosti všet-kých rastových tabuliek je popri správnej metodike ich konštrukcie aj empirický materiál, z ktorého sa tabuľky skonštruovali. Nižšia spoľahlivosť alebo prí-padne aj nedôvera k rastovým tabuľkám, ktoré boli skonštruované z jednorázových alebo opakovaných meraní výskumných plôch v kratších časových úse-koch, sa dá eliminovať ich priebežným overovaním na ďalších opakovaných meraniach tých istých vý-
skumných plôch. Dobrým príkladom môže byť Ass-mann (1959), ktorý porovnáva vývoj horných výšok rastových tabuliek Wiedemanna a Zimmerleho s ich vývojom na trvalých výskumných plochách Bavorska. Nami použitá metodika overovania vývo-ja troch základných rastových veličín, a to strednej výšky, hornej výšky a strednej hrúbky, je založená na báze kvantifikácie ich rozdielov medzi hodnota-mi z opakovaných meraní na trvalých výskumných plochách a podľa modelov rastových tabuliek. Vy-chádza z presvedčenia Assmanna (1961), že správ-ne vyjadrenie rastu a produkcie porastov v rasto-vých tabuľkách závisí najmä od toho, ako súhlasí ich výškový vývoj s rastom strednej alebo hornej výšky skutočných porastov. Assmann pripomína, že vývoj stredných výšok významne ovplyvňujú aj prebierky. Výsledkom nášho výskumu sú tieto po-znatky:
– Vývoj stredných výšok smrekových porastov na trvalých výskumných plochách je veľmi blízky s mo- delom rastových tabuliek. Priemerné zvýšenie bonity porastu za päť rokov o 0,22 m je minimálne. Zvýšenie bonity o jeden celý bonitný stupeň, teda 2,00 m, môžeme potom očakávať až po deviatich päťročných intervaloch, teda po 45 rokoch. – Stredná kvadratická chyba vývoja horných výšok
je ± 4,11 %. Priemerná chyba –0,15 % je štatisticky nevýznamná.
– Vývoj stredných hrúbok smrekových porastov je rozdielny od modelového vývoja rastových tabuliek. Stredná kvadratická chyba je ±8,44 %. Priemerná chyba +4,09 % je štatisticky významne rozdielna od nuly a udáva, že stredné hrúbky sú na výskumných plochách väčšie ako v rastových tabuľkách. Tieto rozdiely môžeme zdôvodniť najmä empirickým materiálom použitým na konštrukciu rastových tabuliek, ktorý má prevahu v Českej republike, kde majú smrekové porasty rovnakých bonít o málo menšie hrúbky ako na Slovensku.
Corresponding author:
Doc. Ing. Rudolf Petráš, CSc., Národné lesnícke centrum – Lesnícky výskumný ústav, Zvolen, T. G. Masaryka 22, 960 92 Zvolen, Slovenská republika