SPIN LABELLED PROTEINS
Johannes Erik McKay
A Thesis Submitted for the Degree of PhD at the
University of St Andrews
2016
Full metadata for this item is available in St Andrews Research Repository
at:
http://research-repository.st-andrews.ac.uk/
Please use this identifier to cite or link to this item: http://hdl.handle.net/10023/8820
PELDOR for spin labelled proteins
Johannes Erik McKay
This thesis is submitted in partial fulfilment for the degree of PhD
at the
University of St Andrews
A
CKNOWLEDGEMENTS
This thesis has only been possible with the enthusiastic guidance of my
supervisor Dr Graham Smith. He has challenged me to grow my understanding
and research in an environment where no question was ever dismissed without
thought. I would also like to thank Dr Hassane El Mkami and Dr David
Norman for putting up with my questions, which often showed my Physicists
understanding of Biology and Chemistry.
In this thesis two protein mutants are investigated, Vps75 and MscS. The
sample chemistry and biology of the protein Vps75 was provided as part of a
collaboration with the group of Dr David Norman and significantly by student
Mr Michael Stevens at the University of Dundee. The sample chemistry and
biology of the protein MscS was provided as part of a collaboration with the
group of Prof James Naismith and significantly by post-doctoral researchers
Dr Richard Ward and Dr Christos Pilotas. I give sincere thanks to all of the
researchers who have allowed me to collaborate in their research, providing
the samples and guidance which were vital to the work presented in this thesis.
Beyond the work presented in this thesis I have also been given the opportunity
to expand my knowledge of millimetre wave instrumentation and for this I
owe in addition to my supervisor huge thanks to Dr Duncan Robertson who
I would like to thank those in the millimetre Wave & EPR group who made
the last four years interesting, it will be hard to forget. They are owed thanks
for putting up with my humour! In particular I would like to thank Dr Robert
Hunter, Dr Scott Cassidy and Ms Claire Motion for letting me share an office
A
BSTRACT
The function of a biological molecule is linked to its underlying structure, and
determination of that structure can lead to significant insights into its function
and how this is performed. There already exist a number of important tools in
structural biology, however, the pulsed electron paramagnetic resonance (EPR)
technique called pulsed electron-electron double resonance (PELDOR) is the
only one capable of accurately measuring isolated distances between attached
spin-labels over the range of ~2 to 10 nm, a range which is usually impossible
to measure directly with other techniques such as nuclear magnetic resonance
(NMR) and X-ray crystallography. This can provide constraints for refinement
of structures determined from NMR and X-ray crystallography, or insights into
protein docking and protein mechanics. With recent developments in EPR
spectrometer instrumentation and spin-labelling it has become possible to
conduct PELDOR experiments in the high field EPR regime (>3 Tesla) where
measurement sensitivity is increased. These experiments can reveal relative
orientations of nitroxide spin-labels in complement to their separation,
however, analysis and interpretation of these results has been difficult to
perform routinely.
This thesis presents a characterisation of the high field spectrometer HiPER
showing that it is well suited when optimised for making PELDOR
experiments. To perform analysis of PELDOR signals from this spectrometer
Two case studies are presented. The first relates to the use of the Rx spin label
with the PELDOR experiment to derive orientation information from the spin
labelled protein Vps75. The recently developed spin label Rx is proposed to
attach more rigidly to underlying structure, offering potentially increased
accuracy in determination of structure constraints and additional information
about relative orientations of different structural features. An orientation
selective PELDOR study is presented which compares molecular dynamics
(MD) simulations of spin labels attached to sites on the α-helix of the protein
Vps75. This has shown great potential for utilising the Rx spin label in a
repeatable way on α-helix residue sites for determination of structural
constraints.
The second case relates to orientation selective PELDOR measurements of
spin labelled oligomeric membrane protein structures. High field PELDOR
offers great potential in increasing measurement sensitivity and accuracy of
structural constraints in oligomeric proteins. A methodology of signal analysis
for this class of protein is presented along with measurements of the
membrane channel protein MscS. Difficulties of PELDOR measurement on
these labelled proteins are discussed and observed relaxation of the spin echo,
relevant to pulsed EPR experiments, are investigated and possible mechanisms
Student’s declaration
I, Johannes Erik McKay, hereby certify that this thesis, which is approximately
35,000 words in length, has been written by me, and that it is the record of
work carried out by me, or principally by myself in collaboration with others
as acknowledged, and that it has not been submitted in any previous
application for a higher degree.
I was admitted as a research student in September 2011 and as a candidate for
the degree of PhD in September 2012; the higher study for which this is a
record was carried out in the University of St Andrews between 2011 and 2015.
Date 19/04/2015 signature of candidate
Supervisor’s declaration
I hereby certify that the candidate has fulfilled the conditions of the Resolution
and Regulations appropriate for the degree of PhD in the University of St
Andrews and that the candidate is qualified to submit this thesis in application
for that degree.
Permission for publication
In submitting this thesis to the University of St Andrews I understand that I
am giving permission for it to be made available for use in accordance with the
regulations of the University Library for the time being in force, subject to any
copyright vested in the work not being affected thereby. I also understand that
the title and the abstract will be published, and that a copy of the work may be
made and supplied to any bona fide library or research worker, that my thesis
will be electronically accessible for personal or research use unless exempt by
award of an embargo as requested below, and that the library has the right to
migrate my thesis into new electronic forms as required to ensure continued
access to the thesis. I have obtained any third-party copyright permissions that
may be required in order to allow such access and migration, or have requested
the appropriate embargo below.
The following is an agreed request by candidate and supervisor regarding the
publication of this thesis:
No embargo on print copy. No embargo on electronic copy.
Date 19/04/2015 signature of candidate
T
ABLE OF
A
CRONYMS
CW: continuous wave
DEER: double electron-electron resonance
DQC: double quantum coherence
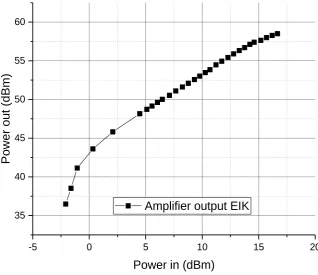
EIK: extended interaction klystron
EM: electro-magnetic
EPR: electron paramagnetic resonance
ESEEM: electron spin echo envelope modulation
FEP: fluorinated ethylene propylene
FID: free induction decay
GA: genetic algorithm
MD: molecular dynamics
MTSSL: methanethiosulfonate spin label
PELDOR: pulsed electron-electron double resonance
Q-factor: quality factor
SDSL:site directed spin labelling
Tm: spin echo phase memory time
W-band: waveguide band of 75 GHz to 110 GHz, with 94 GHz being the common
centre frequency
X-band: waveguide band of 8.2 GHz to 12.4 GHz, with 9.4 GHz being the
Table of Contents
Acknowledgements ... i
Abstract ... iii
Table of Acronyms ...vii
Chapter 1 Introduction ... 1
1.1. Current Applications ... 3
1.1.1. Exploration of current PELDOR techniques in analysis of spin label distance and orientation analysis of two spin label systems ... 3
1.1.2. Exploration of current PELDOR techniques in analysis of poly spin labelled systems in deriving distances between spin labels ... 6
1.2. Overview ... 7
1.2.1. Chapter 2 ... 7
1.2.2. Chapter 3 ... 7
1.2.3. Chapter 4 ... 8
1.2.4. Chapter 5 ... 8
1.2.5. Chapter 6 ... 9
Chapter 2 EPR Theory and instrumentation ... 10
2.1. EPR basics ... 10
2.3. Pulsed EPR experiments for measuring dipolar coupling ... 21
2.4. PELDOR experiment and orientation effects ... 29
2.5. PELDOR signal analysis: Weak angular correlation ... 37
2.6. PELDOR signal analysis: Strong angular correlation ... 40
2.7. PELDOR signal of multiple spins in an oligomer ... 45
2.8. HiPER W-band spectrometer ... 46
Chapter 3 HiPER spectrometer for PELDOR measurements ... 52
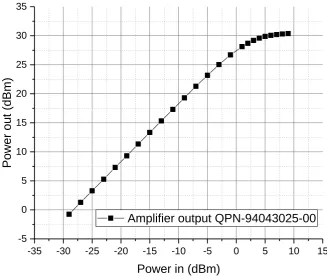
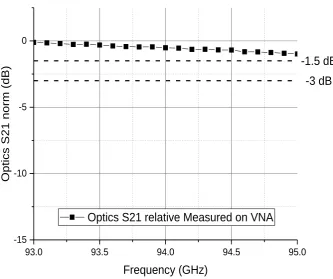
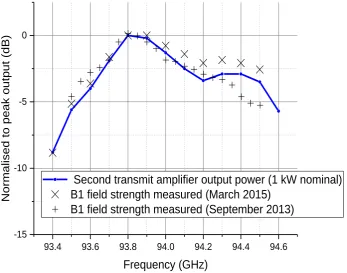
3.1. Bandwidth high power characterisation... 52
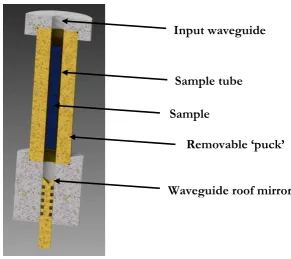
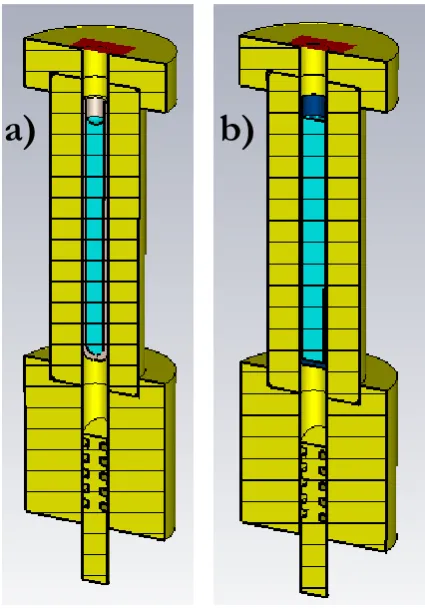
3.2. Properties of EPR sample tube materials in non-resonant sample holders ... 64
3.3. Measurement protocol for PELDOR ... 73
3.4. Conclusions... 76
Chapter 4 High field EPR PELDOR signal simulations ... 78
4.1. PELDOR signal and limitations ... 79
4.2. General model of rigid orientation spin labels ... 85
4.3. Simulation algorithm ... 86
4.4. Comments on implementation using MATLAB ... 88
4.5. Conclusions... 89
Chapter 5 High-field EPR orientation studies of two spin label systems
5.1. Spin label Rx ... 92
5.2. Orientation selective PELDOR at W-band ... 94
5.3. Modelling of two rigid spin labels for orientation selective
PELDOR experiments ... 96
5.4. Simulation and fitting algorithm ... 99
5.5. Constrained spin label Rx studied using the protein Vps75 as a
framework ... 100
5.6. Analysis of Rx spin label molecular dynamics simulations for
orientation selective PELDOR experiments ... 103
5.7. Orientation PELDOR results of Rx residue i+1 helix sites ... 112
5.8. Using orientation PELDOR results as constraints in XPLOR-NIH
126
5.9. Conclusions ... 128
Chapter 6 High field studies of membrane protein MscS with multiple
spin labels. 130
6.1. Theory ... 131
6.2. Modelling homo-oligomeric protein systems with cyclic symmetry
for orientation selective PELDOR experiments ... 134
6.3. Analysis algorithms for cyclically symmetric multiple spin systems
6.4. The analysis of orientation selective PELDOR measurements of
MTSSL on MscS channel protein ... 145
6.5. Conclusions... 166
Chapter 7 Spin echo relaxation studies of the membrane protein MscS with multiple spin labels. ... 167
7.1. PELDOR signal dependence on pulse timing ... 168
7.2. Phase memory time measurements and evidence of instantaneous diffusion in the heptamer ... 170
7.3. Conclusions... 181
Chapter 8 Conclusion... 185
Bibliography ... 190
1. Appendix ... 198
1.1. High performance feedhorns for quasi-optical devices ... 198
1.1.1. Prepared publications ... 199
1.1.2. Patent applications ... 212
1.2. Materials and methods ... 213
1.2.1. Chapter 5 ... 213
Chapter 1
I
NTRODUCTION
The function of a biological molecule is heavily linked to its underlying
structure, and determination of that structure can lead to great insights into its
function and how it is performed [1].
There already exist a number of tools, such as nuclear magnetic resonance
(NMR), fluorescence resonance energy transfer (FRET) and X-ray
crystallography to help understand or derive protein structures. However, the
pulsed electron paramagnetic resonance (EPR) experiment pulsed
electron-electron double resonance (PELDOR) is capable of accurately measuring
separations between spin-labels attached to protein using site directed spin
labelling (SDSL) techniques in the range of ~2 nm to 10 nm and in optimal
conditions >10 nm.
This is a range which is usually impossible to measure directly and accurately
with other techniques [2], with measurements being isolated to only the spin
labels which are attached allowing for the targeting of particular structure
components. This provides structure constraints that can refine existing
models or give insights into protein docking or mechanics. The PELDOR
technique has seen particular growth in application related to membrane
protein structures, a challenging field where other techniques are often
The pulsed EPR experiment PELDOR method works by measuring the
dipole-dipole coupling between clusters of paramagnetic electrons, in this work
introduced by nitroxide spin labels. These spin labels can be attached by site
specific labelling to protein molecules and the strength of the dipole-dipole
interaction of these spin label has a separation and relative orientation
dependence which can reveal information about the relative arrangement of
the structure to which they are attached. However, these PELDOR
experiments can only reveal relative orientation constraints of spin labels, in
complement to the distance between them, when performed in the high
magnetic field EPR regime (>3 Tesla) [5]. It is in the high field regime that the
EPR spectrum of the spin label is broad enough, due to the anisotropic
g-factor, that pulse excitations can excite particular orientations of the spin label
in the magnetic field. Recent developments in EPR spectrometer
instrumentation [6] and spin labelling techniques [7] mean it has become
possible to conduct these experiments, with one such spectrometer being the
W-band HiPER spectrometer at the University of St Andrews [8]. However,
despite the improved measurement instrumentation and techniques the
analysis and interpretation of PELDOR experiment results has been so far
difficult to perform routinely.
In this work I have explored the application of the PELDOR experiment using
high-field EPR for biological systems with the aim of better understanding the
perform the experiments for reliably obtaining this information. The systems
investigated include cases of the Rx spin label type attached to the dimer
protein Vps75 and the MTSSL spin label attached to the oligomeric channel
protein MscS.
1.1. CURRENT APPLICATIONS
1.1.1. EXPLORATION OF CURRENT PELDOR TECHNIQUES IN
ANALYSIS OF SPIN LABEL DISTANCE AND ORIENTATION
ANALYSIS OF TWO SPIN LABEL SYSTEMS
The first reported use of the PELDOR experiment was by Milov [9, 10] where
the modulation of an electron spin echo from nearby dipole coupled radicals
was achieved by the use of a secondary microwave field. Since that initial
development there have been many experiments designed to measure the
dipolar coupling between electron spins. The most widely used of these, and
the pulse sequence used throughout this work, is the four pulse PELDOR
sequence [11], and there have been several reviews and chapters discussing
these pulse sequences and their development [2, 12, 13].
It has been of particular interest to characterise the application of the
PELDOR experiment and refine analysis methods using model molecule
systems. Model systems of two nitroxides have been measured using PELDOR
to derive distances ranging from 1.4 nm to >5 nm corresponding to the
molecular models with get accuracy [11, 14, 15]. It has also been shown that
[16-18]. These measurements have validated the application of regularised
fitting for distance distributions and also the general principle of deriving angle
and distance geometry from the PELDOR signals.
Beyond model molecules the principle application of the PELDOR
experiment has been the measurement of distances between spin label probes
attached to protein molecules. The attachment of spin label probes to
biomolecules has been advanced principally using nitroxide spin label [7, 19],
principally using the spin label MTSSL [20], and has developed into the
technique commonly referred to as SDSL. There are a wealth of other spin
labels and labelling techniques developed which are working towards
advancements in spin labelling biomolecules generally and to improve the
quality of the EPR measurements, these have been discussed in several
excellent reviews [7, 21-23]. Cases of particular interest to the author and this
work include: increasing the spin echo coherence time [24-26], pulsed EPR
measurement of spin labelled proteins at room-temperature [27-30], labelling
of non-cysteine residues [31-34] and measurement of spin labelled protein
in-cell [35-40].
There has also been significant interest and progress in developing rigid spin
labels, where the spin label dynamics are dominated by the structure to which
they are attached. These rigid labels have been developed for nucleic acid
structure with EPR measurements showing the labels are rigid to their
well-established MTSSL label have been developed [42, 43], with the Rx spin label
being used in this work. The Rx spin label increases the spin label rigidity to
the underlying structure by requiring two disulphide bonds to cysteine on the
secondary structure.
Measurement of angles between spin labels with the PELDOR experiment has
also become possible with the increased availability of high-field EPR
spectrometers [44]. One particular challenge in developing a pulse EPR
spectrometer for orientation selective PELDOR is the bandwidth needs to be
comparable to the spectral width of the radical under study, which for a
nitroxide spin label is ~400 MHz. This is difficult to achieve using a traditional
EPR resonator, however, several techniques have been developed to overcome
this by making the resonator have two tuneable resonances [45] or changing
the magnetic field on a nanosecond timescale [46]. It is however also possible
to use so-called non-resonant cavity based spectrometers [8, 47], with this work
being conducted on the HiPER EPR spectrometer.
Orientation selective PELDOR measurements of biomolecules has been
shown in the case of X-band, however, it was shown that the g-factor
anisotropy was not well resolved at these fields and higher field studies are
needed to solve for all of the relative angles [16, 48]. High field orientation
selective PELDOR measurements and analysis showing orientation
selective measurements have been made on model molecules, RNA, protein
and membrane protein.
1.1.2. EXPLORATION OF CURRENT PELDOR TECHNIQUES IN
ANALYSIS OF POLY SPIN LABELLED SYSTEMS IN DERIVING
DISTANCES BETWEEN SPIN LABELS
The application of PELDOR measurements on clusters of >2 spins has been
based on characterisation work on model molecules with up to 4 spins
measured [54-56]. In a PELDOR study of a trimer model the relative angles
between the spin labels were solved [57].
There has been several applications of PELDOR for the measurement of
distances between multiple spin labels in proteins [3, 54, 58-61], particularly
membrane proteins. Measurement of membrane proteins are often hindered
by short phase memory times related to the model membrane, there has been
interest in studying the influence of the model membrane on the relaxation
times of the spin labels with studies comparing the different environments [62].
One problem with PELDOR measurement of poly spin molecules is the
introduction of oscillations in the PELDOR signal which are mixing products
of the dipolar coupling frequencies between the pairs within the system. These
result in sum and difference frequencies which can cause significant artefacts
in the analysis of these signals. It was found that by applying a power scaling
correction to the signal proportional to the number of spins that these artefacts
measurement programs which reduce the fraction of spins in the molecule
acted on by the pump pulse and purposely reducing the number of spins per
molecule by under-labelling can also significantly suppress these artefacts [54,
64].
PELDOR studies of membrane proteins have despite the great difficulty of
the PELDOR measurement and crystallisation have resolved the distances
predicted in complement by x-ray crystallography [3, 65, 66], however, it has
been observed that only the shortest distance could be resolved reliably in large
oligomers inside membrane layers due to short phase memory times.
1.2. OVERVIEW
1.2.1. CHAPTER 2
This chapter provides an introduction to the fundamental EPR theory building
up to a description of the PELDOR signals which are core to the work in this
thesis. Presented also is an introduction to the hardware requirements and
basic components needed for a high field pulsed EPR spectrometer suitable
for the studies presented.
1.2.2. CHAPTER 3
To effectively analyse the PELDOR signals measured using the W-band EPR
spectrometer HiPER [8] calibrations of the full bandwidth performance of the
spectrometer needs to be made, and consideration made to the loading and
spectrometer was made, along with calibration measurements of the effective
microwave magnetic field component across the full spectrometer bandwidth.
Discussions and simulations of the performance of the sample tube materials
and arrangements are presented, showing that fluorinated ethylene propylene
(FEP) is a more effective material than standard EPR tubing made from quartz,
which is more likely to introduce unpredictable reductions in the
spectrometer’s effective bandwidth.
1.2.3. CHAPTER 4
An overview of the PELDOR signal simulation codes used in the analysis of
PELDOR experiments is presented, along with a generalised algorithm.
Several optimizations were implemented to reduce computation time, and
these are discussed.
1.2.4. CHAPTER 5
This chapter presents an investigation into modelling the conformation which
the bipedal spin label Rx takes when attached to different attachment sites of
the dimer protein Vps75. An analysis of molecular dynamics (MD) simulations
of the spin label attached to the different sites was made to investigate
suitability of the spin label for orientation selective PELDOR studies. W-band
orientation PELDOR measurements were made and a model of the spin label
conformation was fitted to these results. A comparison of the W-band
PELDOR derived model was made to MD simulation models to provide
measurement and analysis. The use of this orientation information as structural
constraints is the important link between measurement and useful application
to structural biology and is discussed
1.2.5. CHAPTER 6
The oligomeric protein systems MscS with 7 spin labels were measured and
evidence of orientation information was revealed in the measurement, however
strong relaxation and PELDOR signal distortions were observed. The effect
and mitigation of the relaxation effect was explored by analysis of the signals
compared to the fraction of the spin label spectrum excited and measurements
of the spin echo phase memory time (Tm). Methodologies for the simulation
and analysis of spin labelled cyclic symmetric oligomeric systems were
developed and discussed. By applying these methods, in complement to
experiment procedures which take into consideration the strong relaxation
effects observed, it is possible to obtain orientation structural constraints from
Chapter 2
EPR
T
HEORY
AND
INSTRUMENTATION
This chapter will overview the basic EPR theory building up to a fundamental
description of the PELDOR experiment and the associated signal
approximation used in the rest of the work. The origin of the orientation
dependence on this signal will also be highlighted. There are many textbooks
that explain in detail the principles of EPR and pulsed EPR spectroscopy, and
the author finds particularly useful [13, 67, 68].
2.1. EPR BASICS
The origin of the resonance phenomenon that underpins EPR is the spin and
angular momentum of the electron. This gives rise to a magnetic moment of
an electron which can be expressed as
𝝁 = 𝑞 2𝑚ℏ𝑺 . Equation 2.1.1
The constant factors in this expression are often expressed as the Bohr
magneton given by the expression
𝛽𝑒= 𝑒ℏ 2𝑚𝑒,
Equation 2.1.2
𝝁𝒆 = −𝑔𝛽𝑒𝑺 . Equation 2.1.3
The factor g is a value given to relate the observed classical behaviour of the
particle to its underlying quantum angular momentum quantum number. For
a free electron this can be expressed as the constant 𝑔𝑒 and is one of the most accurately determined physical constants. For an unpaired electron in a
molecule the local environment can perturb this value from the constant 𝑔𝑒 and is instead expressed as a g-tensor which is defined in its principal axis
frame.
2.2.SPIN HAMILTONIAN
A brief overview and descriptions of the relevant spin Hamiltonian terms for
this work will be presented here, however, a full description and treatment of
the spin Hamiltonian can be found in many standard textbooks [13, 69].
Considering the interaction of the electron magnetic moment with a static
magnetic field which will be expressed by the vector 𝑩𝟎 the spin system energy can be described by the following static spin Hamiltonian
𝓗𝟎 = 𝛽𝑒𝑩𝟎𝒈𝑺⁄ℏ+ 𝑺̃𝑫𝑺 +∑𝑺̃𝑨𝒌𝑰𝒌 𝑚
𝑘=1
− 𝛽𝑛∑𝑔𝑛 𝑘𝑩̃𝟎𝑰𝒌⁄ℏ 𝑚
𝑘=1
+ ∑ 𝑰̃𝒌𝑷𝒌𝑰𝒌 𝐼𝑘>1 2⁄
+∑𝑰̃𝒊𝒅𝒊,𝒌𝑰𝒌
𝑖≠𝑘
.
The first term in the Hamiltonian, 𝛽𝑒𝑩𝟎𝒈𝑺⁄ℏ, is the electron Zeeman
interaction, which relates to the interaction between the magnetic field 𝑩𝟎 and the magnetic moment of the electron spin, where 𝑺 is the electron spin operator.
The second term, 𝑺̃𝑫𝑺, is the zero-field-splitting interaction of the electron spin
system occurring when the electron spin system has a quantum number S>½
and to a first order relates to the dipole-dipole and exchange interaction
between the electron spins in the same electron spin system. This interaction
depends on whether the total spin number of unpaired electrons in the spin
system is non-integer or integer. The resulting interaction is described by the
zero-field-splitting interaction tensor 𝑫.
The third term, ∑𝑚𝑘=1𝑺̃𝑨𝒌𝑰𝒌, is the electron-nuclear hyperfine interaction, which
relates to the interaction couplings between the electron spin system to each
of the connected nuclei 𝑰𝒌,where 𝑰𝒌 is the k’th nuclear spin operator, coupled
by their associated hyperfine interaction tensor 𝑨𝒌. The interaction has several
mechanisms with the largest contributions being split into the isotropic Fermi
contact and the dipole-dipole interaction. The isotropic part only has a
significant contribution when the electron occupies the s orbital, where it has
a probability of being at the same position as the nucleus, and is independent
of the relative orientation relative to the magnetic field. The anisotropic
interaction meaning there will be a dependence on their relative orientation
and distance separation.
The first three terms correspond to the electron spin interaction with: the
surrounding static magnetic field, electron spins within the system and local
nuclear spins. We can apply the same treatment to each of the local nuclei in
the spin system.
Thus we find the fourth term, 𝛽𝑛∑𝑚𝑘=1𝑔𝑛 𝑘𝑩̃𝟎𝑰𝒌⁄ℏ, is the nuclear Zeeman
interaction relating to the interaction between each nuclei 𝑰𝒌 and the magnetic
field 𝑩𝟎 .
The fifth term, ∑𝐼𝑘>1 2⁄ 𝑰̃𝒌𝑷𝒌𝑰𝒌, is the nuclear quadrupole interaction which
applies to each nuclear spin 𝑰𝒌 that has a spin quantum number I>1 where the
nuclei has an uneven charge distribution on its surface and the interaction is
described by the interaction tensor 𝑷𝒌.
The final term, ∑𝑖≠𝑘𝑰̃𝒊𝒅𝒊,𝒌𝑰𝒌, in the static spin Hamiltonian is the dipole-dipole
interaction between each of the i’th and k’th nuclei, where the coupling is
described by the interaction tensor 𝒅𝒊,𝒌.
Of particular interest in this work is the case of two electron spins which are
weakly coupled to each other, ie not electron spins within the same spin system
which would be described by an electron spin quantum number S>½ and
require a description of the zero-field-splitting interaction mentioned - but
systems. In this case we designate the different electron spin vectors by
subscripts 𝑺𝟏, 𝑺𝟐, 𝑺𝟑, 𝒆𝒕𝒄 and their interactions are characterised by two interactions, exchange coupling with the interaction tensor 𝑱 and electron-electron dipole-dipole coupling with the interaction tensor 𝐷𝑒𝑒. We can now write a complete Hamiltonian for two weakly coupled electron spin systems as
𝓗𝟎(𝑺𝟏, 𝑺𝟐)= 𝓗𝟎(𝑺𝟏) + 𝓗𝟎(𝑺𝟐) + 𝓗𝑱+ 𝓗𝑫𝒆𝒆 . Equation 2.2.2
The Heisenberg exchange coupling interaction occurs when there is overlap in
the electron orbitals such that the two electrons can exchange with each other
and this can occur in molecules where the electrons are strongly delocalised or
that the electrons are suitably close to each other, in the range of <1.5 nm. The
exchange coupling Hamiltonian term can be written using the exchange
coupling interaction tensor 𝑱 as
𝓗𝑱 = 𝑺𝟏𝑱𝑺𝟐 . Equation 2.2.3
The electron-electron dipole-dipole coupling interaction is due to the
interaction of the magnetic dipoles of each electron, and will be the dominant
interaction under study in this work. The dipole-dipole coupling Hamiltonian
𝓗𝑫𝒆𝒆 = 𝑺𝟏𝑫𝒆𝒆𝑺𝟐 . Equation 2.2.4
By considering the case of a classical magnetic dipole pair interacting we can
derive the Hamiltonian for a pair of interacting magnetic dipoles. We begin
with the classical expression for the vector potential of a magnetic dipole with
the magnetic moment 𝝁𝟏
𝑨 = 𝜇0 4𝜋
𝝁𝟏× 𝒓 𝑟2 Equation 2.2.5
From which we can then define the field that is associated with this potential
by finding the gradient of the potential
𝑩 = 𝛁 × 𝑨 = 𝜇0 4𝜋
3(𝝁𝟏.𝒓)𝒓−𝑟2𝝁𝟏
𝑟5 .
Equation 2.2.6
This the interaction of another magnetic moment 𝝁𝟐 with this field gives an interaction energy of
𝐸𝑑𝑑 = −𝝁𝟐. 𝑩 = −𝜇0 4𝜋
3(𝝁𝟏.𝒓)(𝒓.𝝁𝟐)−𝑟2(𝝁𝟏.𝝁𝟐)
𝑟5 .
Equation 2.2.7
We can then replace the magnetic dipole moments with the quantum
mechanical operators such that we get the Hamiltonian for the
𝓗𝑫𝒆𝒆 = −𝜇0𝛾1𝛾2ℏ
4𝜋𝑟3 (3(𝑺𝟏. 𝒓̂)(𝒓̂. 𝑺𝟐) − (𝑺𝟏. 𝑺𝟐)) . Equation 2.2.8
The resulting Hamiltonian has a 1⁄𝑟3 dependence characteristic of the dipole-dipole interaction. If we were to now express the vector r in spherical
coordinates 𝒓 = (𝑟𝑥, 𝑟𝑦, 𝑟𝑧) = (𝑟 sin 𝜃 cos 𝜙 , 𝑟 sin 𝜃 sin 𝜙 , 𝑟 cos 𝜃) and simplify, we obtain the common result of the dipolar coupling term expressed
using the ‘dipolar alphabet’
𝓗𝑫𝒆𝒆 =𝜇0𝛾1𝛾2ℏ
4𝜋𝑟3 (𝑨 + 𝑩 + 𝑪 + 𝑫 + 𝑬 + 𝑭) Equation 2.2.9
𝑨 = 𝑺𝟏𝒛𝑺𝟐𝒛(1 − 3cos2𝜃) 𝑩 = −1
4[𝑺𝟏 +𝑺
𝟐−+ 𝑺𝟏−𝑺𝟐+](1 − 3cos2𝜃)
𝑪 = −3 2[𝑺𝟏
+𝑺
𝟐𝒛+ 𝑺𝟏𝒛𝑺𝟐+] sin 𝜃 cos 𝜃 𝑒−𝑖𝜙
𝑫 = −3 2[𝑺𝟏
−𝑺
𝟐𝒛+ 𝑺𝟏𝒛𝑺𝟐−] sin 𝜃 cos 𝜃 𝑒𝑖𝜙
𝑬 = −3 4𝑺𝟏
+𝑺
𝟐+sin2𝜃 𝑒−2𝑖𝜙
𝑭 = −3 4𝑺𝟏
−𝑺
If we consider the Hamiltonian for the electron-electron dipole-dipole
interaction in isolation, we can see the action of each of the letters of the
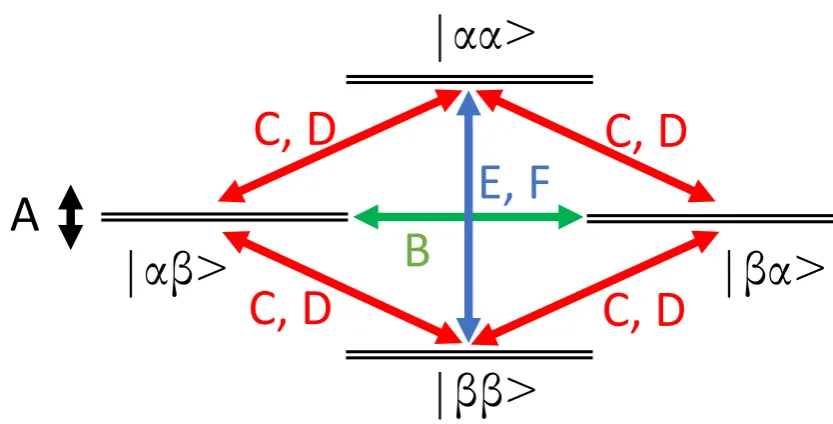
alphabet. An energy level diagram is shown in Figure 2.2.1 for two spin 1⁄2 with dipole-dipole coupling using the basis set |𝜶𝜶⟩, |𝜶𝜷⟩, |𝜷𝜶⟩ & |𝜷𝜷⟩ which correspond to the two states which each electron can take 𝜶 and 𝜷 corresponding to ‘spin up’ and ‘spin down’ and the four permutations of these
[image:32.595.116.533.317.529.2]states.
Figure 2.2.1 Energy level diagram of two spin ½ with dipolar coupling. Each level is split according to the A term of the dipolar alphabet (Equation 2.2.10) and each of the other terms can lead to manipulation of the spin system as indicated by the arrows.
The 𝑨 term represents the dipolar coupling energy in the system, and each EPR line will split into a doublet with a separation equal to the energy 𝑨. The 𝑩 term as shown has the action of a mutual spin flip-flop where the states of each spin flips together. A measureable probability of this 𝑩 term process
|αβ>
|βα>
|ββ>
|αα>
C, D
C, D
C, D
C, D
E, F
requires a small difference in the Zeeman energies of each spin and a dipolar
coupling energy comparable to this difference in Zeeman energies. For the case
of dipole coupled nitroxide spin labels at W-band EPR (3.3 Tesla) this term is
normally insignificant. This is due to the spectral width of nitroxide spin labels
being ~400 MHz and a typical spin separation of >2 nm which corresponds
to a dipolar coupling strength of <6 MHz. This makes the condition of dipolar
coupling being comparable to the Zeeman energy difference unlikely. The 𝑪, 𝑫 terms lead to a spin flip of one or other of the spins and this process can only
have a significant probability if the strength of the dipole-dipole coupling
energy is close to the energy of the Zeeman interaction energy. The 𝑬, 𝑭 terms lead to spin flips of both the spins states, where again the process can only
have significant probability if the strength of the dipole-dipole coupling energy
is close to the energy of the Zeeman interaction. For the application of
W-band EPR, the Zeeman energy is very much greater than the relevant dipolar
coupling energies and the 𝑪, 𝑫, 𝑬, 𝑭 terms can be neglected. The 𝑩 term can also be neglected in most cases of the nitroxide spin label, although careful
consideration should be given to this term if there are spin labels with rigid
orientation which can lead to comparable Zeeman interaction energies and
cases where there is strong dipolar coupling energy.
In this work the systems studied have no electron orbital overlap and are
𝓗𝟎(𝑺𝟏, 𝑺𝟐)= 𝓗𝟎(𝑺𝟏) + 𝓗𝟎(𝑺𝟐) + 𝓗𝑫𝒆𝒆 . Equation 2.2.11
The 𝓗𝟎 Hamiltonian will include any relevant electron-nuclear hyperfine coupling interactions. We can thus express a single Zeeman energy for each of
the spins as 𝜔1 and 𝜔2. Based on the discussion so far we can write the dipolar coupling Hamiltonian as
𝓗𝑫𝒆𝒆 =𝜇0𝛾1𝛾2ℏ
4𝜋𝑟3 (1 − 3cos2𝜃) (𝑺𝟏𝒛𝑺𝟐𝒛− 1 4[𝑺𝟏
+𝑺
𝟐−+ 𝑺𝟏−𝑺𝟐+]) Equation 2.2.12
and the full relevant Hamiltonian as
𝓗𝟎(𝑺𝟏, 𝑺𝟐) = 𝜔1𝑺𝟏𝒛+ 𝜔2𝑺𝟐𝒛+ 𝜔𝐷𝐷𝑺𝟏𝒛𝑺𝟐𝒛− 1
4𝜔𝐷𝐷[𝑺𝟏 +𝑺
𝟐−+ 𝑺𝟏−𝑺𝟐+] Equation 2.2.13
where
𝜔𝐷𝐷 =𝜇0𝛾1𝛾2ℏ
4𝜋𝑟3 (1 − 3cos 2𝜃)
Equation 2.2.14
We can also write this Hamiltonian in matrix form using again the basis set
|𝜶𝜶⟩, |𝜶𝜷⟩, |𝜷𝜶⟩ & |𝜷𝜷⟩. We can calculate the different operators for the system of two spin ½ electrons by the application of tensor operators. First we
𝓗𝟎(𝑺𝟏) + 𝓗𝟎(𝑺𝟐) =1 2(
𝜔1+ 𝜔2 0 0 0
0 𝜔1− 𝜔2 0 0
0 0 −𝜔1 + 𝜔2 0
0 0 0 −𝜔1− 𝜔2
)
,
Equation 2.2.15
the dipolar coupling Hamiltonian with the following matrix
𝓗𝑫𝒆𝒆 =1 4(
𝜔𝐷𝐷 0 0 0
0 −𝜔𝐷𝐷 −𝜔𝐷𝐷 0
0 −𝜔𝐷𝐷 −𝜔𝐷𝐷 0
0 0 0 𝜔𝐷𝐷
) ,
Equation 2.2.16
and is combined to give the complete weak dipolar coupled Hamiltonian for
two spin ½ electrons in matrix form
𝓗𝟎(𝑺𝟏, 𝑺𝟐)
=1 4(
2(𝜔1+ 𝜔2) + 𝜔𝐷𝐷 0 0 0
0 2(𝜔1− 𝜔2) − 𝜔𝐷𝐷 −𝜔𝐷𝐷 0
0 −𝜔𝐷𝐷 2(−𝜔1+ 𝜔2) − 𝜔𝐷𝐷 0
0 0 0 2(−𝜔1− 𝜔2) + 𝜔𝐷𝐷
)
Equation 2.2.17
There are several interesting observations which can be seen from this spin
Hamiltonian matrix. First is the explicit illustration of the conditions for which
difference in Zeeman energies of the two spins |𝜔1− 𝜔2| as discussed earlier. The second is that if we are only looking at allowed transitions, where the
electron spin quantum number is only changing by ±1, known as single
quantum transitions, then we observe resonance lines at 𝜔1 and 𝜔2 which are both split into doublets where the splitting is ±𝜔𝐷𝐷 as shown in Figure 2.2.2. It is often the case that the angle 𝜃 which is the angle between the vector connecting the two electrons and the static magnetic field, for which the value
of 𝜔𝐷𝐷 depends, is randomly orientated in the sample. This results in the splitting taking on a spherically averaged distribution commonly referred to as
the Pake pattern rather than a simple doublet.
Figure 2.2.2 Illustration of the doublet splitting of a single EPR line due to dipolar coupling.The resonances for two spin ½ are shown in red and purple, where they are split into a doublet by their mutual dipolar coupling.
2.3.PULSED EPR EXPERIMENTS FOR MEASURING DIPOLAR
COUPLING
We can observe from the dipole coupled spin pair Hamiltonian as derived in
the previous chapter 2.2 that the dipolar coupling energy has a 1⁄𝑟3
±½ω
DD±½ω
DDω
resonance
ω
2dependence, such that if the 𝜔𝐷𝐷 energy term can be measured we can obtain the distance between the electrons. It is the possibility to provide the distance
between unpaired electrons in the 2-10 nm range that has particular interest
for structural biology problems. Several pulsed EPR experiments have been
developed to derive the dipolar coupling energy.
The most basic experiment is the use of continuous wave (CW) EPR to try to
probe the dipolar broadening of the resonance lines, however for most dipolar
coupling energies corresponding to inter-electron separations of over 2 nm the
dipolar broadening is small compared with other broadening contributions to
the resonance line width and the dipolar coupling broadening will be masked.
These other broadening contributions can include an anisotropic g-factor
tensor or hyperfine coupling tensor, which were introduced earlier. Thus the
applicability of the CW dipolar coupling energy measurement is limited to
electrons that are separated by less than 2 nm.
Pulsed EPR methodologies which overcome this restriction include the 2+1
experiment, the double quantum coherence (DQC) experiment and PELDOR
also known as double electron-electron resonance (DEER). This work will
concentrate on the application of the PELDOR experiment, however the other
Figure 2.3.1 Spin echo pulse sequence. The first π/2 pulse generates spin coherence which evolves for time τ1 until a π pulse refocussed the coherence to produce a spin echo at a time τ1
after the last pulse.
It is also worth making the observation that the dipolar coupling 𝜔𝐷𝐷 can sometimes be measured directly on the primary spin echo [70], Figure 2.3.1,
under the conditions that both coupled electrons are excited by the pulses. The
origin of the signal is due to dephasing of the spin packets contributing to the
echo due to the mutual dipolar coupling of the spins. In this way we would
expect to see a signal which has the form
𝑉(𝑡) = 2 cos(2𝜔𝐷𝐷𝜏1) . Equation 2.3.1
However this direct measurement of the dipolar coupling in the primary echo
requires that we excite many of the electron pairs with the same pulse sequence,
and that any other effects contributing towards the dephasing of the electron
spin does not mask the modulation effect. However, it is often the case that
there are more significant dephasing mechanisms than the dipolar coupling
such as coupling to surrounding nuclei, making the dipolar coupling
contribution very difficult to measure from this experiment.
t
sequence
π/2
π
Figure 2.3.2 2+1 pulse experiment sequence. The first π/2 pulse generates spin coherence which evolves for time τevolve until a π pulse causes spin flips which introduce a reversing of the
dipolar coupling and introduces a dephasing of the spin echo proportional to τevolve and the
dipolar coupling. The coherence continues to evolve until the final π pulse refocussed the coherence to produce a spin echo at a time τ1 after the last pulse.
The 2+1 experiment [71], Figure 2.3.2, is a single microwave frequency pulsed
experiments which probes the dipolar coupling between electrons. The
sequence uses a single common pulse frequency 𝜔𝑚𝑤1 and has similarity to the primary spin echo sequence. The principle is to excite coherence in one of
the electron spins with the initial π/2 pulse, which we will call the A spin. This
spin is then allowed to evolve for some time, shown as τevolve, after which an
additional π pulse is applied. Ideally this π pulse would only act on the partner
electron spin to the one which the π/2 pulse acted, which we will call the B
spin. However, because the sequence is applied at the same microwave
frequency a compromise must be made and instead of a π pulse a smaller than
π flip angle is commonly used. This results in an inefficient pulse operator
acting on the A spin but still acting enough on the B spin such that the electron
spin is ‘flipped’ and the dipolar coupling phase is reversed. To resolve the 𝜔𝐷𝐷 coupling this pulse is stepped at small intervals relative to the initial π/2 pulse
t
sequence
π/2
π
τ
1π
τ
evolvesuch that the dephasing accumulated due to the dipolar coupling is varied
resulting in the final echo being modulated by the dipolar coupling as a
function of the delay between the first and second pulse. The final π pulse is
applied at a fixed time after the initial π/2 pulse and acts to refocus the
coherence evolved in the A spin such that it can be observed as a spin echo τ1
after the final pulse. The advantage of this sequence over the simple primary
echo sequence is that the time between the π/2 coherence generating pulse and
the final π refocus pulse is fixed, and this makes the modulation of the spin
echo independent of other dephasing relaxation which was discussed as a
hindrance to the detection of the dipolar coupling by the spin echo sequence.
It has been shown that the optimal flip angles are for the first and third pulse
to have the same flip angle and for the second pulse to be 2π/3.
Figure 2.3.3 DQC pulse experiment sequence. The pulse sequence is single frequency and transfers spin echo coherence into the double quantum transition where the evolution in higher order coherence filters other coherence pathways not created by the electron-electron dipole interation.
The DQC experiment [72] is another single frequency pulsed experiment for
probing dipolar coupling and is commonly performed as a 6 pulse EPR
t
sequence
π/2
π
π/2
π
π/2
π
experiment where the microwave source with frequency 𝜔𝑚𝑤1 is common to all of the pulses. The pulse sequence is shown in Figure 2.3.3. This sequence
differs significantly from the previously mentioned experiments and the action
of the different pulses will be discussed. The initial π/2 pulse generates
coherence that is allowed to evolve for a time τ1 before a π pulse is applied to
refocus this coherence at a time τ1 after the π pulse. After the refocussing
π/2-π-π/2 pulses are applied and the action of these pulses is to transfer coherence
generated by the first π/2 pulse to the double quantum transitions, between
the spin states |𝜶𝜶⟩ & |𝜷𝜷⟩ , the π pulse refocuses this evolution and the following π/2 pulse transfers this coherence back into detectable single
quantum coherence again. The coherence will continue to evolve as single
quantum coherence until a π pulse is applied to refocus the coherence as an
observable echo. The π/2- π- π/2 sequence acts as a double quantum filter
which isolates the electron spin pair dipolar coupling contribution from other
Figure 2.3.4 3-pulse PELDOR experiment sequence. The first π/2 pulse generates spin coherence which evolves for time τevolve until a π pulse causes spin flips which introduce a
reversing of the dipolar coupling and introduces a dephasing of the spin echo proportional to τevolve and the dipolar coupling strength. The coherence continues to evolve until the final π
pulse refocussed the coherence to produce a spin echo at a time τ1 after the last pulse.
In the 2+1 sequence, where the dipolar coupling interaction is isolated by
keeping the spin echo π/2 and π pulse sequence fixed and introducing an
additional π dephasing pulse, the π dipolar dephasing pulse had the problem
that it acts on both the spin A and spin B. This problem is addressed with the
3-pulse PELDOR experiment [73], Figure 2.3.4, where the π dipolar
dephasing pulse is now applied at a separate microwave frequency from the
spin echo sequence. Provided that the resonance of the two electron spins
spectrum is broader than the pulse excitation bandwidth such that the
resonance of the electron spin A different from spin B then in most cases
individual pulses will excite different spins with reasonable probability. If the
spin resonance between the two spins is uncorrelated such that there is an
occasion when the pulses act on different combinations of spin A and B then
the experiment can be more complicated, and this has been discussed
extensively in recent publications [74, 75].
t
sequence
π/2
π
τ
1π
τ
evolveFigure 2.3.5 4-pulse PELDOR experiment sequence. The first π/2 pulse generates spin coherence of spin A which evolves for time τ1 until a π pulse refocuses the coherence at a time
τ1 after the pulse which moves the ‘zero time of coherence evolution’. Another π pulse generated
at another microwave frequency causes selective spin flips on spin B which introduce a reversing of the dipolar coupling on the coherence of spin A and introduces a dephasing of the spin A echo proportional to τevolve away from 2 τ1 and the dipolar coupling strength. The coherence
continues to evolve until the final π pulse refocussed the coherence to produce a spin echo at a time τ2 after the last pulse.
The 4-pulse PELDOR experiment [11], Figure 2.3.5, is a further expansion
upon the 3-pulse PELDOR experiment where there is an additional refocus π
pulse placed such that the time of ‘zero’ evolution is moved from being
immediately after the initial π/2 pulse to being τ1 after the first refocus π pulse.
This makes the sequence ‘dead-time free’, as the simpler 3-pulse sequence
suffers from not being able to measure the very initial dipolar modulated
evolution times due to technical and experimental problems of having the
initial π/2 and ‘pump’ π pulse close together.
As the main concentration of this work is the application of the four pulse
PELDOR experiment, hereafter referred to as the PELDOR sequence, and
this experiment will now be discussed in more detail.
t
sequence
π/2
π
τ
1π
τ
evolveπ
τ
22.4.PELDOR EXPERIMENT AND ORIENTATION EFFECTS
The PELDOR signal arises from the echo of one electron spin, generated by
the observer echo sequence, being modulated by the dipolar coupling between
that spin and any other nearby electron spin which is excited by the pump
pulse. The modulation of the echo is due to the change in magnetic field seen
by the observer spin, caused by the dipolar field between the two spin being
reversed by flipping of the pump spin, causing a dephasing of the echo and
reducing the echo amplitude proportional to the time of the pump pulse after
zero time of the echo evolution. It is common, and for simplified analysis it is
preferable, for each molecule in a sample to have only two unpaired electrons
with a defined dipolar coupling. In a dilute sample there will be a concentration
of pairs in a volume which defines how many molecules there are in a given
volume, often given in the unit of µmol/L. The concentration is sometimes
given as a so called spin-concentration where it is the total number of unpaired
electron spin in a given volume, again often given in the unit of µmol/L. Thus
for a given sample of electron spin pairs with a particular concentration there
will be a PELDOR signal associated with the defined dipolar coupling between
the spin pairs but also from the distribution of dipolar couplings between spins
in each of the near-by molecules. This distribution of dipolar couplings will
depend on the concentration of electron spins and the geometry of the wider
system, where the geometry is often simplified to a given dimensionality, e.g.
planar or homogenous in three-dimensions. We can thus express our
𝐼𝑃𝐸𝐿𝐷𝑂𝑅(𝑡) = 𝐼𝑖𝑛𝑡𝑒𝑟(𝑡) × 𝐼𝑖𝑛𝑡𝑟𝑎(𝑡) , Equation 2.4.1
where 𝐼𝑖𝑛𝑡𝑒𝑟(𝑡) is the signal component from inter-molecule (between molecules) dipolar couplings and 𝐼𝑖𝑛𝑡𝑟𝑎(𝑡) is the signal component from intra-molecule (each single intra-molecule) dipolar couplings.
Considering first the signal 𝐼𝑖𝑛𝑡𝑟𝑎(𝑡) which arises from the intra-molecule coupling, the electron spin pair signal. It is useful at this point to revisit the
pulse sequence and to investigate the action of each of the pulses.
The sequence requires the use of two microwave frequencies which we will call
𝜔𝑚𝑤 𝑜𝑏𝑠𝑒𝑟𝑣𝑒 and 𝜔𝑚𝑤 𝑝𝑢𝑚𝑝. It will be assumed at this point that we have the case of an isolated pair of electron spins with a defined dipolar coupling
between them and that one of the spins will be resonant at the microwave
frequency 𝜔𝑚𝑤 𝑜𝑏𝑠𝑒𝑟𝑣𝑒 and the other electron spin will be resonant at 𝜔𝑚𝑤 𝑝𝑢𝑚𝑝. We will label both of these spins as spin A and spin B respectively. We will also call the pulses acting on spin A the observer pulses and the pulse
acting on spin B the pump pulse. In the sequence is a refocused echo pulse
sequence which consists of a π/2 pulse (pulse 1 in the observer sequence)
which will excite coherence in spin A, and this will be allowed to evolve for a
time τ1. At this point the action of a π pulse (pulse 2 in the observer sequence)
at time τ1 will reverse the evolution of spin A and it will begin to refocus after
refocussed its spin evolution and there will be a spin echo. We can then wait
another time τ2 after this zero evolution and again apply a π pulse (pulse 3 in
the observer sequence), which will again reverse the evolution of spin A and
refocus it after a time τ2 has passed. It is at the time τ2 after the last observer
pulse in the sequence when we detect and record the refocused spin echo
which is formed. So far we have not applied our π pump pulse and will simply
be measuring a refocussed echo. If we now apply the π pump pulse, at the
𝜔𝑚𝑤 𝑝𝑢𝑚𝑝 microwave frequency, which will act on the spin B we will observe a change in the measured echo. The effect of the π pump pulse on the echo
will depend in part on the timing of the pulse relative to the zero evolution
time described previously and the strength of the dipolar coupling. The origin
of the modulation effect can be considered in terms of the so called spin
precession. Each spin in the pair will have a spin precession frequency, its
resonance frequency, which in the isolated spin pair case will be
𝜔𝑟𝑒𝑠𝑜𝑛𝑎𝑛𝑐𝑒 𝐴,𝐵±1
2𝜔𝐷𝐷. If we have spin A precessing at the frequency 𝜔𝑟𝑒𝑠𝑜𝑛𝑎𝑛𝑐𝑒 𝐴+1
2𝜔𝐷𝐷 but then apply the π pulse to its partner in the pair, spin B, then only the sign of the dipolar coupling component will reverse. This
means that after the application of the π pulse on spin B the precession
frequency of spin A will change to 𝜔𝑟𝑒𝑠𝑜𝑛𝑎𝑛𝑐𝑒 𝐴−1
2𝜔𝐷𝐷, and when the final refocusing pulse is applied to spin A its evolution will have accumulated a
phase lag. This will be dependent on how long after the zero evolution time
strong the dipolar coupling is, which defines the value of 𝜔𝐷𝐷. This lag in the precession causes imperfect refocussing in the final echo such that the echo
amplitude we measure will be modulated. If we apply the π pump pulse at
different intervals we can map out through the echo amplitude the oscillation
frequency 𝜔𝐷𝐷, which in turn depends on the separation distance between the two electron spins and the intersection angle of the vector joining the spins
through the static magnetic field.
The signal which we can measure as a result of the described experiment will
take the form
𝐼𝑖𝑛𝑡𝑟𝑎(𝑡) = 𝐼0cos (𝜔𝐷𝐷𝜏𝑒𝑣𝑜𝑙𝑣𝑒) , Equation 2.4.2
where 𝐼0 is the echo height without the dipolar coupling interaction, 𝜔𝐷𝐷 is the dipolar coupling and 𝜏𝑒𝑣𝑜𝑙𝑣𝑒 is the time the π pump pulse is applied relative to the zero evolution time. It is worth noting that this expression makes the
assumption that the observer pulses only act on spin A in the pair and the
pump pulse only acts on the spin B.
It is often the case that we have little interest in the 𝐼𝑖𝑛𝑡𝑒𝑟(𝑡) signal component as it usually does not contain any relevant structural information and in these
cases is referred to as the PELDOR background signal. We can minimize this
signal component by making the sample very dilute thus shifting the
dipolar couplings relative to the intra-molecule dipolar couplings. However, as
the sample volume will be fixed by practical considerations of the spectrometer
the number of spins contributing to the PELDOR signal will reduce with the
concentration and thus the minimum sample concentration will be dictated by
the sensitivity of the spectrometer and available measurement time. The
𝐼𝑖𝑛𝑡𝑒𝑟(𝑡) signal component resulting from a 3-dimensionally homogeneous distribution of spin pairs in a glassy matrix, which is the relevant case for
samples discussed in this work, can be described by the signal expression
𝐼𝑖𝑛𝑡𝑒𝑟(𝑡) = exp (−𝑘𝐶𝐹𝐵|𝜏 − 𝑡|) . Equation 2.4.3
Where 𝐶 is the sample concentration, 𝐹𝐵 is the fraction of spins excited by the pump pulse, 𝜏 is the time between the first and second pulse in the observer pulse sequence which is the zero evolution time of the observer spins and 𝑡 is the time of the pump pulse relative to the zero evolution time. The value of
the constant 𝑘 is given by [76]
𝑘 = 8𝜋 2𝜇
𝐵2𝑔𝐴𝑔𝐵 9√3ℏ Equation 2.4.4
The work presented here, and a large amount of the PELDOR experiment
applications, is to study the structure of bio-macromolecules. The sample will
often not have any unpaired electron and will be EPR silent, and will be labelled
(SDSL). SDSL targets particular residue sites on a molecule such that they will
accept the chemical attachment of a small label molecules. A spin label is a
relatively small and stable molecule which has an unpaired electron and several
types of these molecules having been developed, a topic which has been
discussed in several reviews [7, 21, 23]. What is of immediate relevance,
however, is that SDSL will result in the same type of spin label being attached
to each targeted site on the molecule and that there will be no differences
between either of the attached spin labels. To a large extent this makes it
impossible to specifically target any of the spins. This conflicts with the
previous discussion of the PELDOR experiment where we stated that we
should excite one of a pair of electron spins with the observer pulses to be a
spin A and the other electron spin in the pair with the pump pulse to be a spin
B. However, it is the case that the spectrum of the unpaired electron of the
spin label is broader than the excitation bandwidth of the pulses. This has the
direct result that for any pulse not all of the spin label spins will be excited, and
we can make the assumption that the spin label has no preferential orientation
relative to the magnet field, we will have some probability, which can be
calculated, for the pulse acting on any given spin. This means that although we
cannot individually select any spin to be a spin A or a spin B we can calculate
that there will be some number of the available spins which are excited by the
observer pulse as spin A and for those spins there will be some fraction of
those spin A which will have a partner spin B excited by the pump pulse. For
pump pulse ∆𝜆 and we can approximate this to be the fraction of spin A which have a partner spin B.
Figure 2.4.1 Left: Nitroxide spin label spectrum for a magnetic field strength of 3.3435 T in black overlaid with pump pulse excitations (green) and observe pulse profile (blue) using π pulse lengths of 10 ns. The observer pulse sequence is shown using an excitation frequency of 94.000 GHz and the pump pulse is shown using an excitation frequency of 93.875 GHz. Right: The corresponding orientation selections of the spin label relative to the magnetic field direction.
Shown in Figure 2.4.1 is a diagram of a typical nitroxide spin label spectrum
at 3.34 T or 94 GHz in black, where it is broadened from the case of a single
resonance by the hyperfine interaction and anisotropy in the g-factor value.
Shown overlaid is sketches of typical excitation bandwidths of the pump pulse
in green and the observer pulses in blue. What can be seen is that at W-band
we will often excite only a fraction ~20 % of the electron spins available in the
sample with a given pump or observer pulses. Using these assumptions and
experimental conditions we can expand expression Equation 2.4.2 of the
PELDOR sequence to give the well-known signal expression
where 𝜔𝐷𝐷will depend on the geometry of the spin pair. We can write this expression in a form which includes the dependence of these terms on the
angle Θ𝐴𝐵, which is the angle between the vector which connects the two spin and the unit vector of the magnetic field. We can then take the volume average
to arrive at the expression
𝐼𝑖𝑛𝑡𝑟𝑎(𝑡) = 1 − ∫0𝜋/2∆𝜆(Θ𝐴𝐵)(1 − cos(𝜔𝐷𝐷(Θ𝐴𝐵) 𝜏𝑒𝑣𝑜𝑙𝑣𝑒)) sin(Θ𝐴𝐵) 𝑑Θ𝐴𝐵 . Equation 2.4.6
Here it is important again to see that there is an orientation dependence on the
dipolar coupling term 𝜔𝐷𝐷(Θ𝐴𝐵), as previously discussed, but that there is also an orientation dependence on the fractional excitation, or so-called
modulation-depth, term ∆𝜆(Θ𝐴𝐵). The orientation dependence of the ∆𝜆(Θ𝐴𝐵) term will only exist if there is sufficient angular correlation between the spins. The origin of the angular dependence is that there are anisotropic
interactions in the individual spin Hamiltonians such that their resonance will
depend on their orientation inside the main magnet field. This gives up the
ability to select spins by setting our pulse microwave frequency to the
resonance corresponding to particular orientations. We can then split the
analysis of the PELDOR signal into two limiting cases, the case of random
orientation of the spin where there is no, or weak, angular correlation and the
2.5.PELDOR SIGNAL ANALYSIS:WEAK ANGULAR CORRELATION
The most commonly used spin label is the methanethiosulfonate spin label
(MTSSL) which in many cases has very weak angular correlation to either its
attachment point on the biomolecule, and to the other spin labels attached to
the molecule. This is then the weak angular correlation case, and the analysis
which is often performed is based around regularized fitting [77, 78] of
Equation 2.5.1. If we examine the previously presented signal expression
𝐼𝑖𝑛𝑡𝑟𝑎(𝑡) = 1 − ∫0𝜋/2∆𝜆(Θ𝐴𝐵)(1 − cos(𝜔𝐷𝐷(𝑟, Θ𝐴𝐵) 𝜏𝑒𝑣𝑜𝑙𝑣𝑒)) sin(Θ𝐴𝐵) 𝑑Θ𝐴𝐵 , Equation 2.5.1
we see that the without angular correlation of the spin labels the values of Θ𝐴𝐵 will have a uniform distribution of angles. This is because there is no preference
when the spin labels have no angular correlation to each other. As such
∆𝜆(Θ𝐴𝐵) will take an average value for the volume, which for a large enough volume of spin pairs, will approximately be determined by the fraction of total
spins which were excited by the pump pulse. We also generalise the value of
the dipolar coupling 𝜔𝐷𝐷 to be a function of the spin separation which is valid if there is mutual orientation correlation between the spin labels, as discussed
in earlier chapters. We can now simplify the analysis greatly by generating a
so-called discrete kernel function which will be the uniform angle distribution