https://www.scirp.org/journal/jtts ISSN Online: 2160-0481
ISSN Print: 2160-0473
DOI: 10.4236/jtts.2019.94026 Sep. 18, 2019 423 Journal of Transportation Technologies
Pedestrian Facilities Capacity and Level of
Service at Intersections in a Connected and
Autonomous Vehicle Environment
Yifan Wang
1, Ardeshir Faghri
1, Dian Yuan
1, Michael L. Vaughan
2, Mingxin Li
11Department of Civil & Environmental Engineering, University of Delaware, Newark, USA 2College of Engineering, University of Delaware, Newark, USA
Abstract
It is inevitable that Connected and Autonomous Vehicles (CAVs) will be a major focus of transportation and the automotive industry with increased use in future traffic system analysis. Numerous studies have focused on the eval-uation and potential development of CAVs technology; however, pedestrians and bicyclists, as two essential and important modes of the road users have seen little to no coverage. In response to the need for analyzing the impact of CAVs on non-motorized transportation, this paper develops a new model for the evaluation of the Level of Service (LOS) for pedestrians in a CAVs envi-ronment based on the Highway Capacity Manual (HCM). The HCM provides a methodology to assess the level of service for pedestrians and bicyclists on various types of intersections in urban areas. Five scenarios were created for simulation via VISSIM (a software) that corresponds to the different propor-tions of the CAVs and different signal systems in a typical traffic environ-ment. Alternatively, the Surrogate Safety Assessment Model (SSAM) was se-lected for analyzing the safety performance of the five scenarios. Through computing and analyzing the results of simulation and SSAM, the latter por-tion of this paper focuses on the development of a new model for evaluating pedestrian LOS in urban areas which are based upon HCM standards which are suitable for CAVs environments. The results of this study are intended to inform the future efforts of engineers and/or policymakers and to provide them with a tool to conduct a comparison of capacity and LOS related to the impact of CAVs on pedestrians during the process of a transportation system transition to CAVs.
Keywords
Connected and Autonomous Vehicles, Pedestrians, VISSIM, Level of Service, SSAM
How to cite this paper: Wang, Y.F., Fag-hri, A., Yuan, D., Vaughan, M.L. and Li, M.X. (2019) Pedestrian Facilities Capacity and Level of Service at Intersections in a Connected and Autonomous Vehicle En-vironment. Journal of Transportation Tech-nologies, 9, 423-438.
https://doi.org/10.4236/jtts.2019.94026
Received: July 12, 2019 Accepted: September 15, 2019 Published: September 18, 2019
Copyright © 2019 by author(s) and Scientific Research Publishing Inc. This work is licensed under the Creative Commons Attribution International License (CC BY 4.0).
http://creativecommons.org/licenses/by/4.0/
DOI: 10.4236/jtts.2019.94026 424 Journal of Transportation Technologies
1. Introduction
Given the advancement of sensor technologies, information technologies, and vehicle control technologies; the automation of control of vehicles has attracted much attention. The connected and autonomous technologies have become an essential part of tackling critical traffic safety, efficiency and convenience issues. Major car companies, internet companies, universities and research institutes have successively launched prototype or concept models of CAVs. Governments are also promoting autonomous technologies. The emergence of CAVs also promoted discussion of coexistence issues with other road users: conventional vehicles and non-motorized traffic [1][2][3][4][5]. It has been determined that barriers exist in applying the intelligent driving technologies to the development and implementation of CAVs, especially for mixed traffic environments where pedestrians, bicyclists, manual driving cars are present. Although the use of CAV has tremendous potential to improve vehicle safety, congestion, travel costs, and freight movement; there are tradeoffs to be considered in safety cost, liability, insurance and policy. A literature search conducted recently shows 432 United States and international articles related to autonomous vehicle issues which identified fewer than 20 that discussed pedestrian or bicycle topics, either briefly or in depth [2]. The impact of CAVs on non-motorized transportation, especially for bicycles and pedestrians, is an important area of future study and analysis. The work of this paper will focus on pedestrians. Further; as we con-sider the forward design and evolution of mixed traffic environments, it is essen-tial to consider, in a seamless way, the needs of all of road users [6][7][8].
Current research tends to be limited to the study of the impact of CAVs on fa-cilities and safety aspects in a very general way. Additional work is needed to analyze these effects to better determine the influence of CAVs on pedestrians. Further, in the life cycle of technology development there is an adaptation phase between market entry and potential societal integration which should not be mi-nimized. This is especially true of CAV technology development which has the potential to completely change the way people travel. The intended contribution of this paper is to develop a new model to evaluate the LOS related to the impact of CAVs on pedestrians within the context of the process of adaptation.
DOI: 10.4236/jtts.2019.94026 425 Journal of Transportation Technologies
1.1. Background
Many private and not-for-profit research and development (R & D) environ-ments have successively launched prototype or concept models of CAVs. Gov-ernments are also promoting autonomous technologies. In this section, this pa-per will present various factors that characterize CAV technology and allow for comparison across a varied technological industry.
1.1.1. Current Advances Related to CAVs
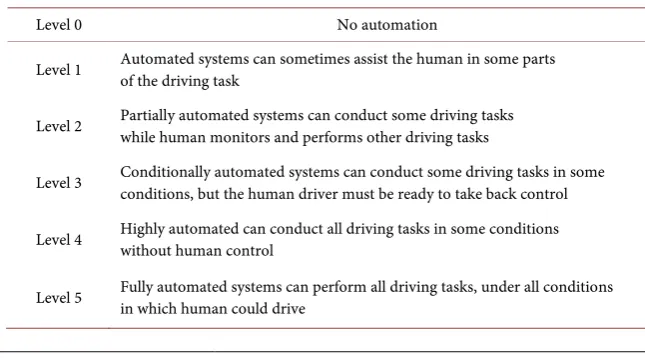
The automation grades of CAVsare divided into six levels: level 0 to level5. Ta-ble 1 shows the definition of these six levels [2].
Many CAV R & D entities devote much of their energy on designing more powerful sensors and writing more intelligent decision algorithms. At present, semi-autonomous driving systems are installed in Daimler Mercedes-Benz S-Class and E-Class sedans; where, Daimler Benz self-driving trucks began test-ing on the highway in 2015. Further, this company plans to make autopilot trucks for the road in by 2020. The automated level of new Audi A8 is in Level 3, which is also the highest level of automated driving that can be achieved in all the vehicles with the potential for mass production. With this said, efforts at Waymo, Uber, and Baidu engage in research with Level 4 autonomous driving technology. The spatial perception strategy used by these organizations is La-ser-based; where, vision, other sensors and high-precision electronic maps, with redundant functions, integrate seamlessly into vehicle dynamic control. Laser radar, which provides exceptionally high precision and robust sensing informa-tion, makes it possible for CAVs to handle extreme conditions. Recently, Way-mo brought the self-service to the public via smartphone. This smartphone app provides the online CAVs-hailing service in the Metro Phoenix area.
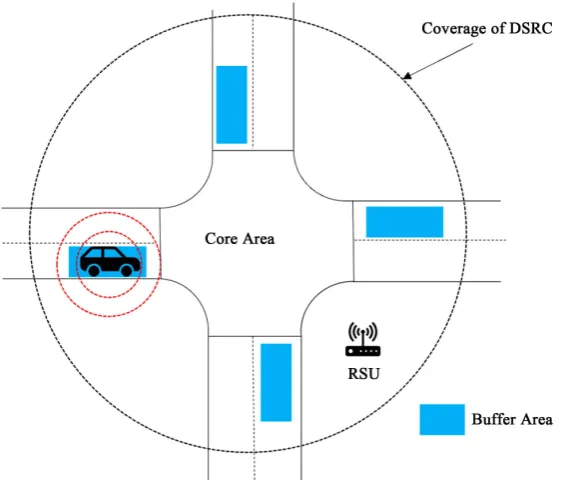
[image:3.595.206.529.562.741.2]There is a difference between the way that connected and autonomous ve-hicles run on various classes of roads. Because of the single environment, con-nected and autonomous vehicles on highways typically have lower technical re-quirements than on urban roadways. The platoon is one of the most critical concepts in CAVs. It can significantly expand the advantages of CAVs. Platooning
Table 1. The automated level of CAVs.
Level 0 No automation
Level 1 Automated systems can sometimes assist the human in some parts of the driving task
Level 2 Partially automated systems can conduct some driving tasks while human monitors and performs other driving tasks
Level 3 Conditionally automated systems can conduct some driving tasks in some conditions, but the human driver must be ready to take back control
Level 4 Highly automated can conduct all driving tasks in some conditions without human control
DOI: 10.4236/jtts.2019.94026 426 Journal of Transportation Technologies is a concept of autonomously controlling an entire fleet of vehicles; where, acce-leration, braking and steering are managed while optimizing fuel efficiency and safety. At the same time, several difficulties are in the application of CAVs on urban roads, especially in dealing with the relationship between people and ve-hicles.
1.1.2. Issues Related to CAVs
In recent decades, CAVs have achieved important breakthroughs in all dimen-sions. In concert with these advances, new issues and problems have emerged. In particular, the occurrence of multiple accidents involving CAVs has caused more thoughtful and objective discussions about the impact of CAVs. This sec-tion describes the challenges and obstacles faced by CAVs from six factors: technologies, safety issues, regulation and policy, privacy and cyber-security, and liability.
CAVs related technologies can be divided into the following parts: sensors, sensor fusion localization, motion planning and decision making. Sensor devices provide a foundation for the safe operation of CAVs. Several recent accidents that occurred in the US and China are listed in Table 2. This table only contains accidents which caused deaths. The cause of these accidents is largely related to the technical and design flaws.
[image:4.595.211.540.567.712.2]At present, the United States, Germany, and other governments have already admitted the legal status of CAVs and allowed CAVs test in the existed trans-portation system by standardizing the road test [12]. The innovation of regula-tion and policy has great significance on the development of CAVs. The most significant information security risk for CAVs is the threat of hackers and third-party control of cars. Currently, there are no laws governing CAV security and privacy issues at the state level [13] [14]. However, from the federal level, related laws have been proposed in July 2015 [15]. This legislation allows in-ter-departmental investigation of the automotive network security problem. This is also the impetus used by the National Highway Traffic System Administration (NHTSA) for formulating and publishing the relevant regulations.
Table 2. The list of CAVs fatalities.
Data Country State Automation Level Manufacturer System Vehicle Type Notes
01/20/2016 China Hebei L2 Tesla Model S fatalityDriver a
05/07/2016 USA Florida L3 Tesla Model S fatalityDriver a
03/18/2018 USA Arizona L4 Uber Refitted Volvo Pedestrian fatalityb
03/23/2018 USA California L3 Tesla Model X fatalityDriver c
DOI: 10.4236/jtts.2019.94026 427 Journal of Transportation Technologies At this point, automatic driving technologies do not have the benefit of a legal construct that fully articulates the responsibility for motor vehicle traffic acci-dents. This legal quagmire is perhaps the largest obstacle impeding the further adoption of these technologies. It is imperative that new methods to clarify the legal liability of automatic driving by legislation be determined as quickly as possible to ease the adoption of these new and innovative technologies. Of note, is a trend where, as the role of the drivers shift in the automated driving system, the legal position for liability of traffic accidents is transferred from drivers to manufacturers, software designers, and other actors involved in design and production. Therefore, all countries require the automatic driving system to in-stall a “black box” to record data, to identify the cause of the accidents and clari-fy the responsibilities of all parties [16].
At present, most countries stipulate a compulsory insurance system for road tests for self-driving cars. The commercialization of CAVs must have risk-controlled technology, which includes the participation of insurance companies. From the perspective of risk control expertise, insurance companies are willing to under-write and make CAVs officially commercialized. The insurance company gives clear parameters that indicate that the risk of CAVs commercialization is under control. As long as there is a risk of safety, it still needs to be supported by the insurance industry.
1.2. Methods of PLOS Evaluation
Level of Service (LOS) is a quantitative assessment approach for measuring the performance of traffic modes and facilities [17][18][19][20]. For the evaluation of PLOS, the earlier approaches depend on the LOS of vehicles [21]. The later research paid more attention to pedestrian safety, comfort, and flexibility. Final-ly, the methods in Highway Capacity Manual [22] proposed a complete system and the model is calibrated through numerous field experiments. The evaluation models in this system are not uniform: they are divided into various types for scenarios: segments; intersections; signalized and non-signalized intersections.
1.3. Methods of CAVs Intersection Coordination
The movement of CAVs at intersections can be described by two situations: the presence or absence of a signal system. The signal controllers for conventional vehicles aim to prioritize traffic movements and coordinate with neighboring controllers to avoid conflicting flows. Signal timing of intersections can be opti-mized to reduce the congestion delay. However, for CAVs, there exist more op-portunities to minimize control delay through communication systems. By using advanced technologies of the Internet of Vehicles, traffic systems can avoid un-necessary vehicle stops and provide safe vehicle trajectories.
ef-DOI: 10.4236/jtts.2019.94026 428 Journal of Transportation Technologies fectively prevent the collision of vehicles in the intersection by assigning a suc-cessive level of specific vehicles and avoiding the contradiction between the dif-ferent vehicle travel trajectories. Some studies established the principle of a buf-fer allocation scheduling algorithm to provide a guide to vehicles to safely pass the intersections [26]. Figure 1 shows the intersection channelization.
2. Development of VISSIM Simulation Models
Traffic simulation refers to the use of computer simulation techniques to study traffic behavior. At this point, simulation is the best alternative since CAVs have not been widely used in the real traffic system. This paper will investigate the VISSIM simulation platform. VISSIM is a microscopic traffic flow simulation system developed by PTV of Germany. The system is a discrete, random, micro-scopic simulation software with time in tenths of a second. The longitudinal movement of the vehicle is based on the “Psychology-Physiology Car Model” by Professor Wiedemann of the University of Karlsruhe, Germany. Lateral motion (lane change) uses a rule-based algorithm. The simulation of different driver behaviors is divided into conservative and aggressive.
[image:6.595.234.518.462.702.2]Compared to other simulation software; like PARAMICS, TSIS, and HCS; VISSIM can simulate multiple signals, which is especially suitable for the simu-lation of urban transportation systems. The latest version already has a complete model for CAVs which is described in the next section. Furthermore, the LOS evaluation models in VISSIM are based on HCM which meet the requirements for establishing new evaluation models with CAVs. This paper established five traffic system simulation scenarios corresponding to different proportions of CAVs.
DOI: 10.4236/jtts.2019.94026 429 Journal of Transportation Technologies
2.1. Scenarios Building
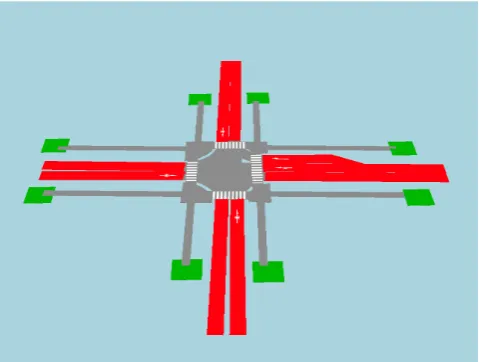
In the VISSIM simulation model, all the lane widths are set at 3.5 meters. For pedestrian crosswalks, the width is 3 meters, and for walkways, the width is set as 2 meters. Figure 2 shows the base network for all scenarios.
The vehicle traffic composition includes three types: human-driven vehicles, CAVs and freight vehicles (HGV). In this paper, two driving behaviors were se-lected: Urban (motorized) and AV (autonomous vehicles)-all-knowing. The AV all-knowing driving behavior model was developed by VISSIM and CoExist (a European project, aims at preparing the transition phase during which auto-mated and conventional vehicles will co-exist on city roads). For Urban (moto-rized) behaviors, the number of interactive objects is set as 4. The standstill dis-tance is 0.5 meters; and the car following model type is Wiedemann 74 (a car following model developed by Wiedemann in 1974). The basic concept of this model is that a driver with a high-speed vehicle will decelerate when reaching the driver self-feeling limit before reaching a low-speed vehicle. Since the driver cannot judge the speed of the low-speed car accurately, driver’s speed will drop slower than that low-speed car until the driver starts to accelerate slightly after reaching another self-feeling limit. The result of this logic is an iterative process of acceleration and deceleration. For human-driven vehicles and HGV vehicle type, they follow the Urban (motorized) driving behavior; for CAVs, they follow the AV-all-knowing driving behavior. The traffic volume of each direction is a variable for developing the new models. But the split proportions are fixed. About the pedestrian flows, same as vehicles, the volume of pedestrians in each base are variables and the route decisions are fixed which are same size ratio.
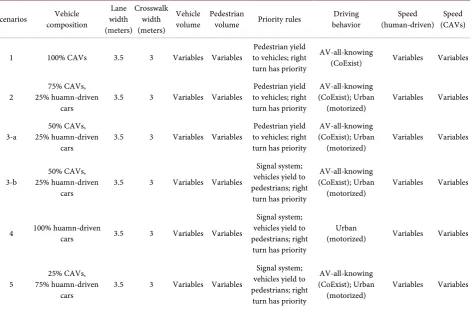
[image:7.595.254.494.523.704.2]The signal control system is a four-phase fixed system. The cycle time is 120 seconds. Every phase has 24 seconds green time, 5 seconds yellow time and 1 second all-red time. That means the inter-stage time is 5 seconds. One stage for each approach is 4 seconds. For the right turn movement from east to north, the green time is 52 seconds. Table 3 shows the basic setting of different scenarios.
DOI: 10.4236/jtts.2019.94026 430 Journal of Transportation Technologies
Table 3. Basic setting for five scenarios.
Scenarios composition Vehicle width Lane (meters)
Crosswalk width (meters)
Vehicle
volume Pedestrian volume Priority rules behavior Driving (human-driven) Speed (CAVs) Speed
1 100% CAVs 3.5 3 Variables Variables to vehicles; right Pedestrian yield turn has priority
AV-all-knowing
(CoExist) Variables Variables
2 25% huamn-driven 75% CAVs,
cars 3.5 3 Variables Variables
Pedestrian yield to vehicles; right turn has priority
AV-all-knowing (CoExist); Urban
(motorized) Variables Variables
3-a 25% huamn-driven 50% CAVs,
cars 3.5 3 Variables Variables
Pedestrian yield to vehicles; right turn has priority
AV-all-knowing (CoExist); Urban
(motorized) Variables Variables
3-b 25% huamn-driven 50% CAVs,
cars 3.5 3 Variables Variables
Signal system; vehicles yield to pedestrians; right
turn has priority
AV-all-knowing (CoExist); Urban
(motorized) Variables Variables
4 100% huamn-driven cars 3.5 3 Variables Variables
Signal system; vehicles yield to pedestrians; right
turn has priority
Urban
(motorized) Variables Variables
5 75% huamn-driven 25% CAVs,
cars 3.5 3 Variables Variables
Signal system; vehicles yield to pedestrians; right
turn has priority
AV-all-knowing (CoExist); Urban
(motorized) Variables Variables
2.1.1. CAVs Modeling in VISSIM
To define CAVs behavior in VISSIM, the logic is the same as normal vehicles. There are five aspects included in driving control logic: conflict resolution, signal control, following behavior, lane change behavior and lateral behavior
[27]. There are three predefined driving behaviors for different types of auto-nomous vehicles developed by CoExist project: AV Cautions, AV normal and AV all-knowing. AV Cautions enforces absolute braking distance, AV Normal is similar with a human driver but without the stochastic spread. The definition about AV all-knowing, set the absolute breaking distance as the vehicles can stop safely anytime (without a crash), even if the leading vehicle stops instantly. AV all-knowing has the largest interaction vehicles and objects parameters. In this paper, AV all-knowing is set as the default CAVs type.
There are two definitions to describe the character of a connected environ-ment: number of observed vehicles or objects and the number of interaction ve-hicles or objects. When the number of objects is smaller than veve-hicles, the beha-vior will be standard: the following network objects are modeled as vehicles in VISSIM. The vehicles treat these network objects as a preceding vehicle. One li-mitation of CAVs in VISSIM is about interaction behavior: the automated ve-hicles can see the signal ahead, but can only connect one or two veve-hicles sur-rounding itself since the sensors cannot see through the leading vehicles
com-DOI: 10.4236/jtts.2019.94026 431 Journal of Transportation Technologies munication. It reflects by the distance of headways. The standard driving accele-ration behavior cannot use reliable information about the future behavior of the leading vehicle. To allow CAVs keep a small headway even during an accelera-tion process, a new parameter is used. This value usually defines a percentage that is larger than 100% of the average acceleration and using this value when the leading vehicle is accelerating.
2.1.2. Calibration and Validation of the VISSIM Model
The VISSIM model cannot provide the realistic results until the model is cali-brated and validated [28] [29] [30]. Multiple calibration parameters offered by VISSIM can be modified. In this paper, the following calibration parameters were selected:
Average standstill distance;
Additive part of desired safety distance;
Multiple parts of desired safety distance;
Minimum headway;
Minimum gap time.
The number of conflicts was used to calibrate these parameters.
Finally, it was found that changing the calibration parameters did not impact the number of conflicts. Therefore, in this case, the default value of parameters was used. Specifically, average standstill distance was 2 meters, additive part of desired safety distance was 3 meters, multiple parts of desired safety distance was 3 meters, the minimum headway gap was 5 meters, and the minimum gap time was 3 seconds. The calibrated models were validated with a new set of field data, including the pedestrian volumes, and the vehicle volumes. Finally, the anima-tion of the VISSIM simulaanima-tion models was checked for any unusual events. After these operation, VISSIM model was calibrated and validate.
3. Surrogate Safety Assessment Model (SSAM) Analysis
SSAM software can automate conflict analysis by directly processing vehicle tra-jectory data from VISSIM. It can provide a summary of the total number of con-flicts broken down by type of conflict. Also, SSAM could calculate some surro-gate safety measures for each event. Five measures were relevant to evaluate traf-fic safety, which are TTC, PET, MaxS, DeltaS, DR, and MaxD. Each surrogate safety measure is defined as follow:
TTC (Time to collision): the time distance to a collision of two road users if they keep their directions and velocities. The shorter the TTC, the more dangerous the situation.
PET (Post-encroachment time): the period from the moment when the first
road user is leaving the conflict area until the second road user reaches it.
MaxS: the maximum speed of either vehicle throughout the conflict
meas-ured in meter per second.
DeltaS is the difference in vehicle speeds observed during the simulation time
DOI: 10.4236/jtts.2019.94026 432 Journal of Transportation Technologies meters per second.
DR: the initial deceleration of the second vehicle measured in meter per square second.
MaxD: the maximum deceleration of the second vehicle measured in meters per square second.
SSAM was not explicitly designed for pedestrian conflict analysis, so there is no vehicle or entity type available in the trajectory file format by which to identify pedestrian conflicts. In other words, SSAM cannot estimate the pede-strian-to-vehicle conflicts without simulating the pedestrian as vehicles in VISSIM. Therefore, to identify pedestrian-to-vehicle conflicts from all kinds of conflicts, the CSV file exported by SSAM can be of help. Filter out any conflict where MaxS is smaller than 5 mph (7.3 ft/sec), and this conflict can be related to pedestrians (which is about the walking pace of pedestrians).
At the time this research was conducted the current version of SSAM only permitted the vehicle to vehicle conflict, yet VISSIM allowed the vehicle to pede-strian interactions. An alternative approach to the one described above was to use VISSIM for simulating the vehicle-pedestrian activities, store the trajectory files, then produce a video of the simulation activities. Playing the video back and manually observing the TTC and PET using the internal clock of the video would produce the needed data.
Two values for surrogate measures of safety were used in SSAM to detect the conflicts, which are maximum TTC and maximum PET. TTC is defined as the time distance to a collision of two road users if they keep their directions and velocities. PET is defined as the period from the moment when the first road us-er is leaving the conflict area until the second road usus-er reaches it. When the maximum value of TTC is set as 1.5, then SSAM will only generate the conflict data that contains TTC value less than 1.5. In general, SSAM utilizes a default maximum TTC value of 1.5 seconds and a maximum PET value of 5 seconds to delineate the vehicle-vehicle conflicts. However, the pedestrian-vehicle conflict is different from vehicle-vehicle conflicts. That is why the maximum TTC and PET thresholds need to be established for pedestrian-vehicle conflicts.
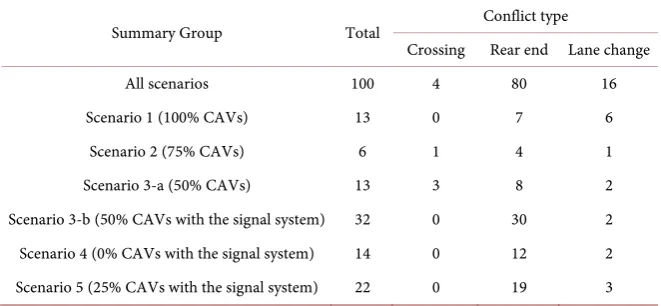
Several trials were investigated to get the optimum thresholds for TTC and PET that would define a vehicle-pedestrian conflict. Finally, it was found that when the TTC threshold ranged from 2 to 3 and the PET ranged from 5 to 9, SSAM provided a better estimate of the number of conflicts that matched the field data. Table 4 shows the results of scenario 1 from SSAM software:
All these three types include vehicle to vehicle collisions and pedestrian to ve-hicles collisions. From the previous discussion, when MaxS was smaller than 5 mph (7.3 ft/sec), the conflicts would count as pedestrian and vehicles conflicts.
4. Regression Analysis
DOI: 10.4236/jtts.2019.94026 433 Journal of Transportation Technologies
Table 4. The results of conflicts prediction and the confliction type with default value.
Summary Group Total Conflict type
Crossing Rear end Lane change
All scenarios 100 4 80 16
Scenario 1 (100% CAVs) 13 0 7 6
Scenario 2 (75% CAVs) 6 1 4 1
Scenario 3-a (50% CAVs) 13 3 8 2
Scenario 3-b (50% CAVs with the signal system) 32 0 30 2 Scenario 4 (0% CAVs with the signal system) 14 0 12 2 Scenario 5 (25% CAVs with the signal system) 22 0 19 3
regression model of PLOS evaluation was established, which contained seven essential attributes as Equation(1).
(
)
(
CAVs CAV delay)
Value LOS = f VH,SH,V ,S s,T ,NC (1)
H
V : the volume of human driven vehicles;
H
S : the speed of human-driven vehicles;
CAVs
V : the volume of the CAVs;
CAVs
S : the speed of CAVs;
p
V : the volume of pedestrian flow;
delay
T : pedestrian delay time;
C
N : the conflicts between pedestrians and vehicles.
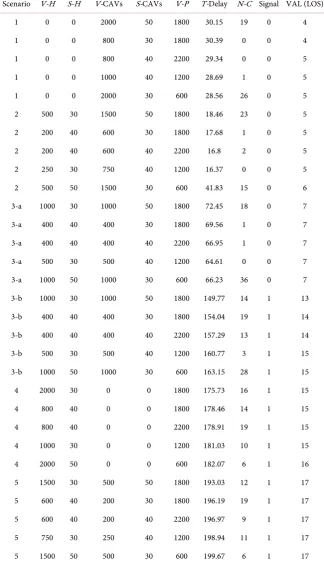
For every scenario, multiple simulations were carried out with different values of the seven parameters. The average delay time and LOS values were extracted from VISSIM. The number of conflicts between pedestrians and vehicles were from SSAM. Each simulation corresponds to different set of these seven para-meters plus the value of LOS. Results for the simulation are shown in Table 5.
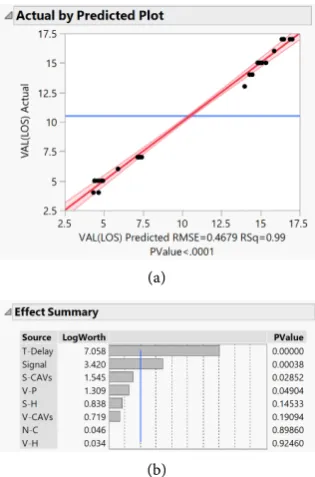
This study uses JMP software for regression analysis. And the Equation (2) below shows the relationship between PLOS and seven parameters. Figure 3 was extracted from JMP, which shows the figure of actual plot versus predicted plot.
(
)
(
)
delay CAVs CAVs
Val LOS 2.393 0.011 0.047 0.006 0.0207
0 : 1.49
0.0019 0.045 5.41 Match signal
1:1.49
H H
C p
V S T V S
N V
= − − + − +
−
+ + + +
(2)
The coefficient of regression (R2) is a vital statistic reflecting the goodness of fit of the model, which is the ratio of the sum of the squares of the regression to the sum of the total squares. R2 takes values between 0 and 1 and has no units. The larger R2 (close to 1), the better the fitted regression equation. In this model, the value of R2 equal to 0.994 which means a strong fit.
DOI: 10.4236/jtts.2019.94026 434 Journal of Transportation Technologies
Table 5. Simulation results.
Scenario V-H S-H V-CAVs S-CAVs V-P T-Delay N-C Signal VAL (LOS)
1 0 0 2000 50 1800 30.15 19 0 4
1 0 0 800 30 1800 30.39 0 0 4
1 0 0 800 40 2200 29.34 0 0 5
1 0 0 1000 40 1200 28.69 1 0 5
1 0 0 2000 30 600 28.56 26 0 5
2 500 30 1500 50 1800 18.46 23 0 5
2 200 40 600 30 1800 17.68 1 0 5
2 200 40 600 40 2200 16.8 2 0 5
2 250 30 750 40 1200 16.37 0 0 5
2 500 50 1500 30 600 41.83 15 0 6
3-a 1000 30 1000 50 1800 72.45 18 0 7
3-a 400 40 400 30 1800 69.56 1 0 7
3-a 400 40 400 40 2200 66.95 1 0 7
3-a 500 30 500 40 1200 64.61 0 0 7
3-a 1000 50 1000 30 600 66.23 36 0 7
3-b 1000 30 1000 50 1800 149.77 14 1 13
3-b 400 40 400 30 1800 154.04 19 1 14
3-b 400 40 400 40 2200 157.29 13 1 14
3-b 500 30 500 40 1200 160.77 3 1 15
3-b 1000 50 1000 30 600 163.15 28 1 15
4 2000 30 0 0 1800 175.73 16 1 15
4 800 40 0 0 1800 178.46 14 1 15
4 800 40 0 0 2200 178.91 19 1 15
4 1000 30 0 0 1200 181.03 10 1 15
4 2000 50 0 0 600 182.07 6 1 16
5 1500 30 500 50 1800 193.03 12 1 17
5 600 40 200 30 1800 196.19 19 1 17
5 600 40 200 40 2200 196.97 9 1 17
5 750 30 250 40 1200 198.94 11 1 17
5 1500 50 500 30 600 199.67 6 1 17
DOI: 10.4236/jtts.2019.94026 435 Journal of Transportation Technologies (a)
[image:13.595.294.452.69.308.2](b)
Figure 3. Predicted plots and effect summary.
5. Conclusions and Recommendations
5.1. Conclusions
This study developed a model to evaluate the impact of CAVs on pedestrians on intersections in urban areas. This model can be used for evaluating the PLOS and is a function of the factors related to CAVs, pedestrians, and other traffic characteristics. This model is suitable for urban intersections that have one lane in each direction with or without a signal system. The uniqueness of this model is that it can analyze the impact of CAVs on pedestrians regardless of the pro-portion of CAVs within the transportation system.
With a lower volume of CAVs and human-driven vehicles, the performance of PLOS without signal system would be better than with signal system. For the potential conflicts between pedestrians and vehicles, when the speed is higher, the number would be higher and impact the value of LOS. From the regression analysis, the volume of human-driven vehicles has the most contribution to the value of LOS.
The results of this study have contributed to understanding the impact of CAVs on pedestrians during the process of the CAVs’ application development. And this model can provide a reference to researchers and governments to con-sider coexistence factors related to CAVs in their future work.
5.2. Merits and Demerits
pro-DOI: 10.4236/jtts.2019.94026 436 Journal of Transportation Technologies vide a reference when dealing with the coexistence factors between CAVs and pedestrians.
Since the factors that influence the PLOS are complex and include traffic cha-racteristics, further research on signal control system and coordination methods between CAVs and traditional vehicles need to be done. The regression model required abundant simulation data to improve accuracy. Consequently, it is recommended for future studies that the number of simulation runs should be expanded. During the regression process, the factors selected were all related to traffic characteristics and signal controls. The factors related to geometric design are also important for PLOS. For example, the number of vehicle lanes and the width of the walkways is a key factor. The factors related to CAVs are insuffi-cient, especially for the impact of CAVs platoons on pedestrians. This factor will highly increase the delay time of pedestrians. And in the real world, pedestrians cannot perform like simulation models. People have a different definition of what is the safety margin for crossing. It is quite possible that without signal sys-tems, some people would not cross the roads.
5.3. Recommendations and Future Work
In future research, more parameters with the geometric design can be selected for a more comprehensive model. And the evaluation model in this paper could be extended to include the bicyclists. This extension of effort would allow the impact of CAVs on bicyclists to be evaluated using the same method.
Acknowledgements
The authors are thankful to the Department of Civil Engineering and all the staff who provide kind assistance.
Conflicts of Interest
The authors declare no conflicts of interest regarding the publication of this pa-per.
References
[1] Li, M. and Faghri, A. (2014) Cost-Benefit Analysis of Added Cycling Facilities.
Journal of the Transportation Research Board, 2468, 55-63.
https://doi.org/10.3141/2468-07
[2] Sandt, L. and Owens, J.M. (2017) Discussion Guide for Automated and Connected Vehicles, Pedestrians, and Bicyclists.
http://www.pedbikeinfo.org/cms/downloads/PBIC_AV_Discussion_Guide.pdf [3] Nerwinski, Z., Faghri, A. and Li, M. (2018) Modeling Bicycle Conflict on Non-Mo-
torized Paths on Suburban College Campuses. Journal of Transportation Technolo-gies, 8, 357-375. https://doi.org/10.4236/jtts.2018.84020
DOI: 10.4236/jtts.2019.94026 437 Journal of Transportation Technologies
[5] Li, M. and Faghri, A. (2018) A Framework to Analyze the Economic Feasibility of Cycling Facilities. In: Bicycle Urbanism, Routledge, New York, 140-159.
https://doi.org/10.4324/9781315569338-9
[6] Vaughan, M.L., Faghri, A. and Li, M. (2017) An Interactive Expert System Based Decision Making Model for the Management of Transit System Alternate Fuel Ve-hicle Assets. Intelligent Information Management,9, 1-20.
https://doi.org/10.4236/iim.2017.91001
[7] Li, M., Rouphail, N.M., Mahmoudi, M., Liu, J. and Zhou, X. (2017) Multi-Scenario Optimization Approach for Assessing the Impacts of Advanced Traffic Information under Realistic Stochastic Capacity Distributions. Transportation Research Part C:
Emerging Technologies,77, 113-133. https://doi.org/10.1016/j.trc.2017.01.019
[8] Vaughan, M.L., Faghri, A. and Li, M. (2018) Knowledge-Based Decision-Making Model for the Management of Transit System Alternative Fuel Infrastructures. In-ternational Journal of Sustainable Development & World Ecology,25, 184-194.
https://doi.org/10.1080/13504509.2017.1333541
[9] Vlasic, B. and Boudette, N.E. (2016) Self-Driving Tesla Was Involved in Fatal Crash, U.S. Says.
https://www.nytimes.com/2016/07/01/business/self-driving-tesla-fatal-crash-investi gation.html
[10] Newcomer, E. (2018) Uber Puts First Self-Driving Car Back on the Road since Death.
https://www.bloomberg.com/news/articles/2018-12-20/uber-puts-first-self-driving-car-back-on-the-road-since-death
[11] Green, J. (2018) Tesla: Autopilot Was on during Deadly Mountain View Crash.
https://www.mercurynews.com/2018/03/30/tesla-autopilot-was-on-during-deadly-mountain-view-crash
[12] Taeihagh, A. and Lim, H.S.M. (2019) Governing Autonomous Vehicles: Emerging Responses for Safety, Liability, Privacy, Cybersecurity, and Industry Risks. Trans-port Reviews,39, 103-128. https://doi.org/10.1080/01441647.2018.1494640
[13] Howard, D. and Dai, D. (2014) Public Perceptions of Self-Driving Cars: The Case of Berkeley, California. Transportation Research Board 93rd Annual Meeting, Wash-ington DC, January 2014, 1-16.
[14] Fraedrich, E. and Lenz, B. (2014) Automated Driving: Individual and Societal As-pects. Transportation Research Record,2416, 64-72.
https://doi.org/10.3141/2416-08
[15] Bollinger, B.L. (2017) The Security and Privacy in Your Car Act: Will It Actually Protect You? North Carolina Journal of Law & Technology,18, 214-243.
[16] Marchant, G.E. and Lindor, R.A. (2012) The Coming Collision between Autonom-ous Vehicles and the Liability System. Santa Clara Law Review,52, 1321-1340. [17] Elias, A. (2011) Automobile-Oriented or Complete Street? Pedestrian and Bicycle
Level of Service in the New Multimodal Paradigm. Transportation Research Record, 2257, 80-86. https://doi.org/10.3141/2257-09
[18] Suarez, R., Faghri, A. and Li, M. (2014) Evaluation of the Accuracy and Automation of Travel Time and Delay Data Collection Methods. Journal of Transportation Technologies,4, 72-83. https://doi.org/10.4236/jtts.2014.41007
DOI: 10.4236/jtts.2019.94026 438 Journal of Transportation Technologies
https://doi.org/10.1061/(ASCE)EI.1943-5541.0000274
[20] Li, M., Faghri, A., Ozden, A. and Yue, Y. (2017) Economic Feasibility Study for Pavement Monitoring Using Synthetic Aperture Radar-Based Satellite Remote Sensing: Cost-Benefit Analysis. Transportation Research Record: Journal of the Transportation Research Board,2645, 1-11. https://doi.org/10.3141/2645-01
[21] Raad, N. and Burke, M.I. (2018) What Are the Most Important Factors for Pede-strian Level-of-Service Estimation? A Systematic Review of the Literature. Trans-portation Research Record,2672, 101-117.
https://doi.org/10.1177/0361198118790623
[22] HCM (2000) Highway Capacity Manual. TRB, National Research Council, Wash-ington DC.
[23] Pandit, K., Ghosal, D., Zhang, H.M. and Chuah, C.N. (2013) Adaptive Traffic Signal Control with Vehicular Ad Hoc Networks. IEEE Transactions on Vehicular Tech-nology,62, 1459-1471. https://doi.org/10.1109/TVT.2013.2241460
[24] Li, M., Zhou, X. and Rouphail, N.M. (2017) Quantifying Travel Time Variability at a Single Bottleneck Based on Stochastic Capacity and Demand Distributions. Jour-nal of Intelligent Transportation Systems: Technology, Planning, and Operations, 21, 79-93. https://doi.org/10.1080/15472450.2016.1163639
[25] Zhang, K., Zhang, D., de La Fortelle, A., Wu, X. and Gregoire, J. (2015) State-Driven Priority Scheduling Mechanisms for Driverless Vehicles Approaching Intersections.
IEEE Transactions on Intelligent Transportation Systems,16, 2487-2500.
https://doi.org/10.1109/TITS.2015.2411619
[26] Lin, P., Liu, J., Jin, P.J. and Ran, B. (2017) Autonomous Vehicle-Intersection Coor-dination Method in a Connected Vehicle Environment. IEEE Intelligent Transpor-tation Systems Magazine,9, 37-47. https://doi.org/10.1109/MITS.2017.2743167
[27] Sukennik, P. (2018) Default Behavioural Parameter Sets for AVs. PTV Group.
https://www.h2020-coexist.eu/wp-content/uploads/2018/10/D2.4-Vissim-extension -new-features-and-improvements_final.pdf
[28] Hamad, K., Faghri, A. and Li, M. (2015) Forecasting Model for Vehicular Demand: An Alternative Methodology in the Context of Developing Countries. The Journal of Developing Areas,49, 125-143. https://doi.org/10.1353/jda.2015.0006
[29] Wu, J. (2017) Analysis of Pedestrian Safety Using Micro-Simulation and Driving Simulator. University of Central Florida, Orlando.
[30] Wahed, M., Faghri, A. and Li, M. (2017) An Innovative Simulation Model for the Operations of a Multipurpose Seaport: A Case Study from Port of Wilmington, USA. International Journal of Simulation and Process Modelling, 12, 151-164.